2699
Comparisons of Bayesian against non-Bayesian algorithms in intravoxel incoherent motion (IVIM) diffusion-weighted imaging in breast cancer1Institute of Medical Sciences, University of Aberdeen, Aberdeen, United Kingdom, 2Oncology Department, Aberdeen Royal Infirmary, Aberdeen, United Kingdom, 3Radiology Department, Royal Marsden Hospital, London, United Kingdom, 4Pathology Department, Aberdeen Royal Infirmary, Aberdeen, United Kingdom, 5Breast Unit, Aberdeen Royal Infirmary, Aberdeen, United Kingdom
Synopsis
Intravoxel incoherent motion (IVIM) model approximates the tissue perfusion as a form of pseudo-diffusion, extracted as fast diffusion component in diffusion weighted imaging (DWI). Despite the central role of tissue perfusion in the angiogenesis in cancer, the clinical application of IVIM is hampered due to the susceptibility to noise and tendency of overfitting bi-exponential decay function. Recent introduction of Bayesian algorithm significantly enhanced the robustness and accuracy of IVIM method, renewing its potential as a clinical tool. We therefore set out to examine current IVIM algorithms in the context of neoadjuvant chemotherapy on patients with breast cancer preceding the treatment.
Introduction
Radiological methods beyond crude tumour size are critical for precision medicine in oncology, and intravoxel incoherent motion (IVIM) model has been proposed to approximate tissue perfusion1. However, clinical utility of IVIM was hampered by susceptibility to noise and the potential of overfitting bi-exponential functions2. A number of fitting algorithms3 have been developed with recent introduction of Bayesian approach4, renewing the potential of IVIM as a clinical tool. Breast cancer contributes to 1 in 4 female cancer5, prompting the development of a wide range of new drugs. We therefore set out to examine the sensitivity, precision and uniqueness of the current four fitting algorithms in the context of patients with breast cancer before undergoing neoadjuvant chemotherapy (NACT).Methods
Seventeen patients (age 46 – 58 years) with invasive ductal carcinoma of the breast participated in the clinical trial. All patients were prescribed with NACT and scanned before the treatment. The study was approved by the London Research Ethics Committee (Identifier: 17/LO/1777), and written informed consent was obtained from all the participants prior to the study.Image Acquisition
All data were acquired on a 3 T whole body clinical MRI scanner (Achieva TX, Philips Healthcare, Best, Netherlands) using a body coil for uniform transmission and a 16-channel breast coil for high sensitivity detection. Sagittal DWI images were acquired using pulsed gradient spin echo sequence with single-shot echo planar imaging at 10 b-values (0, 30, 60, 90, 120, 250, 400, 600, 800, 1000 s/mm2)3. Images were acquired with field of view 240 mm × 200 mm × 90 mm, voxel size 2.5 mm × 2.5 mm, slice thickness 5 mm, repetition time 2400 ms and echo time 50 ms.
Image Analysis
The data analysis and curve fitting algorithms were performed in MATLAB (R2020a, Mathworks, Natrick, MA, USA). Data was processed on a voxel-by-voxel basis, using the bi-exponential equation2. Four algorithms commonly used in solving IVIM model were implemented, including nonlinear least squares (Free), segmented-unconstrained (SU), segmented-constrained (SC) and Bayesian probability-based (Bayesian) algorithms6. All lesions were identified on a DWI image acquired at b = 1000 s/mm2. The region-of-interests (ROIs) were manually drawn using ImageJ (v1.58k, National Institute of Health, Bethesda, MD, USA), with boundary restricted inside the tumour edge to avoid partial volume artefact.
Statistical Analysis
Statistical analysis was performed in R (v3.6.3, R Foundation for Statistical Computing, Vienna, Austria). The difference between IVIM-derived parameters (f, D, D*) estimated by Bayesian against the 3 non-Bayesian algorithms was calculated by Wilcoxon signed rank test with Bonferroni correction (p < 0.017, 3 multiple comparisons), followed by a Pearson’s correlation test. The sensitivity was assessed by the effect gradient, calculated from the slope of the line of best fit. The precision of the algorithm was calculated by the with-in subject coefficient of variation (CoV) of each patient. The CoVs obtained from different algorithms were compared using within-subject ANOVA, followed by post hoc analysis with Bonferroni correction (p < 0.017, 3 multiple comparisons). The uniqueness of the algorithm was assessed by Spearman’s rank correlation test to examine the correlations of f & D, f & D* and D & D* in each algorithm. A p value < 0.05 was considered statistically significant.
Results
Bayesian f was significantly lower than that from Free (p < 0.001), and significantly higher than that from SU and SC (both p < 0.001) (Table 1). Bayesian f showed a significant linear correlation with SU (r = 0.788, p < 0.001) and SC (r = 0.822, p < 0.001). Bayesian f yielded a higher relative effect gradient than SU (0.334/0.666, 50.2%) and SC (0.321/0.679, 47.3%) (Figure 1). Bayesian D was significantly lower than that from Free (p < 0.001), but not from segmented algorithms (p = 0.030). Bayesian D showed a significant linear correlation with all non-Bayesian algorithms (p < 0.001). Bayesian D yielded a higher relative effect gradient than Free (0.074/0.926, 8.00%), SU and SC (both 0.017/0.983, 1.73%). Bayesian D* was significant lower than Free and SC (both p < 0.001), although no significant difference from SU (p = 0.035). Bayesian D* showed a significant linear correlation with SU (p < 0.001) and a higher relative effect gradient (0.550/0.450, 122.0%). Bayesian D and D* yielded the lowest CoVs while SC f yielded the lowest CoV (Table 2, Figure 2). For pairwise correlations of f & D, f & D* and D & D*, there were no significant correlations in all algorithms (Table 3).Discussion
We showed different IVIM curve-fitting algorithms significantly impacted on the estimation of parameters. There were significant differences in the estimation of blood microcirculation (f) between Bayesian, Free and segmented approaches. Correlation analysis of IVIM-derived parameters indicated that Bayesian algorithm had a higher effect gradient in the estimation of blood microcirculation (f) and tissue diffusion (D). Overall, Bayesian algorithm outperformed other algorithms in terms of sensitivity and the higher sensitivity allows a better differentiation of tissue response.Conclusion
We compared four IVIM-based algorithms in terms of sensitivity, precision and uniqueness. Bayesian probability-based algorithm showed an overall better performance in estimation of f, D and D* in breast cancer.Acknowledgements
The authors would like to thank Dr Matthew Clemence, Philips Healthcare Clinical Science, UK, for clinical scientist support, Ms Erica Banks and Ms Alison McKay for patient recruitment support, Ms Teresa Morris and Ms Dawn Younie for logistics support, Ms Beverly McLennan, Ms Nichola Crouch, Ms Laura Reid, Mr Mike Hendry for radiographer support, and Dr. Gordon Urquhart for providing access to the patients. This project was jointly funded by Friends of Aberdeen and North Centre for Haematology, Oncology and Radiotherapy (ANCHOR), NHS Grampian Endowment Research Fund and Tenovus Scotland.References
1. Le Bihan D, Breton E, Lallemand D, Grenier P, Cabanis E, Laval-Jeantet M. MR imaging of intravoxel incoherent motions: application to diffusion and perfusion in neurologic disorders. Radiology. 1986;161(2):401-7.
2. Liu C, Liang C, Liu Z, Zhang S, Huang B. Intravoxel incoherent motion (IVIM) in evaluation of breast lesions: comparison with conventional DWI. Eur J Radiol. 2013;82(12):e782-9.
3. Bedair R, Priest AN, Patterson AJ, et al. Assessment of early treatment response to neoadjuvant chemotherapy in breast cancer using non-mono-exponential diffusion models: a feasibility study comparing the baseline and mid-treatment MRI examinations. Eur Radiol. 2017;27(7):2726-36.
4. Vidić I, Jerome NP, Bathen TF, Goa PE, While PT. Accuracy of breast cancer lesion classification using intravoxel incoherent motion diffusion-weighted imaging is improved by the inclusion of global or local prior knowledge with bayesian methods. J Magn Reson Imaging. 2019;50(5):1478-88.
5. Bray F, Ferlay J, Soerjomataram I, Siegel RL, Torre LA, Jemal A. Global cancer statistics 2018: GLOBOCAN estimates of incidence and mortality worldwide for 36 cancers in 185 countries. CA Cancer J Clin. 2018;68(6):394-424.
6. Barbieri S, Donati OF, Froehlich JM, Thoeny HC. Impact of the calculation algorithm on biexponential fitting of diffusion-weighted MRI in upper abdominal organs. Magn Reson Med. 2016;75(5):2175-84.
Figures
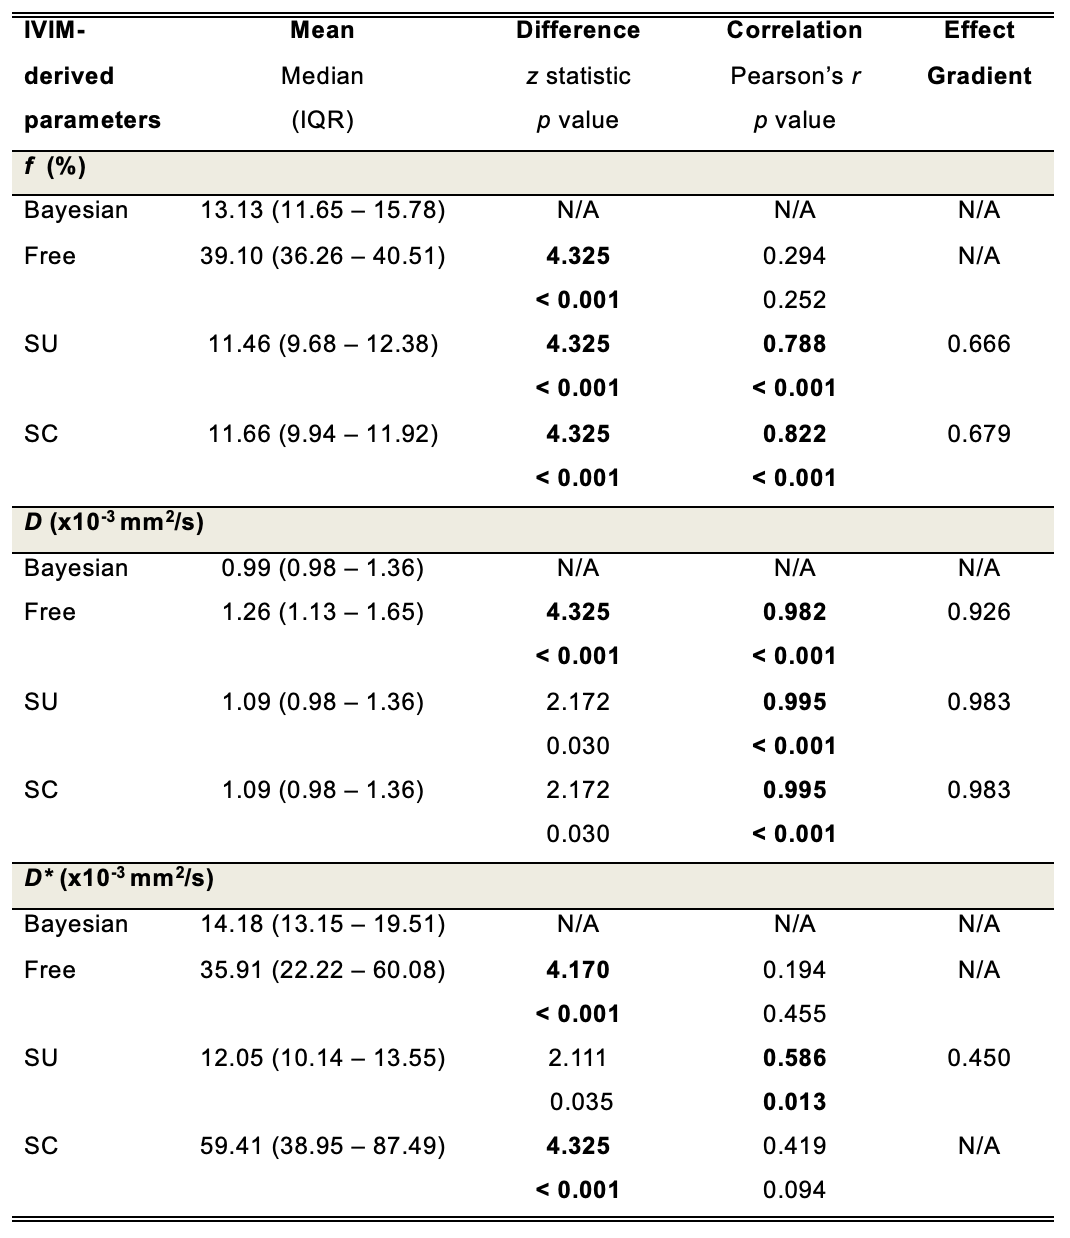
Table 1. Sensitivity – a comparison of effect gradients for IVIM-derived parameters from four fitting algorithms
Perfusion fraction (f), apparent diffusivity (D) and pseudo-diffusivity (D*) from each algorithm (n=17). The difference between Bayesian and non-Bayesian algorithms was calculated by Wilcoxon signed rank test with z statistics and p values. The Pearson’s correlation coefficient r and p values are also shown, and the gradient of the line of best fit was calculated for significant correlations. Figures in bold indicate statistical significant difference (p < 0.017).
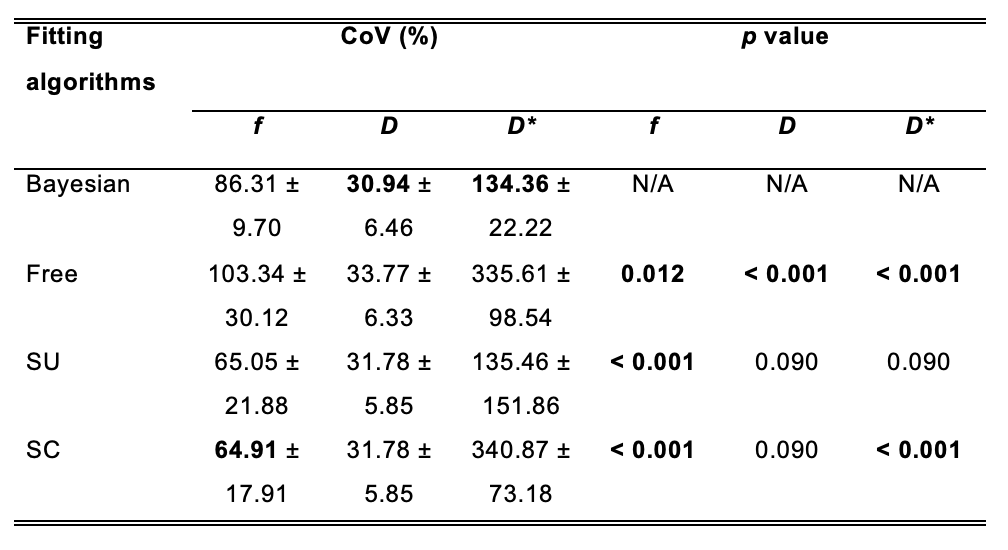
Table 2. Precision – a comparison of coefficients of variation (CoVs) for IVIM-derived parameters from four fitting algorithms
The CoVs obtained from four fitting algorithms are shown. The left column shows the mean and standard deviation of CoVs (in percentage) (n=17). The right column shows p values of pairwise comparison of CoV between Bayesian method and non-Bayesian methods. Figures in bold indicate the lowest CoV among the algorithms and statistical significant difference (p < 0.017).
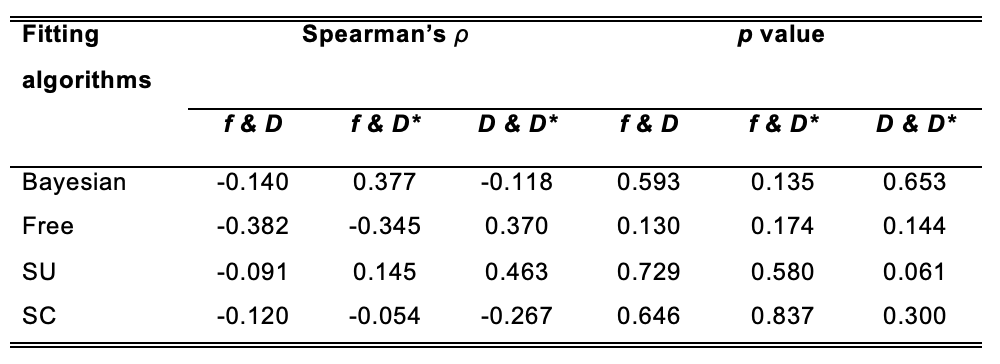
Table 3. Uniqueness – a comparison of correlations between IVIM-derived parameters in each fitting algorithm
The correlations of f & D, f & D* and D & D* in each algorithm are shown. The left column shows Spearman’s rho (ρ) of the pairwise comparison of parameters (n=17). The right column shows p values of Spearman’s rank correlation test. There were no significant correlations in f & D, f & D* and D & D* in all algorithms.
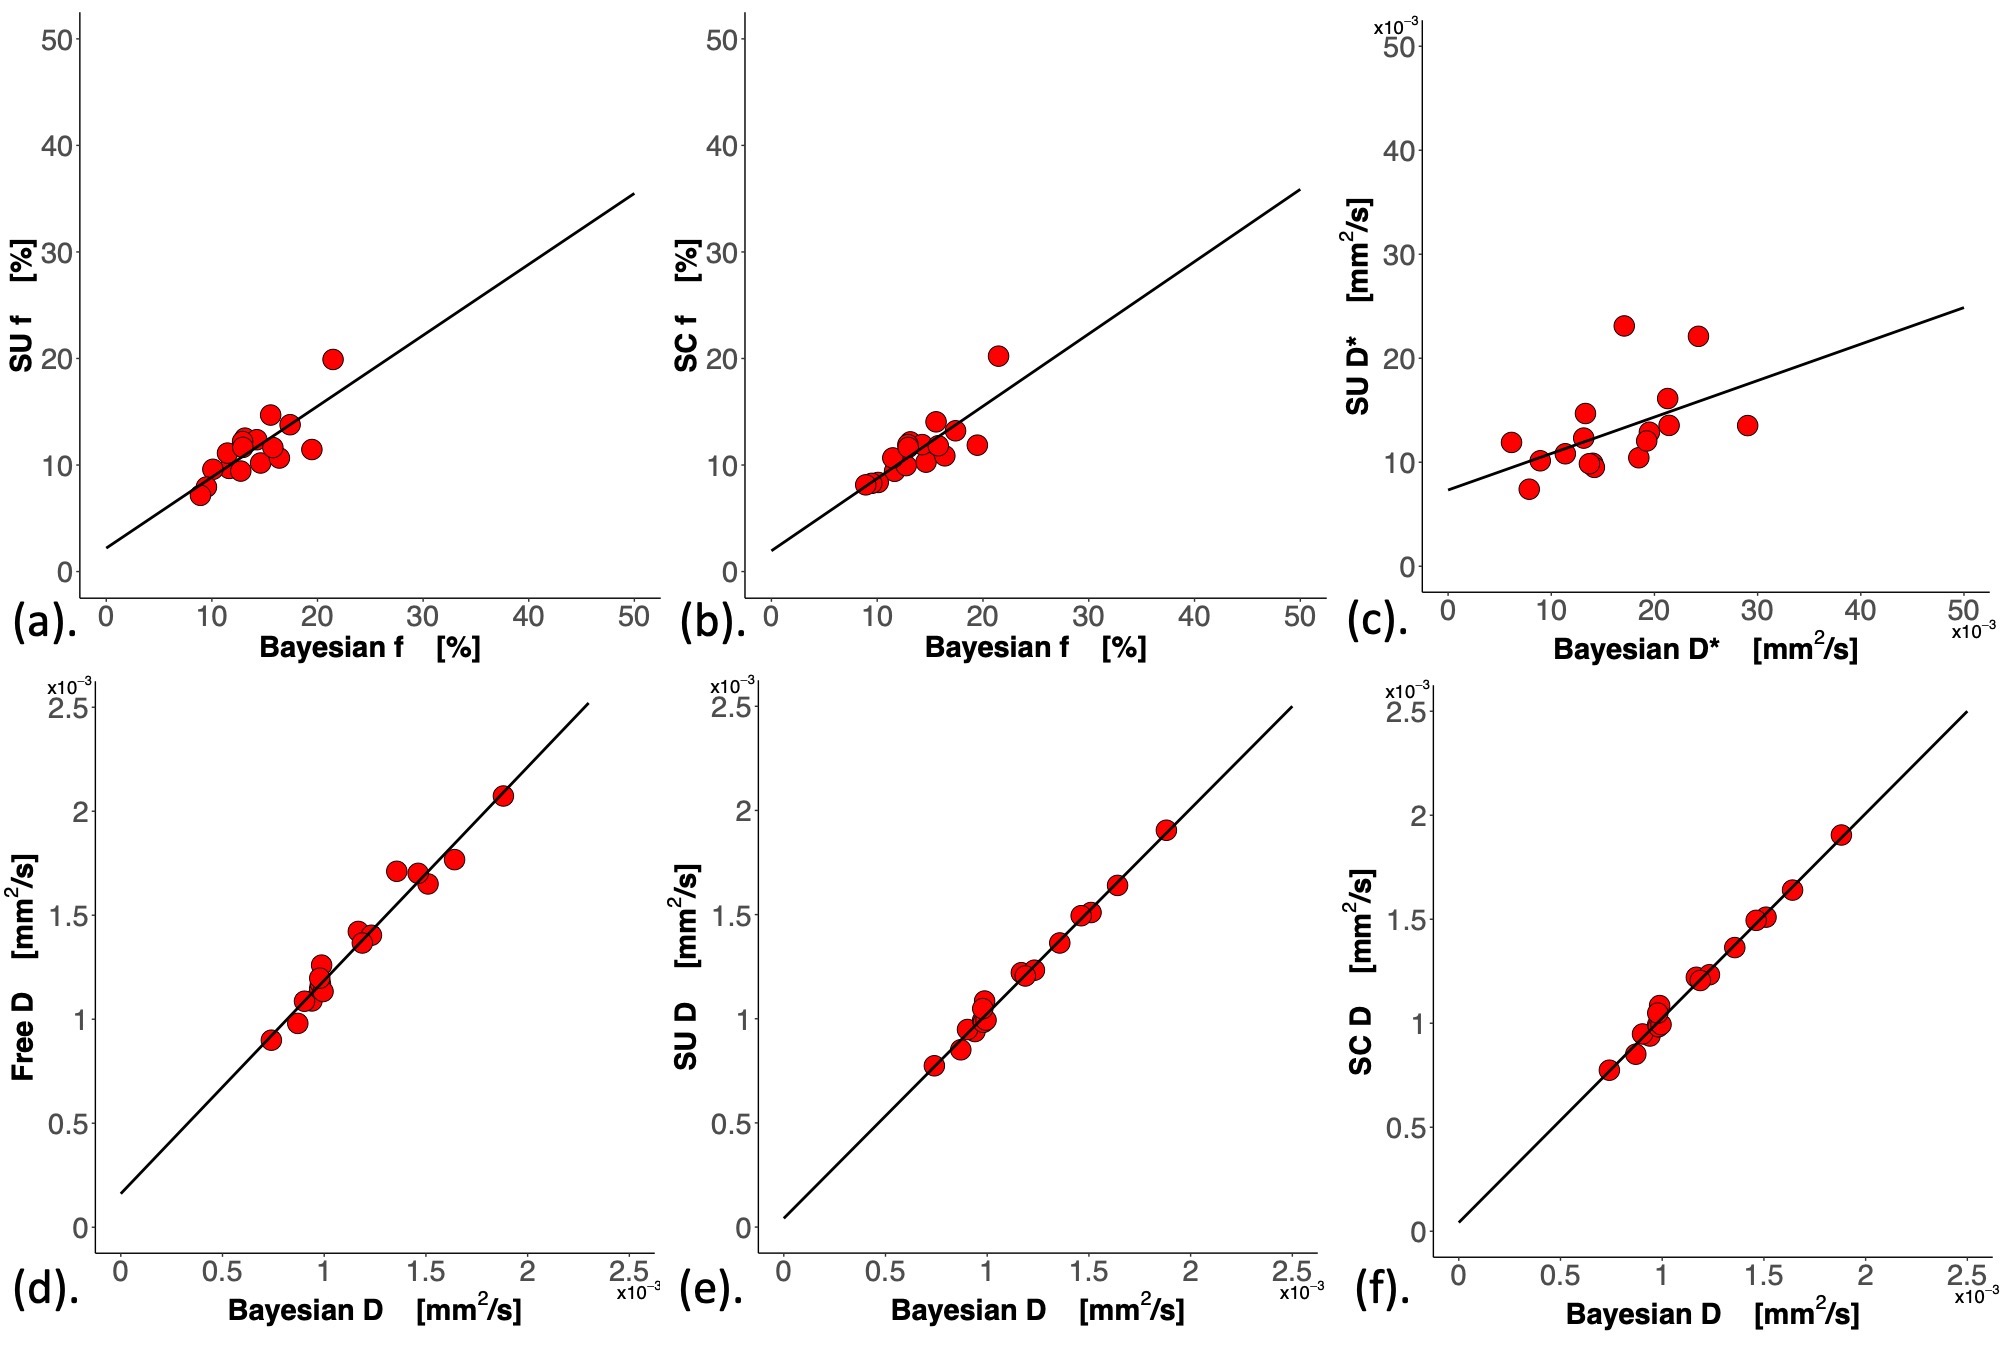
Figure 1. Effect gradient of the four fitting algorithms.
The scatter plots of IVIM-derived parameters (a) Bayesian f vs Segmented unconstrained (SU) f, (b) Bayesian f vs Segmented constrained (SC) f, (c) Bayesian D* vs SU D*, (d) Bayesian D vs nonlinear least squares (Free) D, (e) Bayesian D vs SU D and (f) Bayesian D vs SC D. Only significant Pearson’s r correlations (p < 0.017) with the line of best fit are shown. Each dot represents an IVIM-derived parameter of an individual patient.
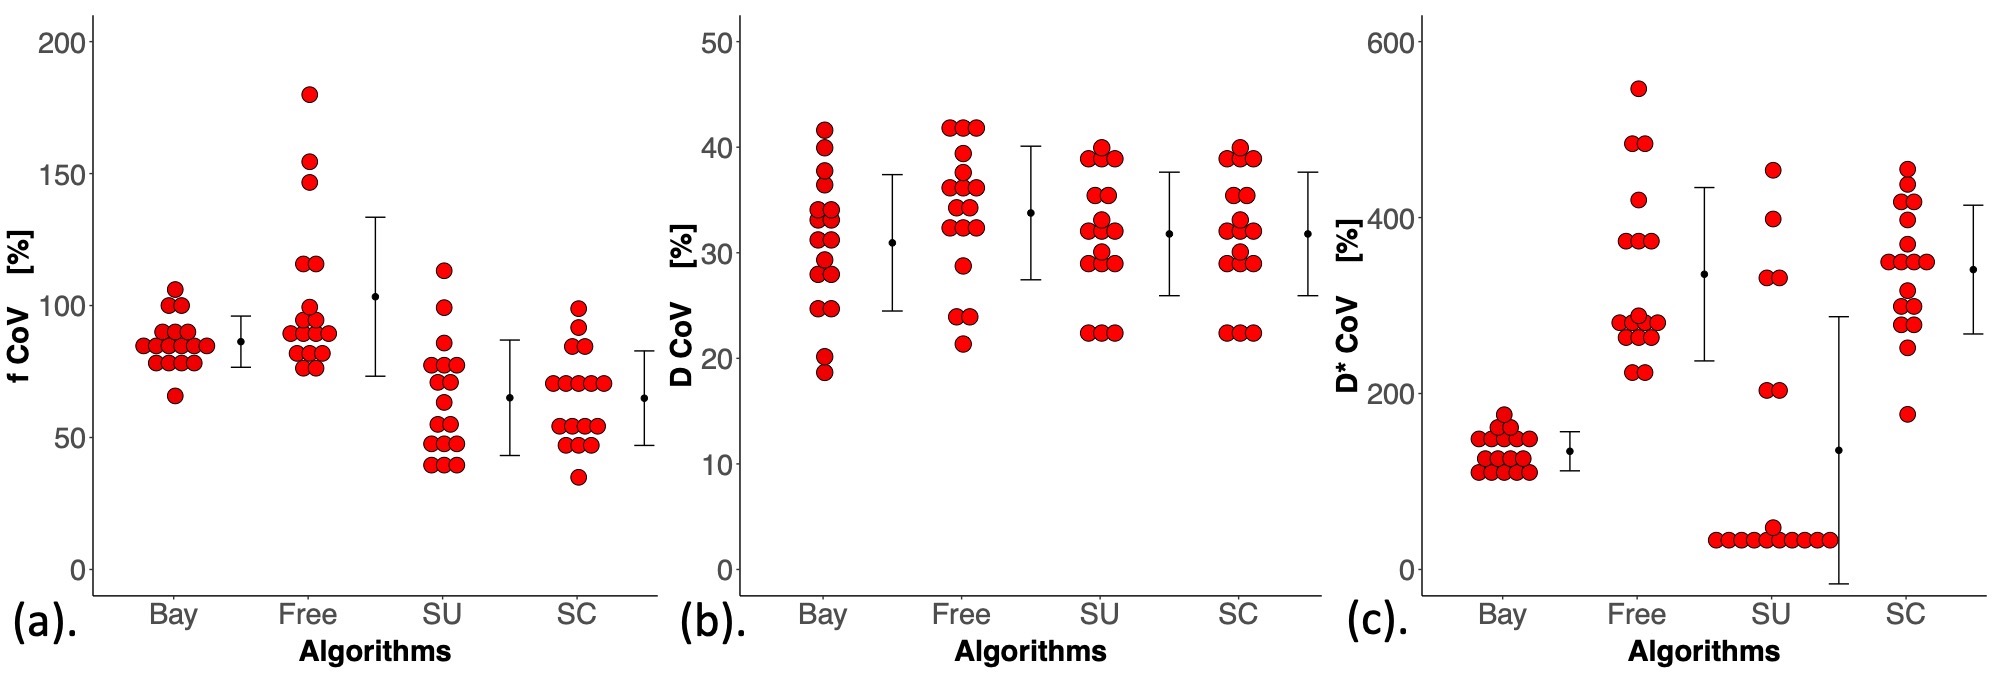
Figure 2. Dot plots of coefficients of variation (CoVs) of the four fitting algorithms.
The differences in CoVs in (a) f, (b) D and (c) D* between the four fitting algorithms are shown in dot plots. Each dot represents the CoV within an individual patient. The error bar indicates the mean and standard deviation. The CoVs obtained from different algorithms were compared using within-subject ANOVA, followed by post hoc analysis with Bonferroni correction (p < 0.017, 3 multiple comparisons) to assess the difference between Bayesian algorithm and non-Bayesian algorithms.