2698
MAGiC in glioma: Are pre-contrast quantitative MRI parameters different in tumors with versus without enhancement?1Erasmus MC, Rotterdam, Netherlands, 2Erasmus MC Cancer Institute, Rotterdam, Netherlands, 3TU Delft, Delft, Netherlands
Synopsis
We analyze quantitative values in glioma obtained with MAGiC, which allows obtaining quantitative T1, T2 and PD maps in one single acquisition of less than 6 minutes for a whole brain. The maps were obtained before contrast-agent injection in 14 patients with glioma. We investigated the possibility of characterizing tumor regions based on quantitative maps acquired without contrast-agent. The results showed significant differences among tumoral tissue, tissue with T1w-enhancement, and normal white matter. Voxel-wise, this allowed to distinguish tumoral tissue but did not allow to accurately predicting T1w-enhancement. However, promising results were found predicting T1w-enhancement inside the tumor.
Introduction
The standard assessment of gliomas includes several weighted images1,2. Fast quantitative MR imaging could improve these protocols by reducing scan-time and system-variability3–5 but must be validated. Characterization of tumor tissue and enhancement prediction using quantitative maps were reported6–9, but focusing only on T16,7 or T28,9. In this work, we characterized gliomas using parametric maps obtained using MAGiC acquired before contrast injection and investigated its T1w-enhancement prediction capability.Methods
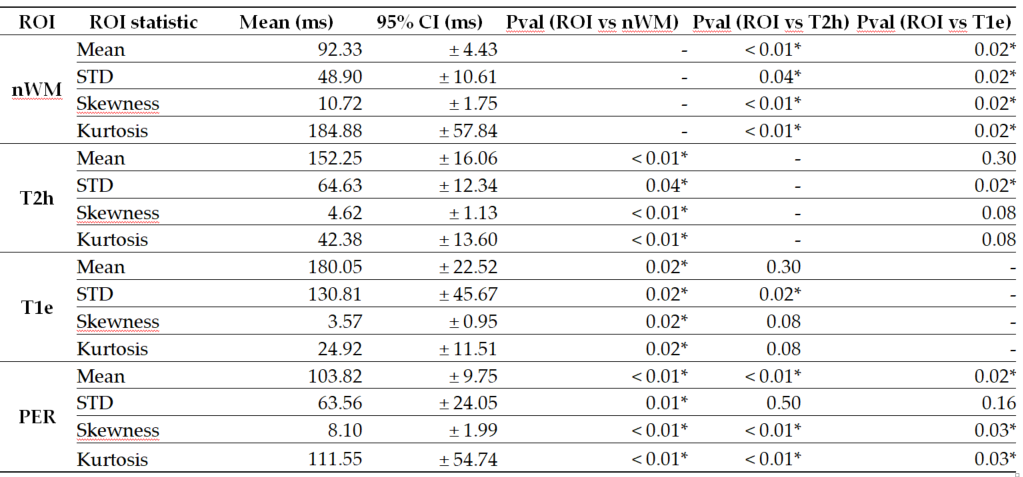
Acquisitions were performed after Institutional Review Board approval with GE 3.0T systems (General Electric Medical Systems, USA): GE-MR750 and GE-Signa-Premier. A 16-channel Head and Neck array coil was used. After giving informed consent, 14 patients were scanned. The whole brain was acquired in 5min and 34s using MAGiC before contrast-agent injection, with TE=92.24ms, TR=4000ms, FOV=224mm, slice-thickness=4 mm, and voxel-size=0.875x0.875x5mm3.The T1w, T1c, T2w and T2-FLAIR were used to segment the gliomas using HD-GLIO10,11. Regions of interest (ROIs) were defined for the non-enhancing-T2-weighted-hyperintensities (T2h) and for T1w-enhancement (T1e). Also, an ROI of 1cm around the tumor for the peritumoral area (PER) was defined, other for normal white matter (nWM), and another joining T2h and T1e (TUM). The mean, standard deviation (STD), Skewness, and Kurtosis for T1 and T2 were computed inside each ROI. The average across patients and 95% confidence interval (CI) were computed and signed-rank Wilcoxon test used to detect differences between ROIs.
Receiver operating characteristic curve (ROC) analysis12 was performed to distinguish between TUM and nWM; T1e and the rest; and T1e and T2h. We considered T1, T2, the Euclidian norm of T1 and T2 (normT1T2) and the Euclidian norm of the logarithm of T1 and T2 (normlog). The optimal operating point was calculated as the highest Youden’s index13. The threshold obtained was applied to the quantitative maps.
A cross-validated ROC analysis was performed to distinguish T1w-enhancement in tumors by the leaving-pair-out14 method. The threshold associated with Youden’s index was applied to classify the left-out-pair. Then the average AUC, sensitivity, specificity, and accuracy were calculated.
Results
Figures 1 and 2report tables with the ROIs statistics.Voxel-wise
To discriminate between TUM and nWM, normlog was the metric with the highest AUC (0.95), with sensitivity=92.03%, specificity=86.88% at threshold=8.44. For distinguishing T1w-enhancement, normT1T2 had the highest AUC (0.85), with a priori sensitivity=81.79%, specificity= 71.99% at threshold= 1344ms.
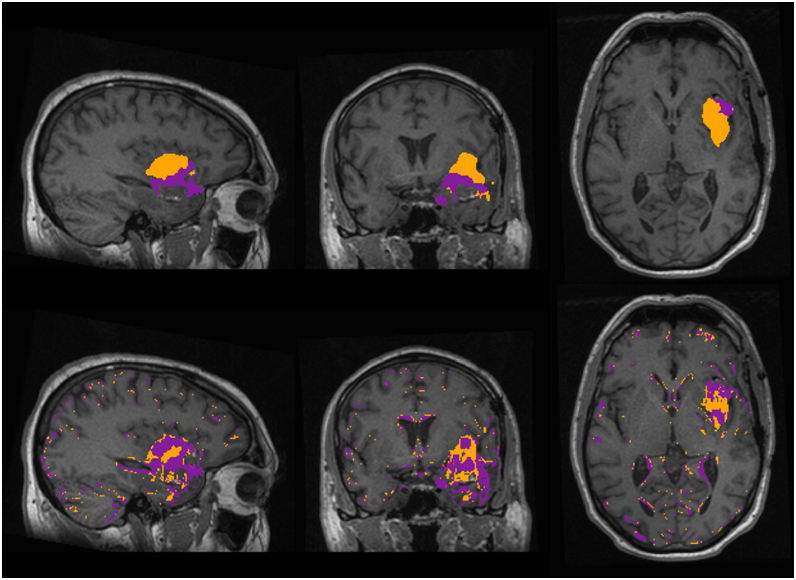
Figure 3 shows the segmentations for one patient using HD-GLIO and applying the thresholds from the ROC analysis. Voxels with normlog> 8.44 were classified as tumor (TUM*), and with normT1T2>1344ms as T1w-enhancement (T1e*).
TUM overlapped TUM*with some mismatches at the edges of the tumor. For T1e*, although it captured most of the T1-enhacement, it misclassified non-enhanced regions. Across all the patients, the mean (95% CI) sensitivity was 77% (±7.5) for T1e* and 69% (±9.1) for TUM*, specificity was 89% (±2.8) for T1e* and 86% (±4.0) for TUM*, and accuracy was 89% (±2.8) for T1e* and 85% (±3.8) for TUM*.
T1w-enhancement
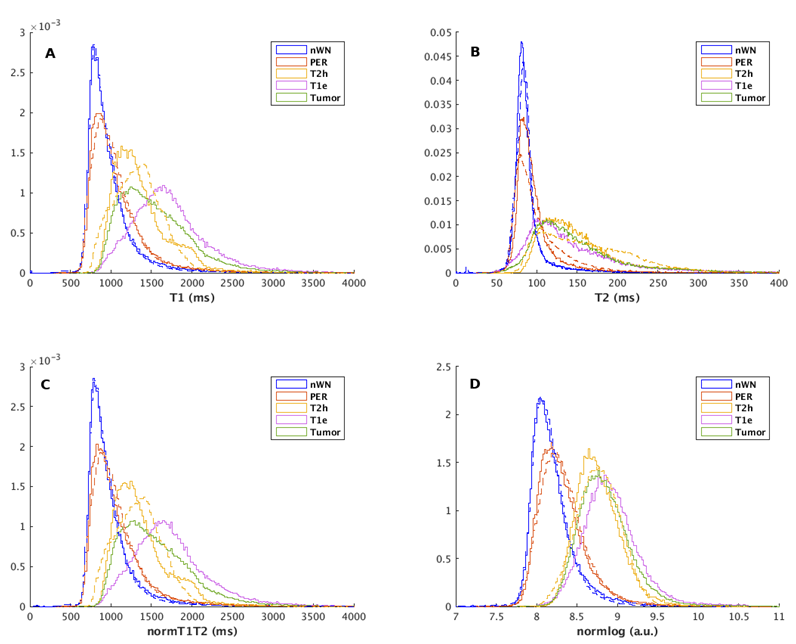
The PDF of the T1, T2, normT1T2 and normlog are plotted for patients with and without T1w-enhancement (Figure 4).
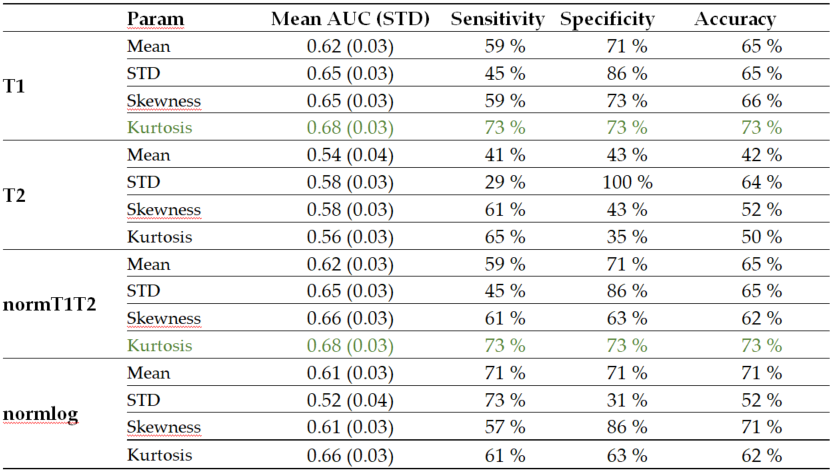
Figure 5 shows a table with the mean AUC, sensitivity, specificity and accuracy obtained from the leave-pair-out analysis. The highest AUC was obtained using T1 and the normT1T2 (0.68).
Discussion
The results show that the distributions of T1 and T2 values differentiate tumors from normal white matter. Regarding voxel-wise T1w-enhancement, the amount of misclassified voxels without enhancement as T1e* could lead to false positives. It could be that pre-contrast quantitative images deviate in the enhancing tumor due to some leakage in the blood-brain barrier (BBB) not appreciable in conventional images15,16, or something else correlated with BBB leakage. However, it is possible that only applying a threshold to the pre-contrast quantitative images has moderate ability to detect T1w-enhancement15.The analysis done on tumors showed that it could be possible to discriminate between enhancing and non-enhancing tumors. It seems that the process of contrast leakage is correlated with the structural information obtained in the pre-contrast scans. But further investigation is needed, with a larger cohort of patients. Avoiding contrast-agent could mean an improvement for brain tumor patients who need to undergo repeated MRI acquisitions.
Classification of voxels could probably be improved with more advanced techniques.
Conclusions
We showed clear differences in quantitative values for the tumoral and healthy tissue. In glioma the pre-contrast, normT1T2 is predictive for the post-contrast enhancing tumor. This work encourages further exploration of quantitative imaging in gliomas with the possibility of reducing scan-time and avoiding contrast-agent administration.Acknowledgements
This research was funded by General Electric Healthcare, grant number B-GEHC-5 GE for the project “MR Physiological Signature” and “The APC was funded by Erasmus Medical Center”. Part of the study was funded by HollandPTC-Varian consortium-confined call 2018, grant number 2018013, for the project "Improving toxicity modelling, patient selection and clinical outcome of proton therapy in low grade glioma“.References
1. Ellingson BM, Bendszus M, Boxerman J, et al. Consensus recommendations for a standardized Brain Tumor Imaging Protocol in clinical trials. Neuro-Oncology. Published online August 6, 2015. doi:10.1093/neuonc/nov095
2. Weller M, van den Bent M, Preusser M, et al. EANO guidelines on the diagnosis and treatment of diffuse gli-omas of adulthood. Nat Rev Clin Oncol. 2021;18(3):170-186. doi:10.1
3. Deoni SCL. Quantitative Relaxometry of the Brain: Topics in Magnetic Resonance Imaging. 2010;21(2):101-113. doi:10.1097/RMR.0b013e31821e56d8
4. Gómez PA, Cencini M, Golbabaee M, et al. Rapid three-dimensional multiparametric MRI with quantitative transient-state imaging. arXiv:200107173 [physics]. Published online June 27, 2020. Accessed July 7, 2020. http://arxiv.org/abs/2001.07173
5. Warntjes JBM, Leinhard OD, West J, Lundberg P. Rapid magnetic resonance quantification on the brain: Opti-mization for clinical usage. Magnetic Resonance in Medicine. 2008;60(2):320-329. doi:10.1002/mrm.21635
6. Hattingen E, Müller A, Jurcoane A, et al. Value of quantitative magnetic resonance imaging T1-relaxometry in predicting contrast-enhancement in glioblastoma patients. Oncotarget. 2017;8(32):53542-53551. doi:10.18632/oncotarget.18612
7. Kleesiek J, Morshuis JN, Isensee F, et al. Can Virtual Contrast Enhancement in Brain MRI Replace Gadolinium?: A Feasibility Study. Investigative Radiology. 2019;54(10):653-660. doi:10.1097/RLI.0000000000000583
8. Laule C, Bjarnason TA, Vavasour IM, et al. Characterization of brain tumours with spin–spin relaxation: pilot case study reveals unique T 2 distribution profiles of glioblastoma, oligodendroglioma and meningioma. Journal of Neurology. 2017;264(11):2205-2214. doi:10.1007/s00415-017-8609-6
9. Pirkl CM, Nunez-Gonzalez L, Kofler F, et al. Accelerated 3D whole-brain T1, T2, and proton density mapping: feasibility for clinical glioma MR imaging. Neuroradiology. Published online April 9, 2021. doi:10.1007/s00234-021-02703-0
10. Kickingereder P, Isensee F, Tursunova I, et al. Automated quantitative tumour response assessment of MRI in neuro-oncology with artificial neural networks: a multicentre, retrospective study. The Lancet Oncology. 2019;20(5):728-740. doi:10.1016/S1470-2045(19)30098-1
11. Isensee F, Jäger PF, Kohl SAA, Petersen J, Maier-Hein KH. Automated Design of Deep Learning Methods for Biomedical Image Segmentation. arXiv:190408128 [cs]. Published online April 2, 2020. Accessed December 3, 2020. http://arxiv.org/abs/1904.08128
12. Streiner DL, Cairney J. What’s under the ROC? An Introduction to Receiver Operating Characteristics Curves. Can J Psychiatry. 2007;52(2):121-128. doi:10.1177/070674370705200210
13. Youden WJ. Index for rating diagnostic tests. :5.
14. Airola A, Pahikkala T, Waegeman W, De Baets B, Salakoski T. An experimental comparison of cross-validation techniques for estimating the area under the ROC curve. Computational Statistics & Data Analysis. 2011;55(4):1828-1844. doi:10.1016/j.csda.2010.11.018
15. Blystad I, Håkansson I, Tisell A, et al. Quantitative MRI for Analysis of Active Multiple Sclerosis Lesions with-out Gadolinium-Based Contrast Agent. American Journal of Neuroradiology. 2016;37(1):94-100. doi:10.3174/ajnr.A4501
16. Blystad I, Warntjes JBM, Smedby Ö, Lundberg P, Larsson EM, Tisell A. Quantitative MRI using relaxometry in malignant gliomas detects contrast enhancement in peritumoral oedema. Scientific Reports. 2020;10(1). doi:10.1038/s41598-020-75105-6 038/s41571-020-00447-z
Figures