2697
Analysis on Echo Placement for Multi-echo Proton Resonance Frequency Shift Thermometry1Mechanical Engineering, Control Systems Technology, Technical University Eindhoven, Eindhoven, Netherlands, 2Radiotherapy, Erasmus MC, Rotterdam, Netherlands, 3Electrical Engineering, Electromagnetics for Care & Cure, Technical University Eindhoven, Eindhoven, Netherlands
Synopsis
Proton resonance frequency shift based MR thermometry is widely used to non-invasively monitor thermal therapies in vivo. Multi-echo gradient-echo sequences are being studied to increase the effective temperature to noise ratio, however, choosing the optimal echo-times is non-trivial. We developed an optimization framework based on measurement noise models to compute the optimal echo placement for schemes that either correct or do not correct for the conductivity bias. In a 4-echo phantom experiment, we demonstrated a reduction in the noise standard deviation of 22% when comparing optimal to equidistant echo placements.
Introduction
Magnetic Resonance Thermometry (MRT) is widely used to non-invasively monitor thermal therapies. In particular, MRT methods based on the proton resonance frequency shift (PRFS) are most commonly applied in vivo. For a single-echo gradient-echo sequence, the echo-time that corresponds to the maximal Temperature to Noise Ratio (TNR) of PRFS MRT is well known1, and has an analytic solution: $$$\mathrm{TE}=T_2^\star$$$. However, there is a perpetual need for increasing the TNR to either improve measurement quality or increase imaging speed to be able to correct for motion. To this end, multi-echo MRI sequences are being studied to increase the effective TNR by combining multiple measurements2. While optimal echo fusing schemes are already proposed, they do not cover the practical consideration of choosing the echo times2. Additionally, such schemes often neglect the conductivity bias, which can lead to systematic errors up to $$$28\%$$$ in cow liver3. Here, we present an optimal echo-time derivation framework that maximizes the TNR based on the single-echo PRFS noise model1. The presented framework is applied to both schemes that correct for the conductivity bias and do not correct for the conductivity bias.Method
A multi-echo PRFS-based temperature measurement is constructed from single-echoes using,$$T_\text{PRFS}:=\sum_{k=1}^{n}w_k\frac{\Delta \varphi_k}{\alpha\gamma\text{}B_0\mathrm{TE}_k}.\tag{1}\label{eq:1}$$Here, $$$w_k,~\Delta\varphi_k,~\mathrm{TE}_k$$$, and $$$n$$$ denote the $$$k$$$-th weight, the phase shift from the $$$k$$$-th echo, the $$$k$$$-th echo-time, and the number of echoes, respectively. Additionally, $$$\alpha,~\gamma,~B_0$$$ are defined as in1. The weights $$$w_k$$$ depend on the echo-time $$$\mathrm{TE}_k$$$ and can be computed to either correct or not correct for the conductivity bias when $$$n\geq2$$$. For the case where the conductivity bias is not corrected, the weights that maximize the TNR, $$$w_k^{\text{not-corrected}}$$$, and resulting TNR, $$$\mathrm{TNR}^{\text{not-corrected}}$$$, are given by $$\begin{bmatrix}w_1^{\text{not-corrected}}&\dots&w_n^{\text{not-corrected}}\end{bmatrix}:=\frac{1}{\text{trace}(P)}\begin{bmatrix}P_{1,1}&\dots&P_{n,n}\end{bmatrix},\\\mathrm{TNR}^{\text{not-corrected}}:=\sqrt{\text{trace}(P)}.\tag{2}\label{eq:2}$$Here, $$$P$$$ denotes a diagonal precision matrix with elements $$$P_{k,k}=\mathrm{TNR}_k^2$$$, where $$$\mathrm{TNR}_k$$$ denotes the TNR from the single-echo PRFS noise model1:$$\mathrm{TNR}_k:=\alpha\gamma\text{}B_0\mathrm{TE}_ke^{\frac{-\mathrm{TE}_k}{T_2^\star}}.\tag{3}\label{eq:3}$$For the case where the conductivity bias is corrected, we enforce that the weights are orthogonal to the bias and sum to one, i.e.,$$\sum_{k=1}^n\frac{w_k}{\mathrm{TE}_k}=0,\quad\sum_{k=1}^n w_k=1\tag{4}\label{eq:4}.$$This yields the following expression for the optimal weights, $$$w_k^{\text{corrected}}$$$, and corresponding TNR, $$$\mathrm{TNR}^{\text{corrected}}$$$,$$\begin{bmatrix}w_1^{\text{corrected}}&\dots&w_n^{\text{corrected}}\end{bmatrix}:=\begin{bmatrix}1&0\end{bmatrix}(C^\top{PC})^{-1}C^\top{P},\\\mathrm{TNR}^{\text{corrected}}:=\left(\begin{bmatrix}1&0\end{bmatrix}(C^\top{PC})^{-1}\begin{bmatrix}1\\0\end{bmatrix}\right)^{-\frac{1}{2}},\tag{5}\label{eq:5}$$where$$C:=\begin{bmatrix}1&\dots&1\\\frac{1}{\mathrm{TE}_1}&\dots&\frac{1}{\mathrm{TE}_n}\end{bmatrix}^\top.\tag{6}\label{eq:6}$$Using the echo-time dependent TNR expressions \eqref{eq:2} and \eqref{eq:5}, we optimize the echo placement using\begin{align}\tag{7}\label{7}\underset{[\mathrm{TE}_1,\dots,\mathrm{TE}_n]}{\text{maximize}}\quad &\mathrm{TNR}^{\text{(not-)corrected}},\\ \text{subject}~\text{to}\quad&\mathrm{TE}_{k+1}\geq \mathrm{TE}_{k}+\Delta \mathrm{TE},\quad \text{for } k=1,2,\dots,n-1,\\&\mathrm{TE}_1\geq\Delta \mathrm{TE},\\&\mathrm{TE}_n\leq \mathrm{TE}_\text{max}.\end{align}Here, $$$\Delta \mathrm{TE}$$$ and $$$\mathrm{TE}_\text{max}$$$ denote the minimum echo-time spacing and maximum echo-time, respectively. We solve \eqref{7} using a particle-swarm optimization4 due to the non-convexity and small dimension of the problem. Last, the framework is experimentally verified with a 4-echo gradient-echo sequence using a phantom filled with Perfax without heating applied on a GE 1.5T MRI scanner. The echo-times are optimized using \eqref{7} for a conductivity bias corrected reconstruction with: $$$T_2^\star\approx{90}\text{ms},~\Delta\mathrm{TE}=2.3\text{ms}$$$, and $$$\mathrm{TE}_{\text{max}}=21.9\text{ms}$$$. The optimal echo placement is compared to an equidistant echo placement. The performance of both sequences is quantified by the standard deviation of the difference between two subsequent scans.
Results
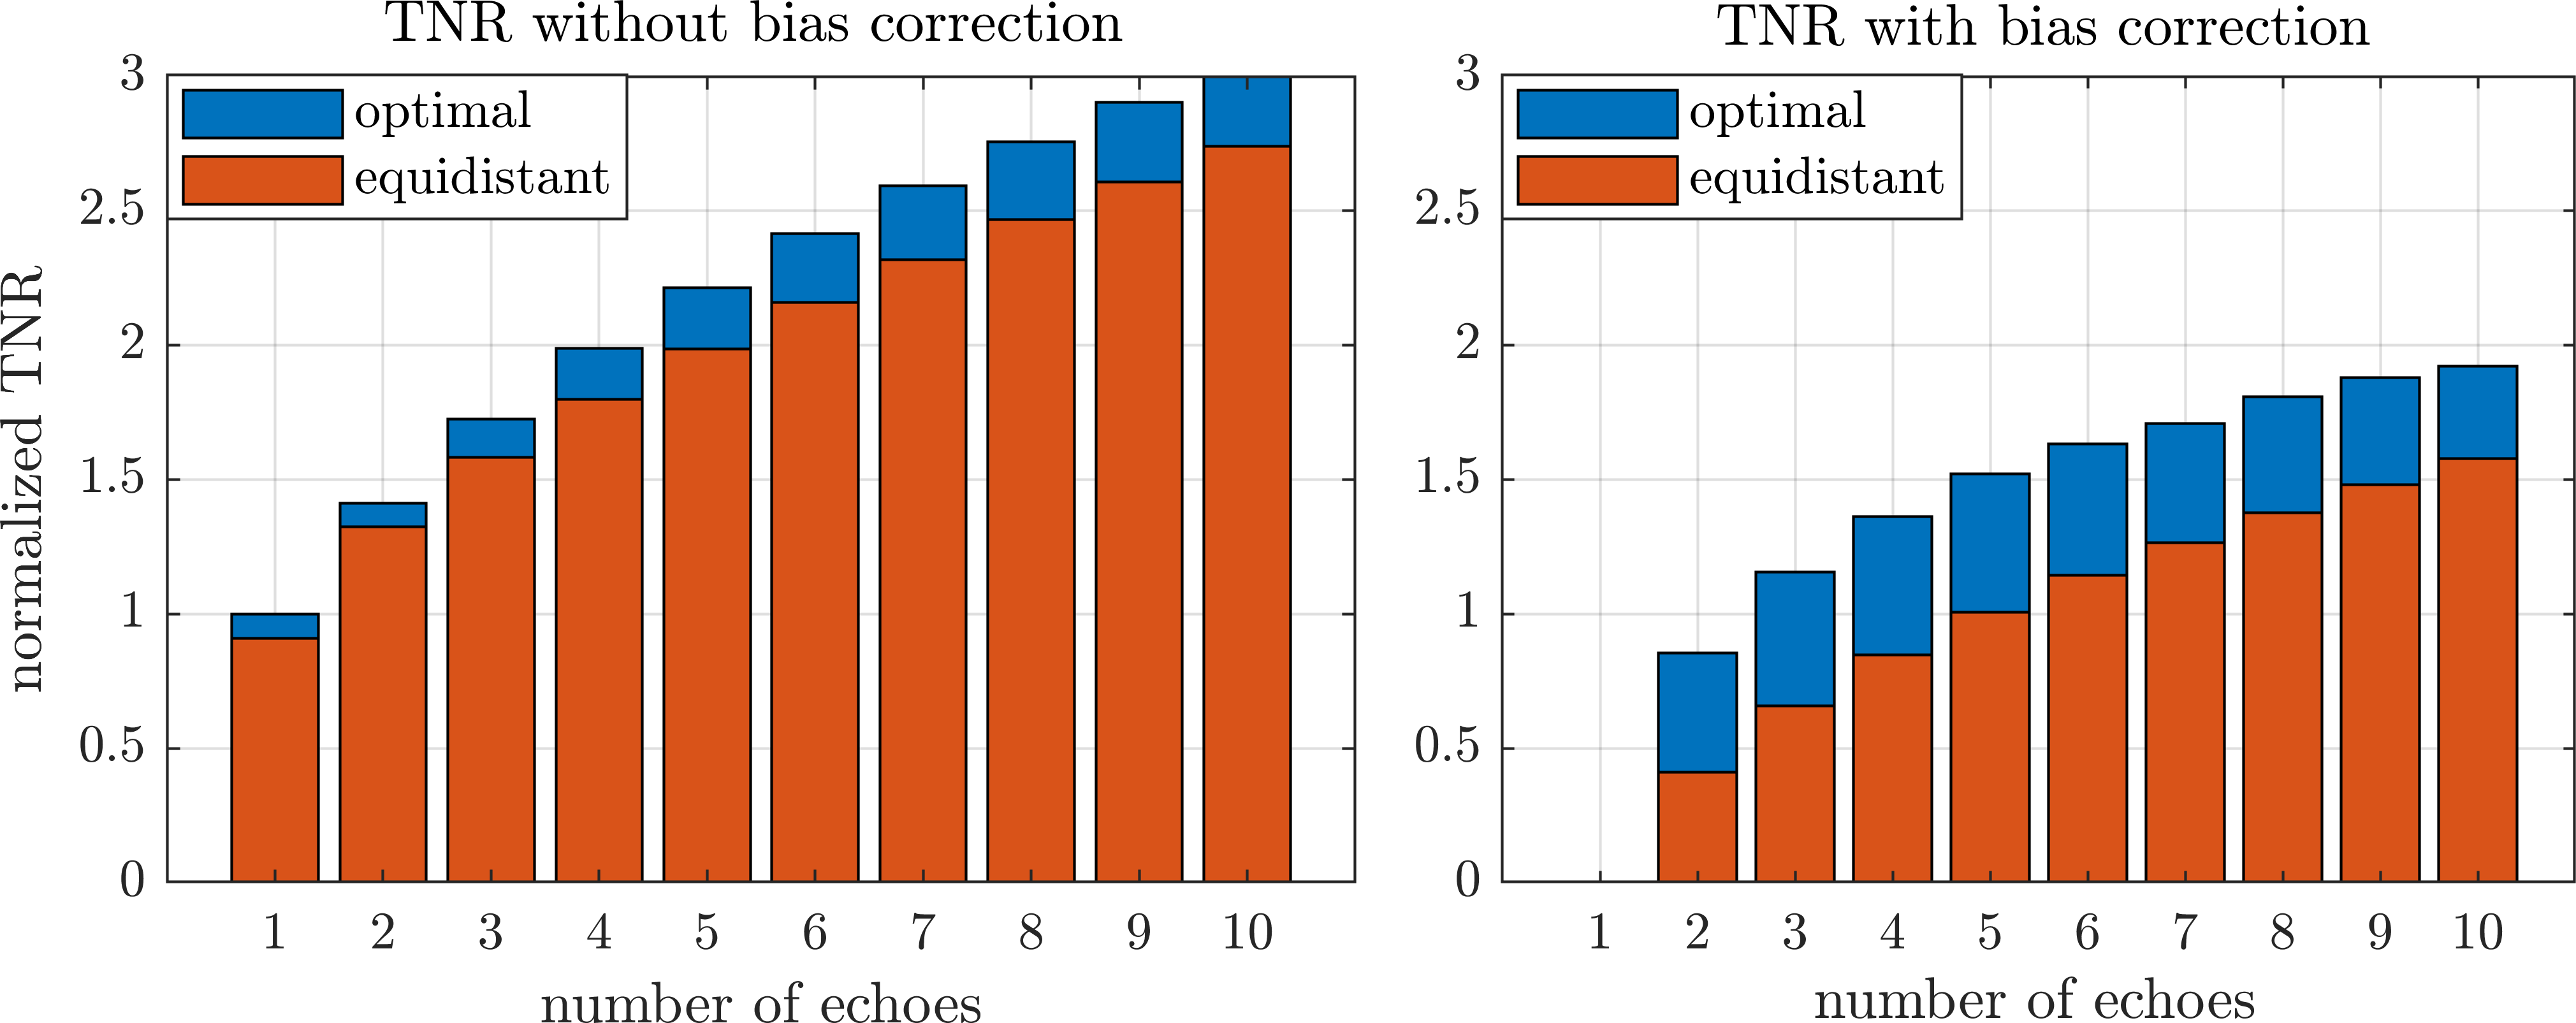
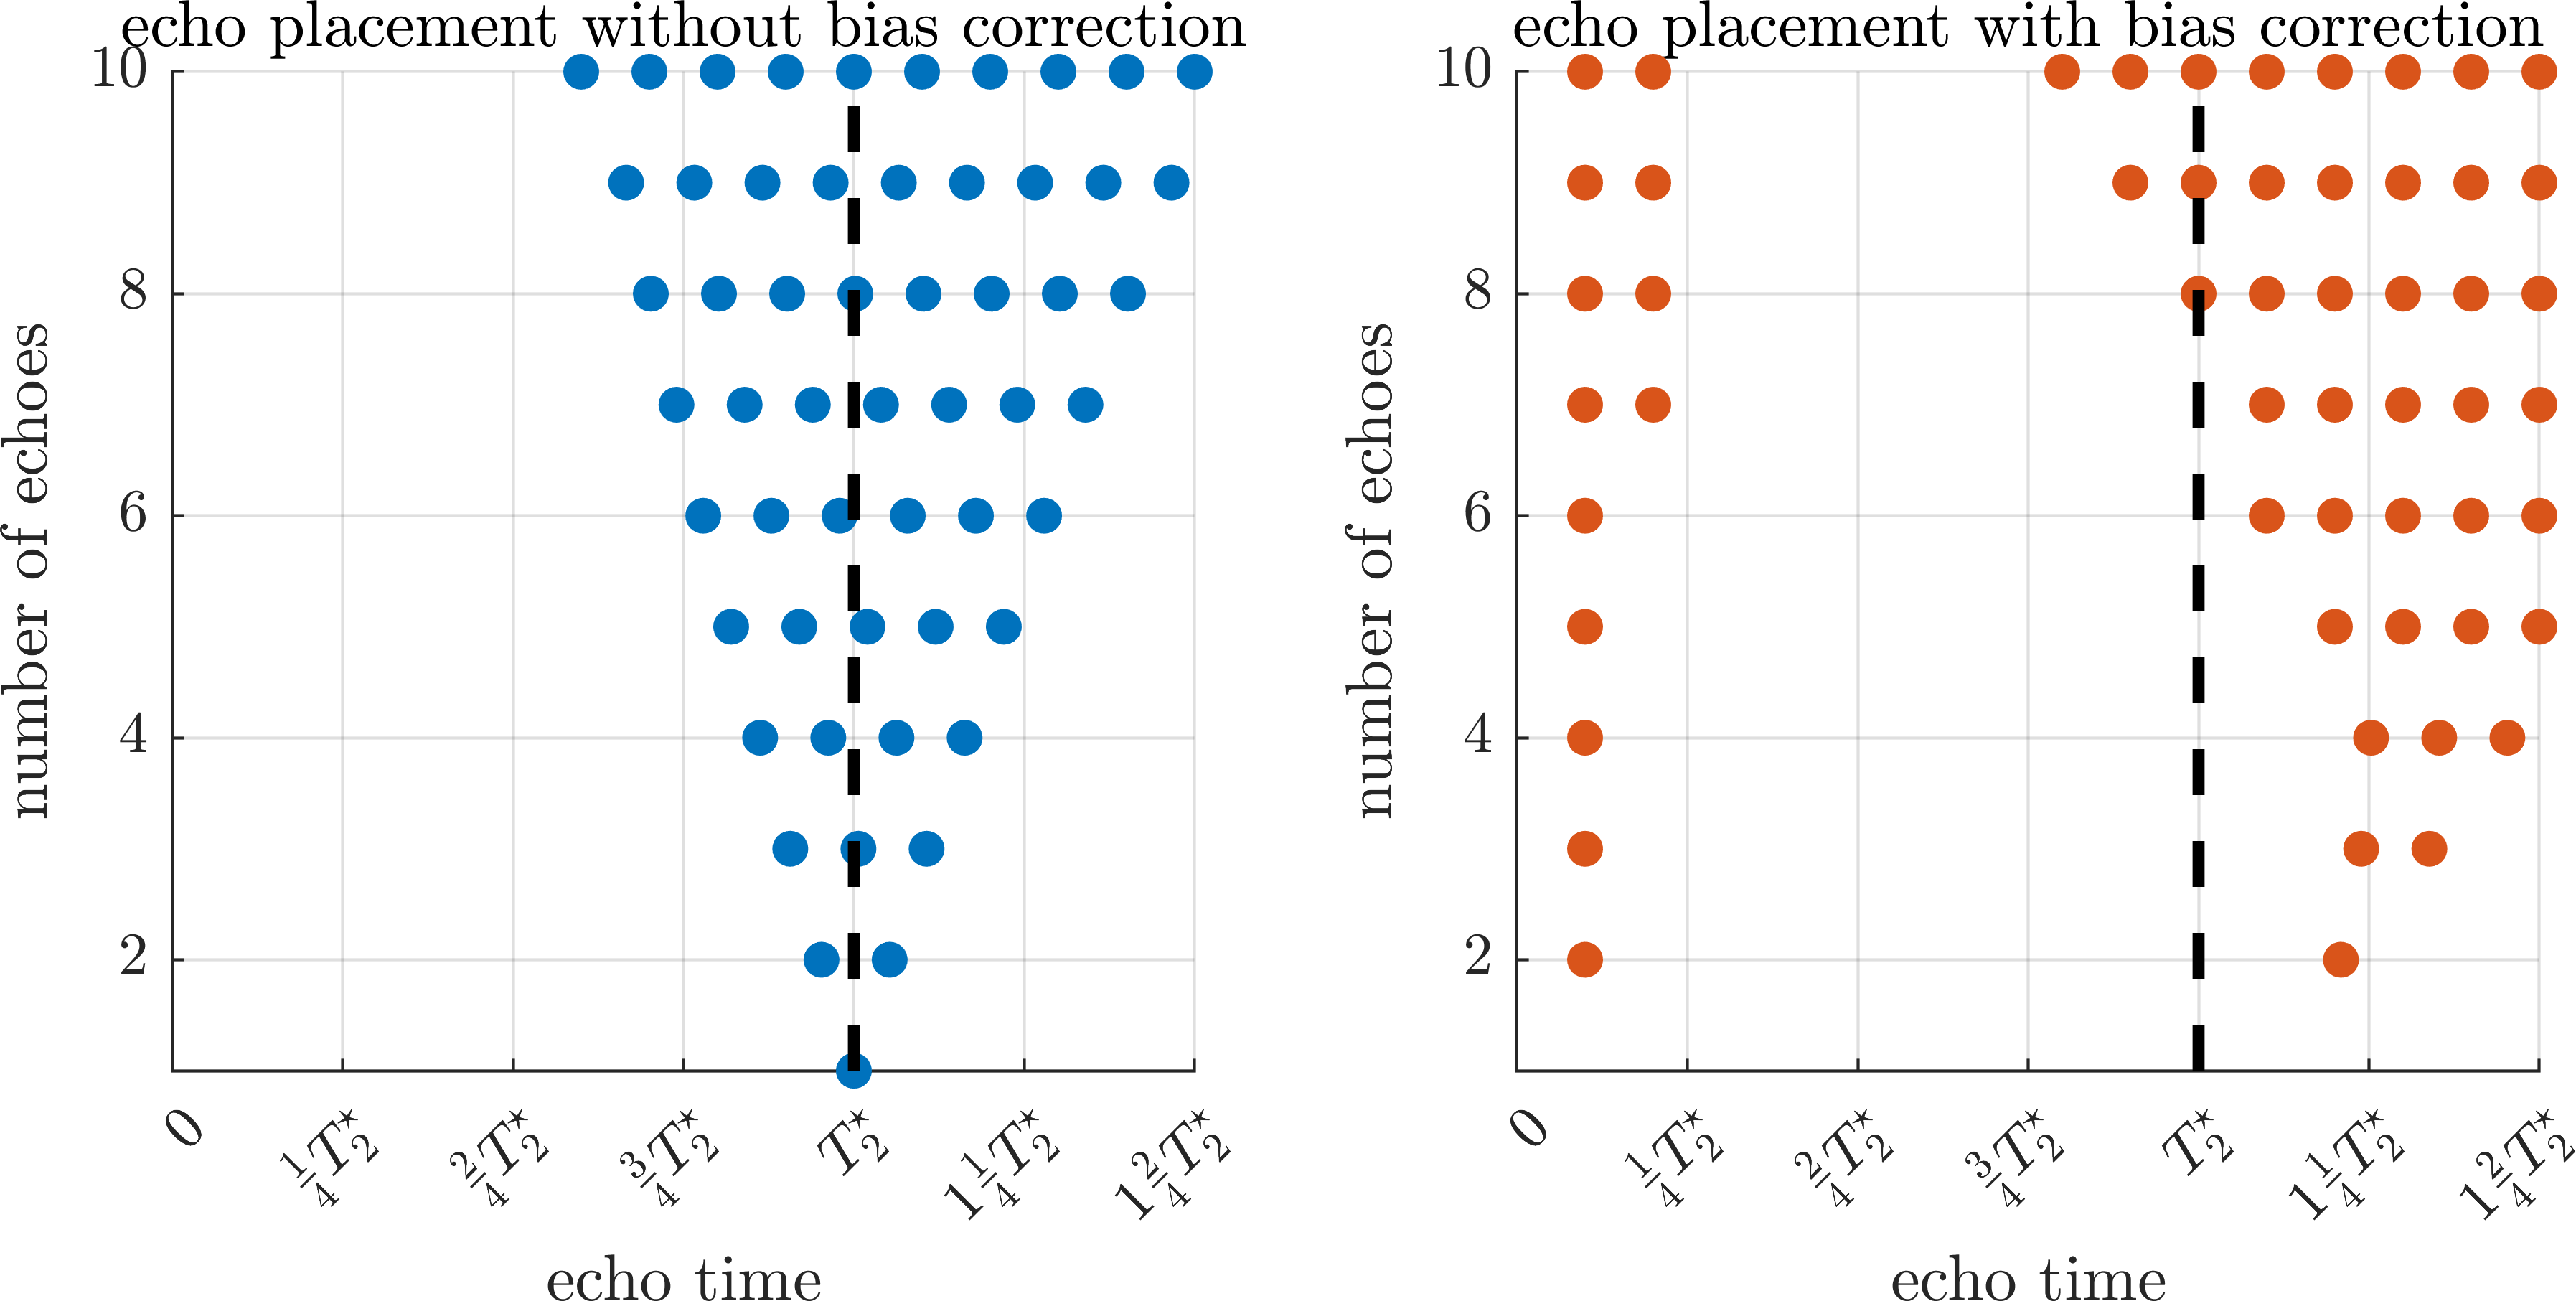
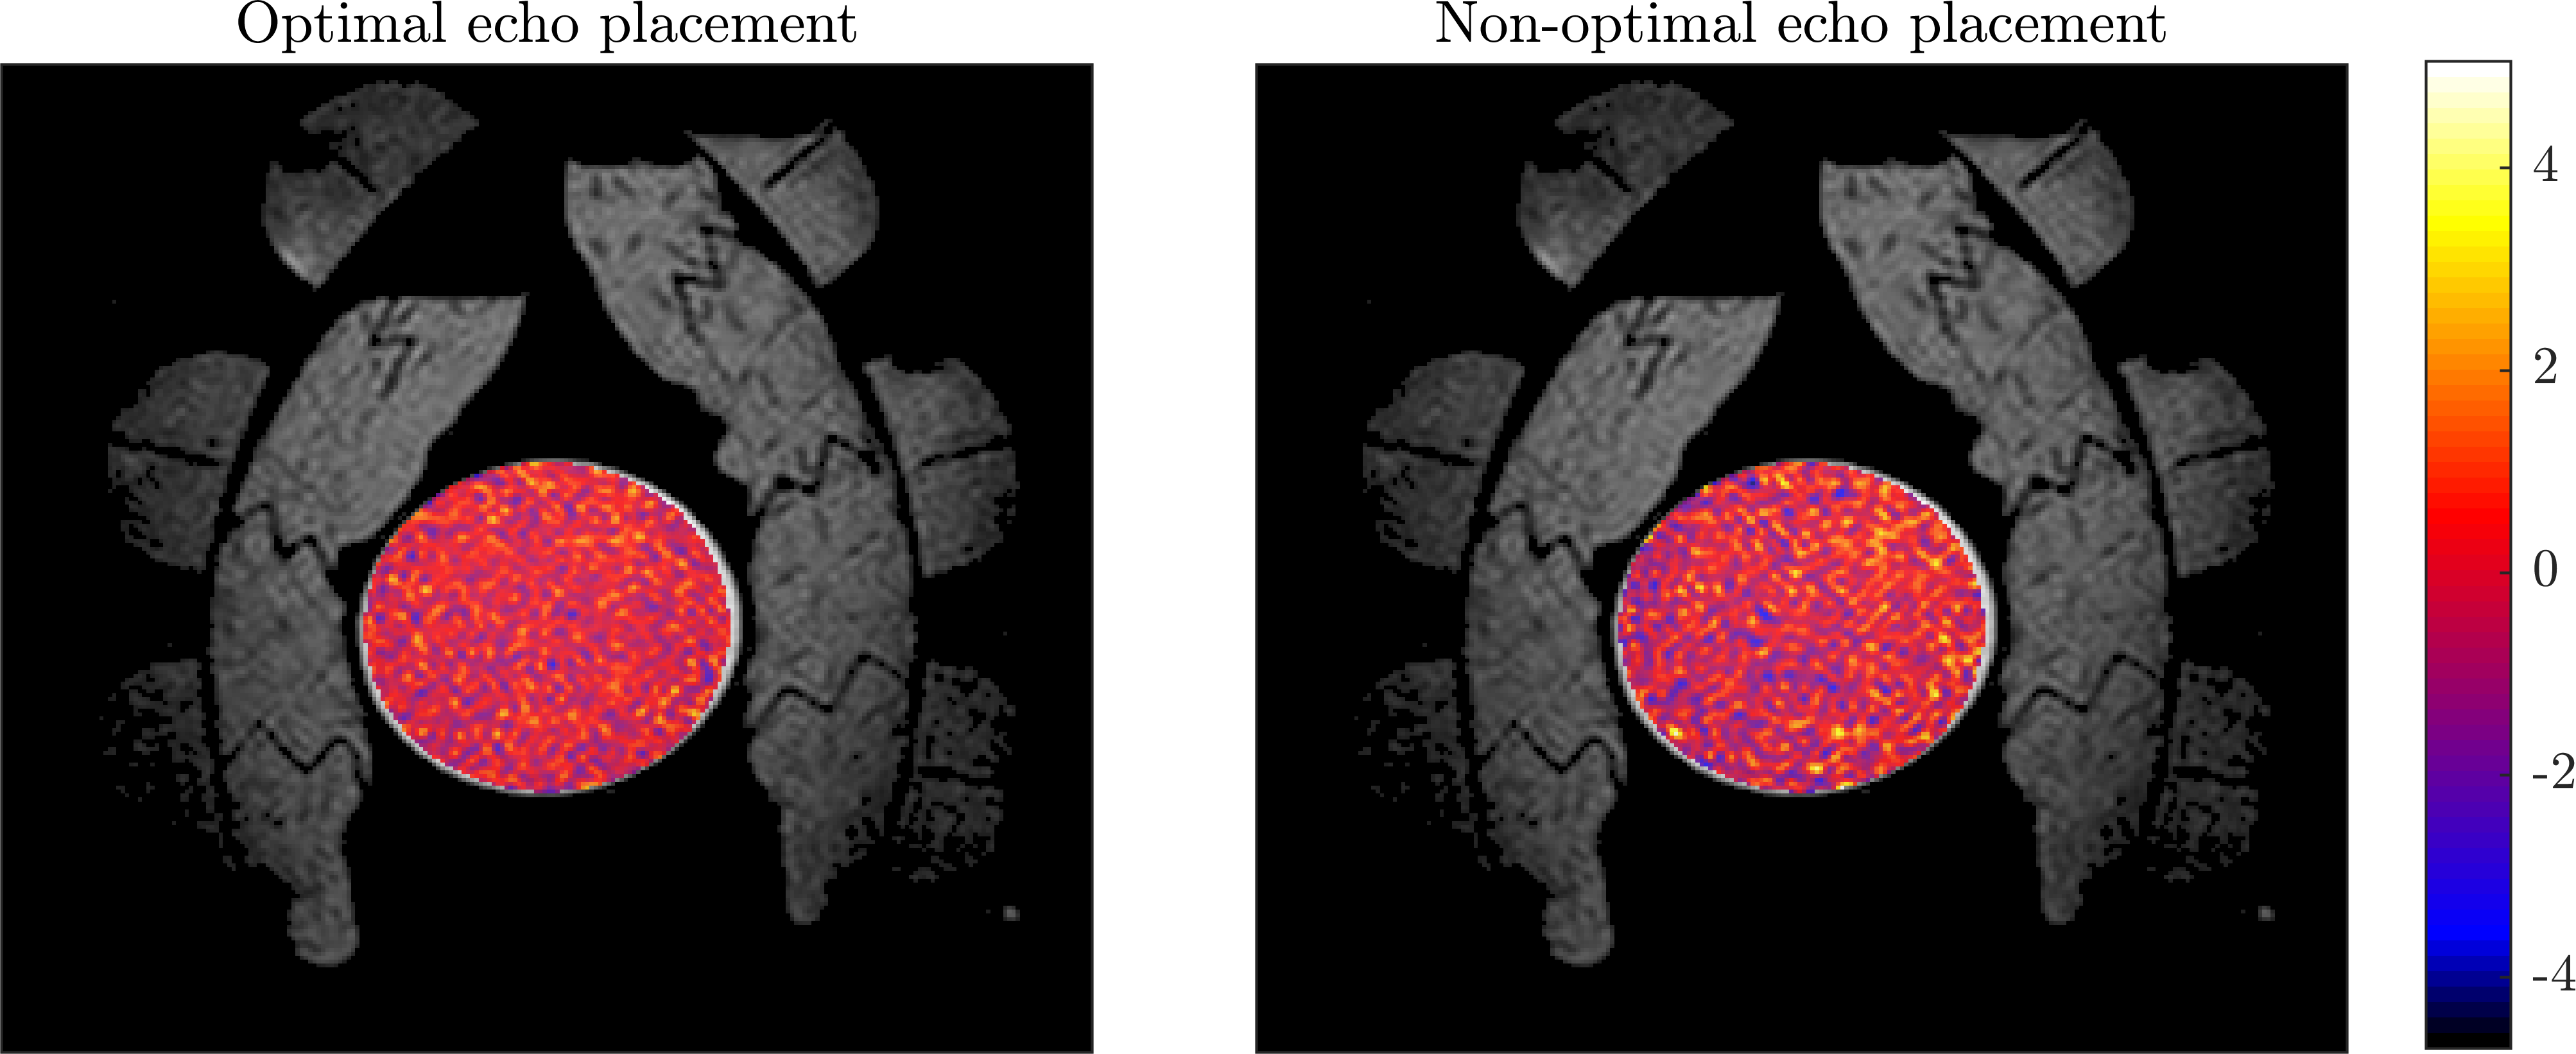
In Figure$$$~$$$1, the optimal TNR for both the not-corrected and corrected multi-echo reconstructions are compared to an equidistant echo-time distribution. As expected, the optimal placement strategy outperforms the equidistant spacing for both the not-corrected and corrected reconstructions. Additionally, note that in general the TNR with conductivity bias correction is lower as some echoes are used to remove the conductivity bias instead of increasing the TNR. Nevertheless, for both not-corrected and corrected reconstructions, multi-echo MRT with optimal echo placement can increase the TNR significantly with respect to an equidistant echo-time distribution. In Figure$$$~$$$2, the optimal echo placement corresponding to the results from Figure$$$~$$$1 are shown relative to $$$T_2^\star$$$. For the not-corrected reconstruction, the optimal echo placement is centered around $$$T_2^\star$$$, which is expected based on the single echo TNR model \eqref{eq:3}. For the corrected reconstruction, the echo placement is less straightforward. Here, we observe an early echo ($$$\mathrm{TE}_1\approx0.1T_2^\star$$$) followed by subsequent echoes located predominately after $$$T_2^\star$$$. We explain this by the notion that echoes at the start are dominated by the conductivity bias, while later echoes have accumulated more temperature sensitivity. In Figure$$$~$$$3, the temperature noise in the phantom for both optimal and non-optimal echo placements are shown. As expected, the optimal echo placement resulted in a lower standard deviation of the noise compared to the non-optimal placement, $$$0.84^\circ\text{C}$$$ and $$$1.10^\circ\text{C}$$$, respectively.Conclusion
In this work, we observed that when not correcting for the conductivity bias, it is optimal to place echoes centered on $$$T_2^\star$$$, which aligns well with the intuitive understanding of the problem. When conductivity bias is corrected, it is clear that one or more echoes must be placed at the start of the sequence and the remainder preferably later than $$$T_2^\star$$$. The experimental validation using a 4-echo MRT experiment with optimal and non-optimal echo placement verified our findings showing a $$$22\%$$$ reduction in noise standard deviation.Finally, two remarks are in order. First, the presented framework assumes a fixed receiver bandwidth. Loosely speaking, the receiver bandwidth is correlated to the echo spacing and, hence, to TNR for each echo. Second, note that the PRFS noise model does not contain the Signal to Noise Ratio (SNR) of the MRI scanner as our framework is independent on this parameter. In other words, the results presented in this work are SNR independent, assuming the MR signal is sufficient large such that the phase noise is Gaussian distributed.
Acknowledgements
This research is supported by KWF Kankerbestrijding and NWO Domain AES, as part of their joint strategic research programme: Technology for Oncology II. The collaboration project is co-funded by the PPP Allowance made available by Health$$$\sim$$$Holland, Top Sector Life Sciences & Health, to stimulate public-private partnerships.References
1. Rieke V, Pauly K.B. MR thermometry. J. Magn. Reson. Imaging. 2008;27:376-390.
2. Madore B, Panych L.P, Mei C.S, Yuan J, Chu R. Multipathway sequences for MR thermometry. Magn Reson. Med. 2011;66:658-668.
3. Peters R.D, Henkelman R.M. Proton-resonance frequency shift MR thermometry is affect by changes in the electrical conductivity of tissue. Magn. Reson. Med. 2000;43:62-71.
4. Poli R, Kennedy J, Blackwell T. Particle swarm optimization. Swarm Intell. 2007;1:33-57.
Figures