2696
Characterising the impact of distortion correction in high-resolution 3D GRE R2* mapping at 7T.1Wellcome Centre for Human Neuroimaging, UCL Queen Square Institute of Neurology, University College London, London, United Kingdom
Synopsis
R2*-mapping delivers quantitative information about tissue microstructure. We investigate the scale of image distortions in high-resolution, bipolar, multi-echo GRE acquisitions at 7T and their effects on R2*-mapping. We study reduction in variance by applying field map-based distortion correction while also considering the confounding effect of local smoothing. We show that for regions with signal displacement > 0.5 voxels the reduction in variance comes largely, not from smoothing, but from the appropriate repositioning of the tissue signal. Therefore, correcting distortions, also in sub-voxel regime, improves data consistency in bipolar GRE acquisitions, facilitating more robust R2*-mapping in high-resolution laminar studies for instance.
Introduction
R2* mapping can be used to probe tissue microstructure and may enable characterisation of cortical laminae (1) at ultra-high-field strengths. However, this requires very high spatial precision, which is compromised by local B0 field inhomogeneities that lead to geometric distortions. Distortions are typically neglected because they are at the sub-voxel level, even at ultra-high-field. However, in time-efficient bipolar acquisitions distortions occur in opposite directions for odd and even echoes, doubling the relative voxel displacement between adjacent echoes. Here we examine the effect of distortion correction (2), using the inherently-available phase of the MRI signal from which a voxel displacement map (VDM) can be derived.Methods
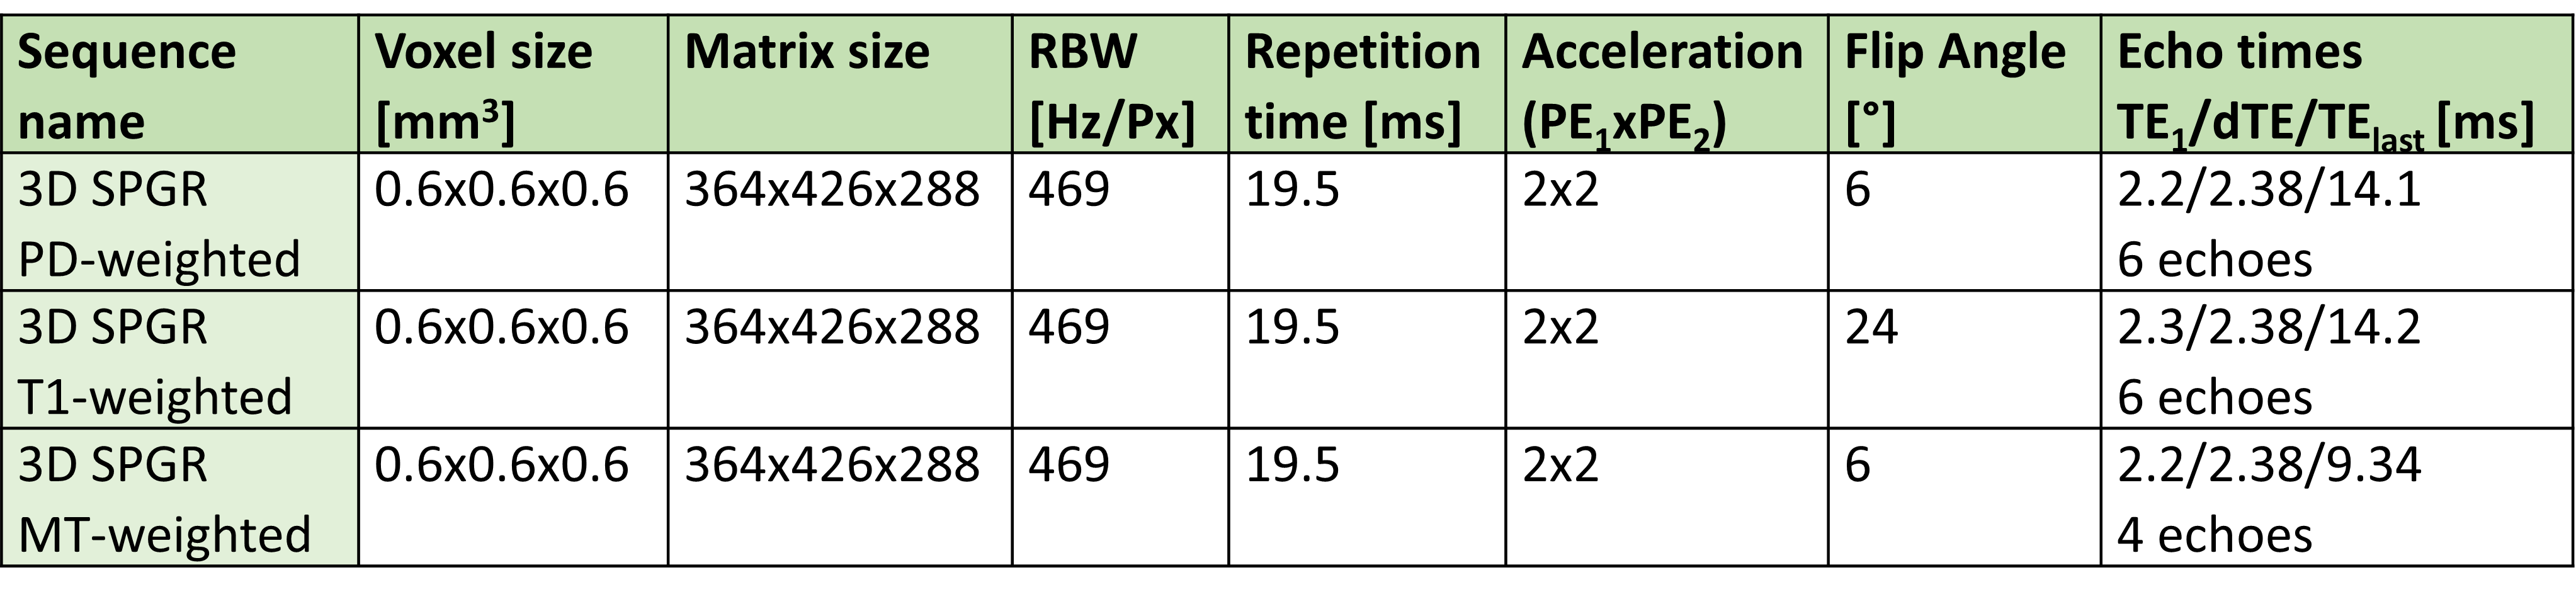
One healthy volunteer was scanned at 7T using an 8Tx/32Rx Nova Medical head coil. Multi-parameter mapping (MPM) data, consisting of three differently weighted spoiled gradient echo (SPGR) acquisitions with bipolar readout and 0.6mm isotropic resolution (see Table1), were acquired twice with the participant exiting the scanner between sessions. VDMs were calculated from odd and even echoes separately using a non-linear fit of the complex signal (3), ROMEO phase unwrapping (4), and division of the unwrapped phase by 2π, echo time and receiver bandwidth per pixel. The VDMs derived were used to undistort the corresponding images using 1-dimentional linear interpolation along the readout direction. To separate the effect of interpolation-induced smoothing from distortion correction, we created a control case in which half the VDM was applied and subsequently reversed such that these “resampled” images were affected by interpolation twice but remained in the original distorted space. maps were obtained using a log-linear fit to the multi-echo magnitude data. Three fits: using odd-only, even-only or all echoes, were performed for the original uncorrected data, the distortion-corrected data, and the resampled control. For each condition, the voxel-wise variance of the R2* maps was calculated across the three fits. This analysis was repeated for each contrast (T1-, PD- and MT-weighted) and session. The variance reduction caused by resampling or distortion correction was calculated relative to the uncorrected case as the difference in variance relative to that of the uncorrected data. The median variance reduction in voxels with mean (from odd and even echoes) absolute displacement |VDM|> 1, 0.5 or 0.3 voxels was calculated per contrast for both resampled and distortion-corrected data.Results
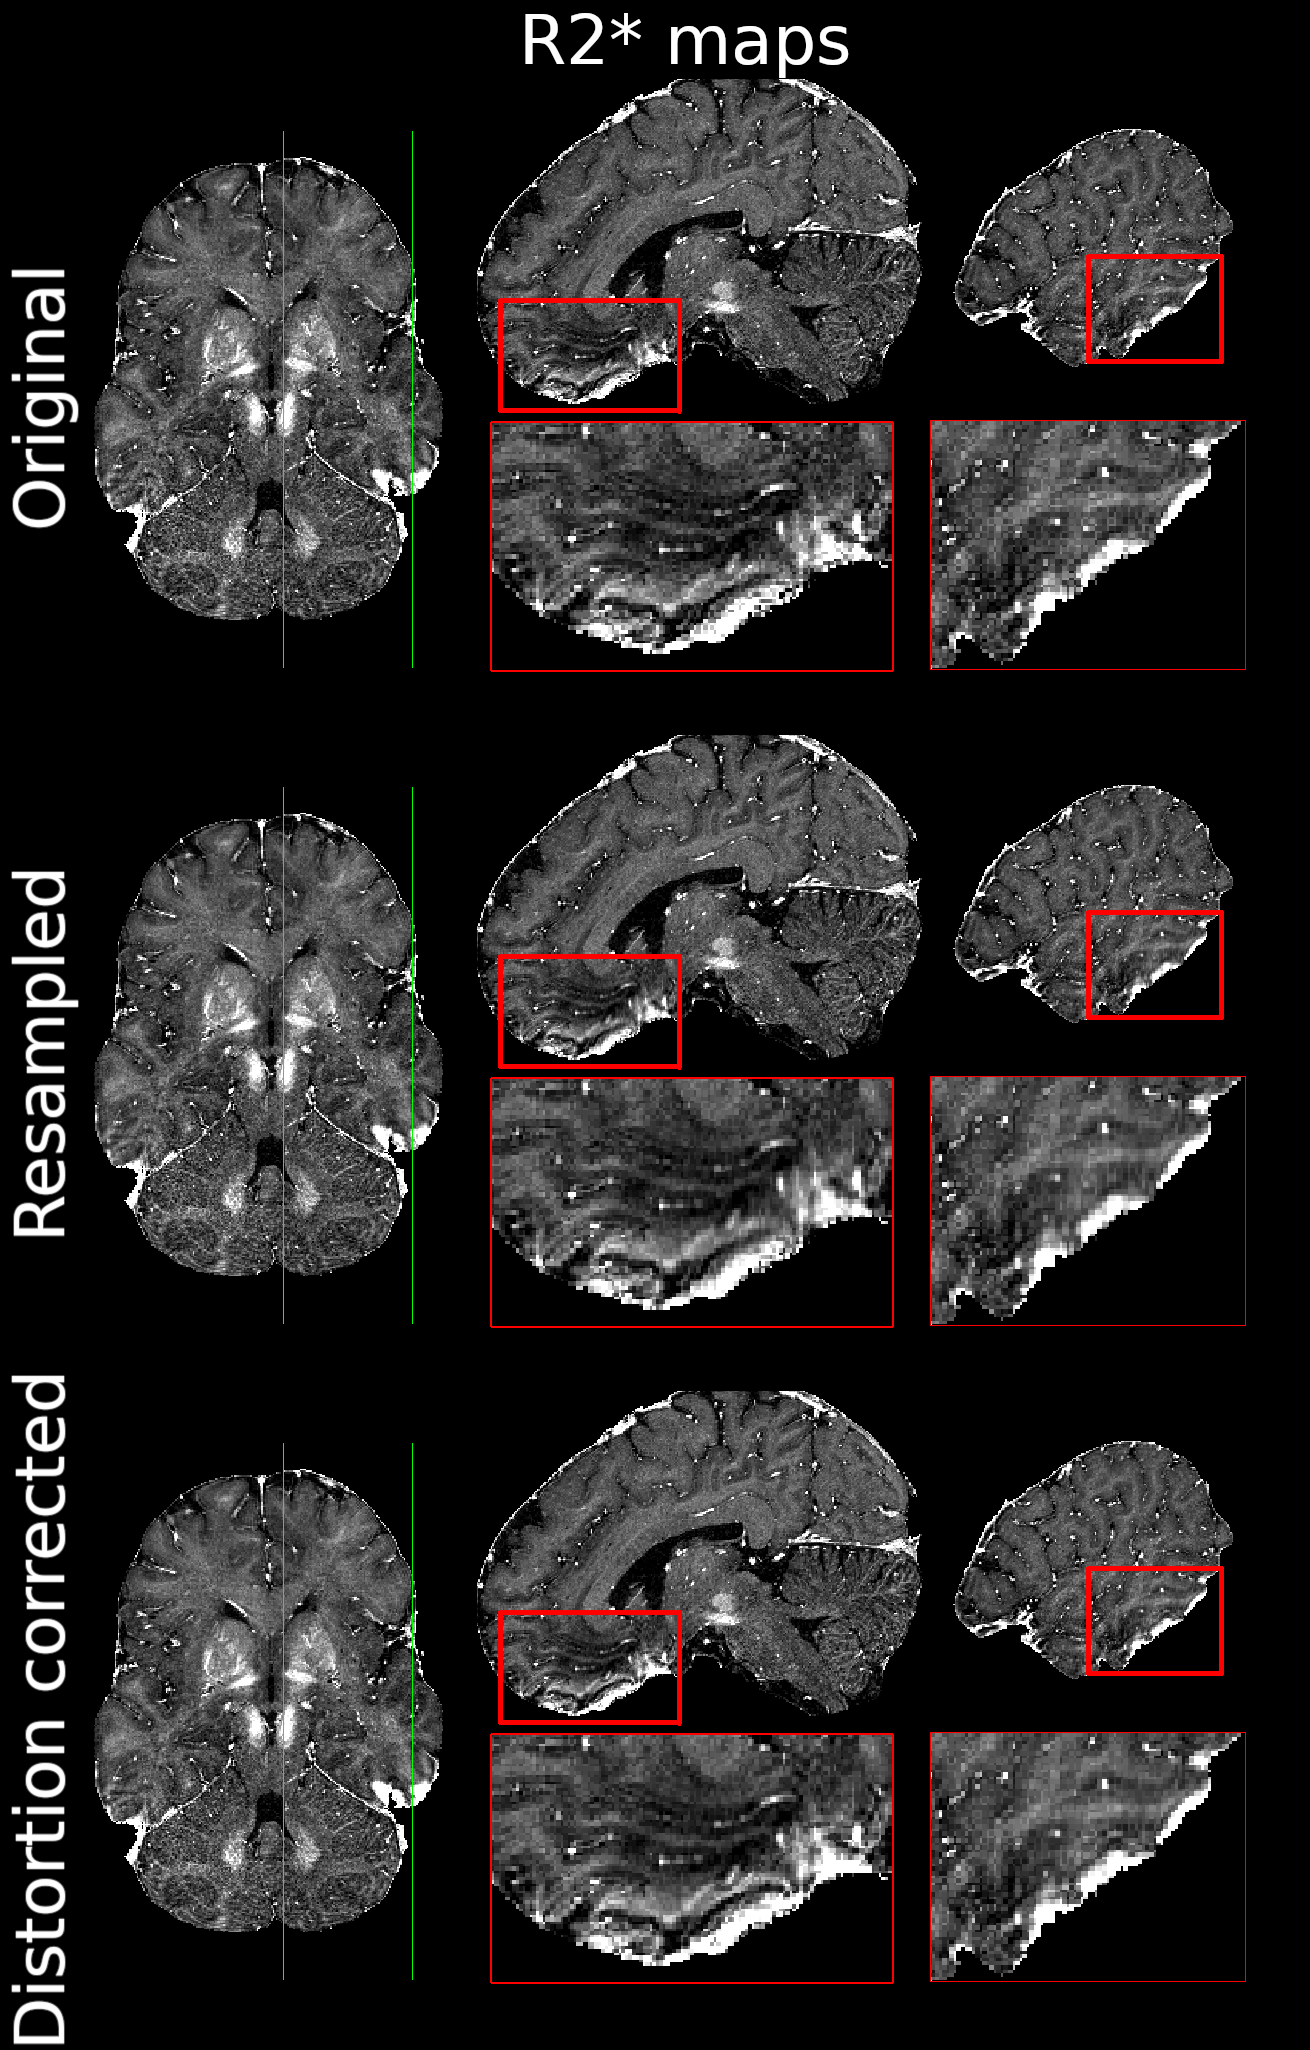
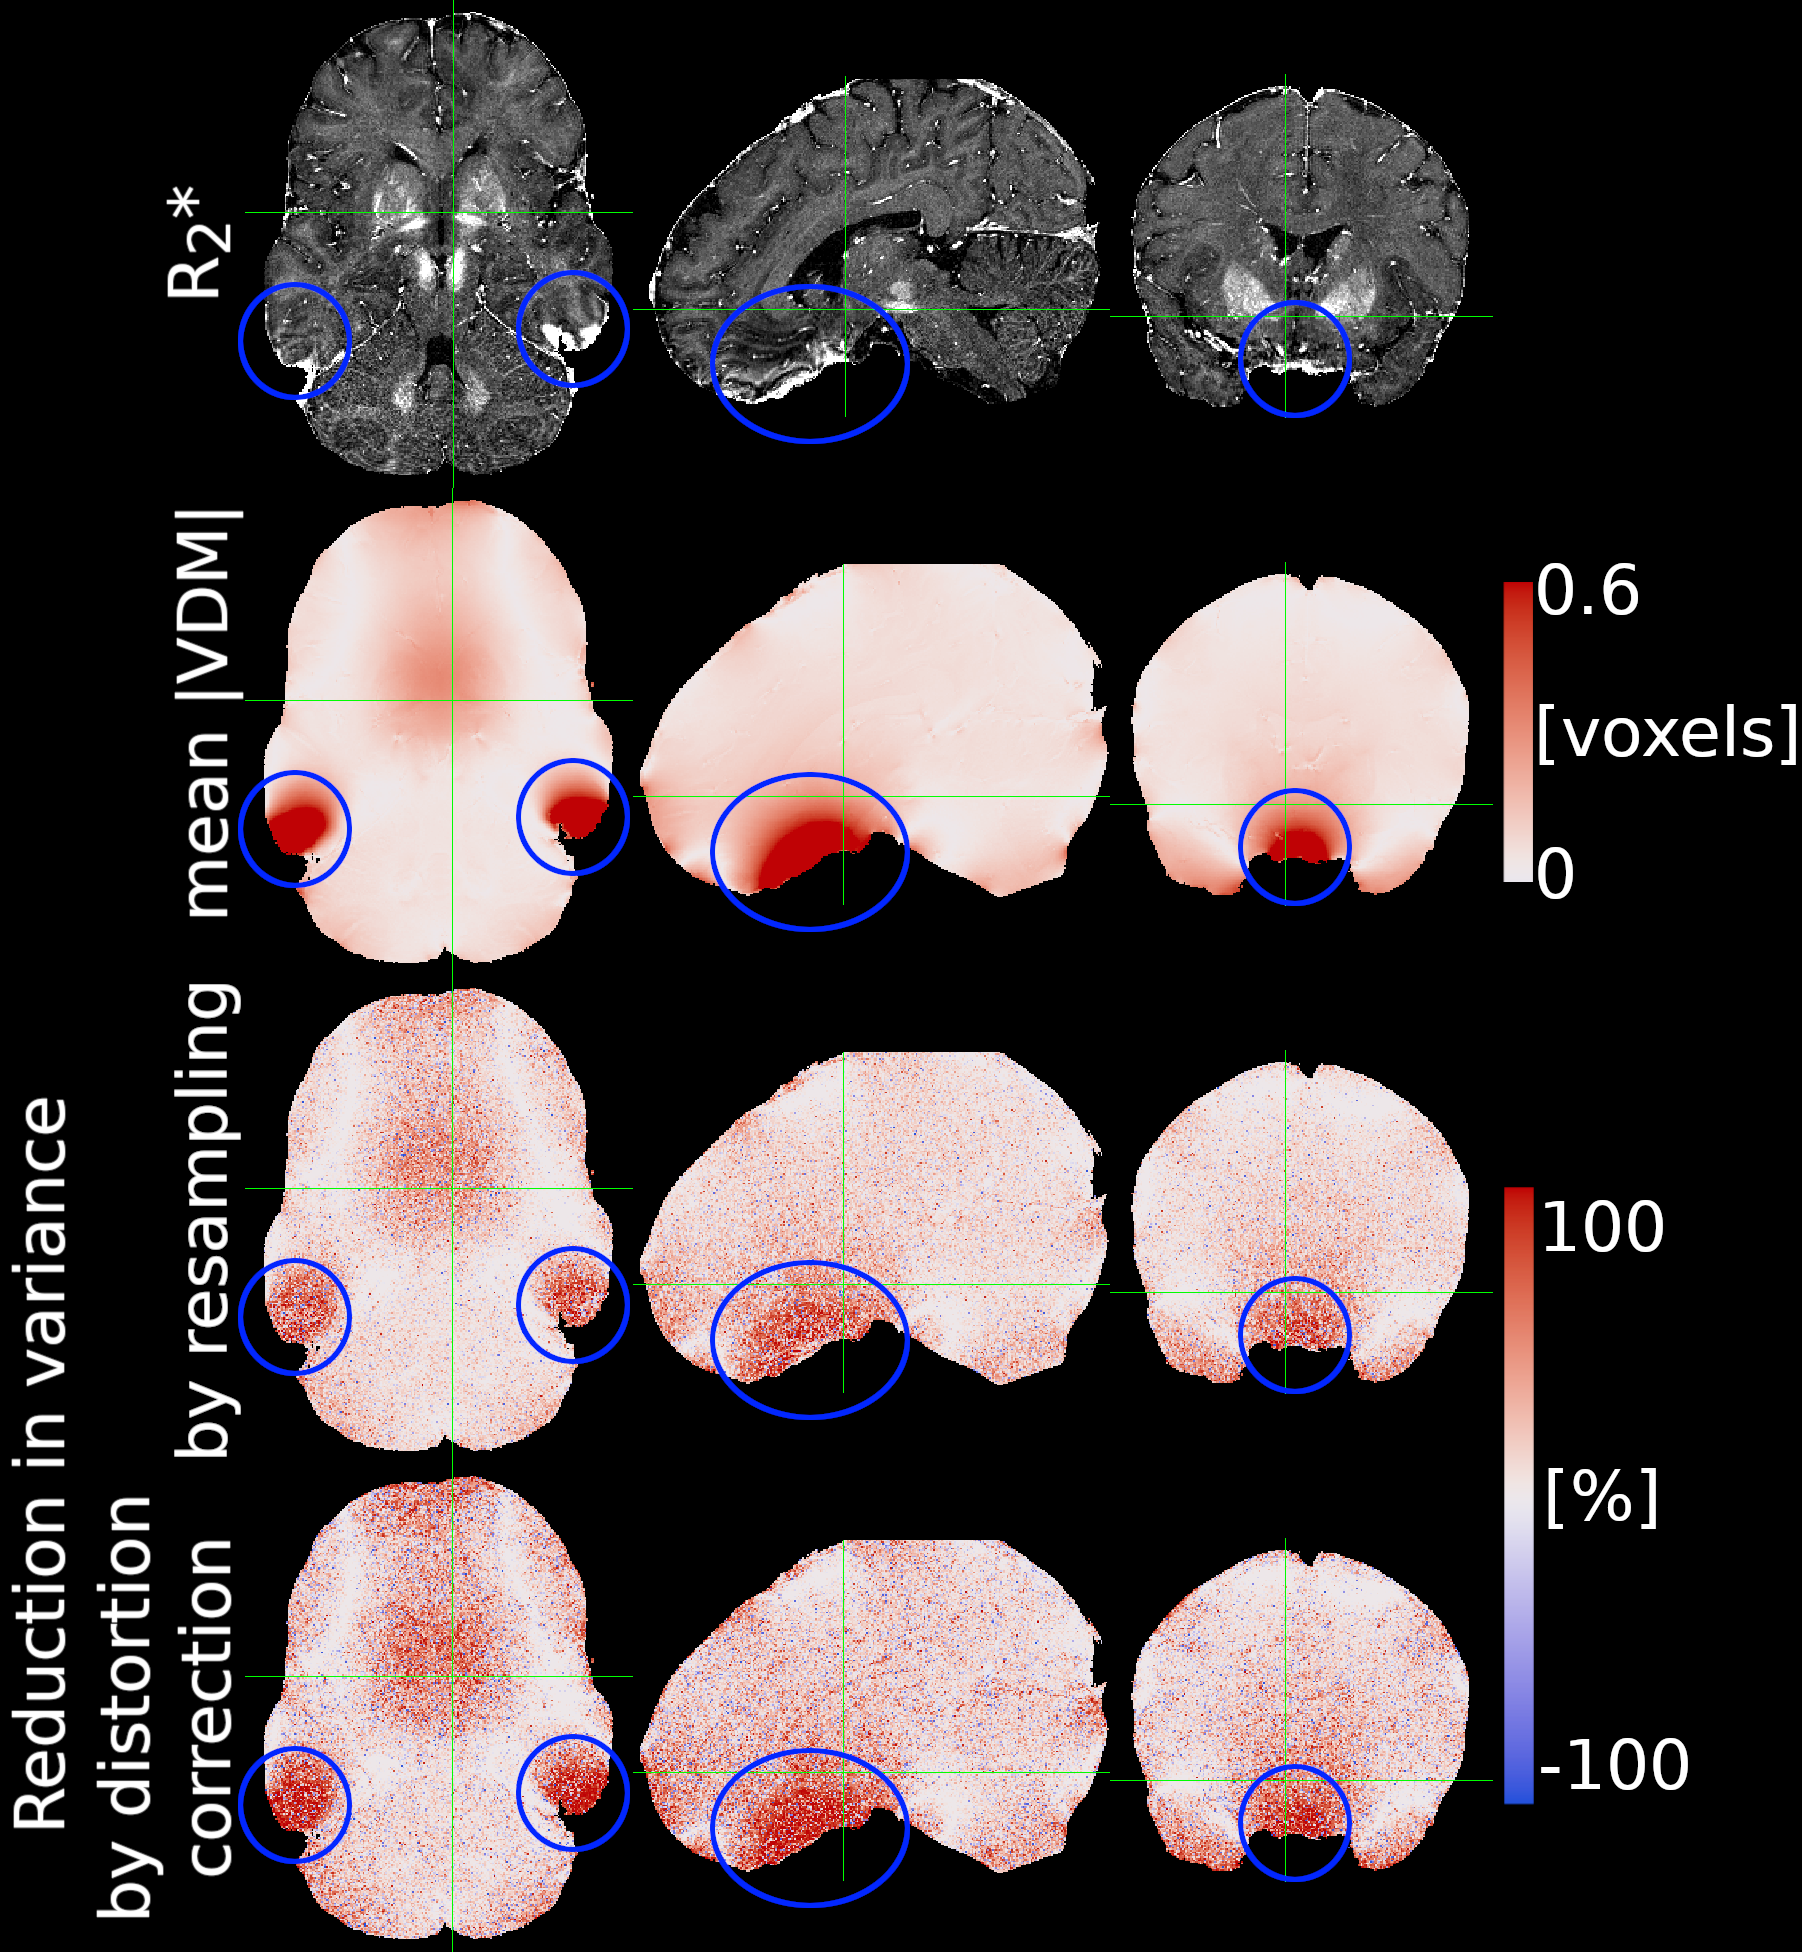
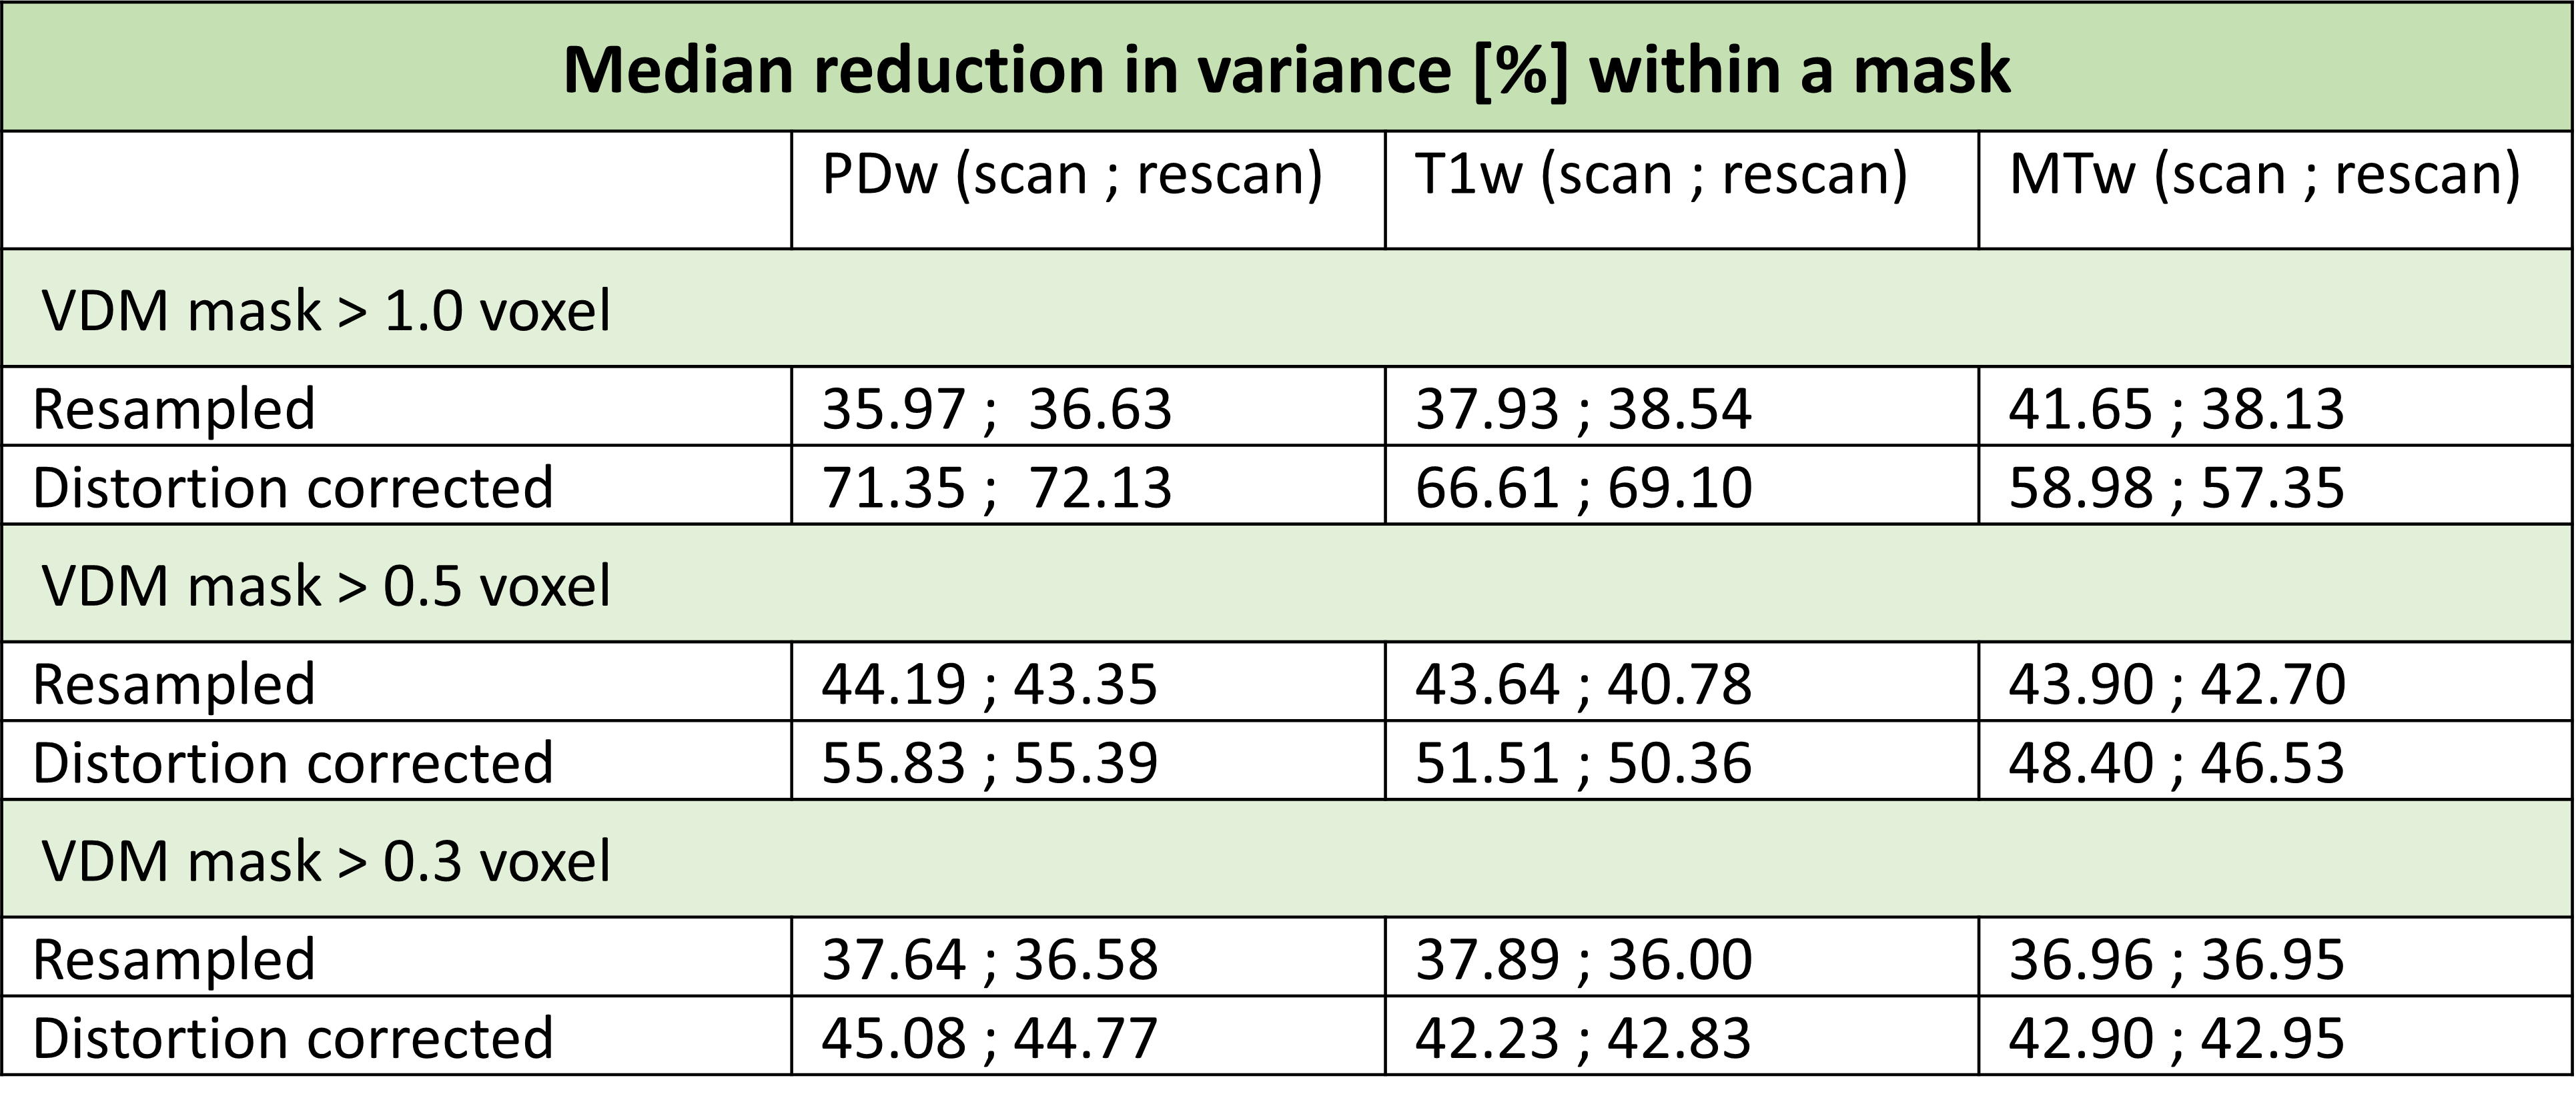
Figure 1 is a gif showing the alternating distortions in odd and even echoes and their correction in one of the PD-weighted acquisitions. Despite signal dropouts increasing with echo time, stretching and compressing of the tissue is visible close to sinuses in the uncorrected data (red arrow). These alternating distortions are eliminated by distortion correction, which does not affect signal dropout. Figure 2 shows R2* maps obtained from uncorrected, resampled and distortion-corrected magnitude images. Slight blurring, of similar nature, is introduced by resampling and distortion correction (see Figure 2 enlarged regions) where |VDM|>1 (shown in Figure 3). The spatial patterns in the variance maps were consistent across the three contrasts and both sessions. The variance was reduced by distortion correction and resampling, relative to the uncorrected case (Figure 3). The spatial distribution of the variance reduction resembled that of the mean |VDM|. Although variance reduction was induced by resampling, the reduction following distortion correction was larger (blue ellipses). Unwarping of distortions larger than 0.5 voxel (i.e. 0.3mm) yields median reduction in variance of around 50%. Table 2 summarises the median reduction in variance caused by resampling and distortion correction in increasingly larger regions encompassing |VDM|> 1, 0.5 or 0.3 voxels. Variance is consistently reduced by distortion correction for all three contrasts and both scan sessions. This reduction was consistently higher after distortion correction rather than smoothing, and the difference increased in regions with larger distortions.Discussion
At 7T distortions are visible in the readout direction (Figure 1) in SPGR acquisitions with modest receiver bandwidth. Bipolar readouts have inherently efficient sampling density, but at the cost of sensitivity to factors dependent on readout polarity, e.g. eddy currents and susceptibility-induced distortions. Increasing receiver bandwidth could reduce the effect of distortions, but at the cost of SNR, which is already limited by the high resolution and short TR nature of the acquisition. However, information about the field inhomogeneity is inherent in the signal’s phase and can therefore be used to correct images without any time penalty. Correcting for sub-voxel distortions reduced the R2* variability as the echoes, and concurrently readout polarity, varied. Linear interpolation was used during unwarping, which also reduced variance through smoothing. To control for this confound, we additionally examined images twice-interpolated by applying and reverting half the VDM, such that the tissue was returned to its original distorted location. While this reduced variance, the reduction afforded by distortion correction was consistently larger indicating that smoothing is only a partial explanation. The effect of smoothing could be reduced by higher order interpolation, or displacement matrix methods (5).Conclusion
Distortion correction in the sub-voxel regime can improve data consistency in bipolar SPGR acquisitions, potentially facilitating more robust R2* mapping in high-precision applications such as quantitative laminar analyses.Acknowledgements
The Wellcome Centre for Human Neuroimaging is supported by core funding from the Wellcome [203147/Z/16/Z].References
1. Weiskopf N, Edwards LJ, Helms G, Mohammadi S, Kirilina E. Quantitative magnetic resonance imaging of brain anatomy and in vivo histology. Nat. Rev. Phys. 2021;3:570–588 doi: 10.1038/s42254-021-00326-1.
2. Jezzard P, Balaban RS. Correction for geometric distortion in echo planar images from B0 field variations. Magn. Reson. Med. 1995;34:65–73 doi: 10.1002/mrm.1910340111.
3. Liu T, Wisnieff C, Lou M, Chen W, Spincemaille P, Wang Y. Nonlinear formulation of the magnetic field to source relationship for robust quantitative susceptibility mapping. Magn. Reson. Med. 2013;69:467–476 doi: 10.1002/mrm.24272.
4. Dymerska B, Eckstein K, Bachrata B, et al. Phase unwrapping with a rapid opensource minimum spanning tree algorithm (ROMEO). Magn. Reson. Med. 2021;85:2294–2308 doi: 10.1002/mrm.28563.
5. Visser E, Poser BA, Barth M, Zwiers MP. Reference-free unwarping of EPI data using dynamic off-resonance correction with multiecho acquisition (DOCMA). Magn. Reson. Med. 2012;68:1247–1254 doi: 10.1002/mrm.24119.
Figures