2695
Multivariate analysis of morphometric and quantitative magnetic resonance imaging metrics in aging and Alzheimer’s disease1Computational Brain Anatomy (CoBrA) Laboratory, Cerebral Imaging Centre, Douglas Mental Health University Institute, Montreal, QC, Canada, 2Integrated Program in Neuroscience, McGill University, Montreal, QC, Canada, 3Department of Biomedical Engineering, McGill University, Montreal, QC, Canada, 4Centre for the Studies on the Prevention of AD, Douglas Mental Health University Institute, Montreal, QC, Canada, 5Department of Psychiatry, McGill University, Montreal, QC, Canada, 6McConnell Brain Imaging Centre, Montreal Neurological Institute, McGill University, Montreal, QC, Canada
Synopsis
Morphometric and quantitative magnetic resonance imaging techniques have rarely been used simultaneously to characterise healthy aging and Alzheimer’s disease (AD) progression. Here, we are extracting four vertex-wise cortical metrics : cortical thickness, surface area, T1 value (myelin) and T2* values (iron). All these metrics were analysed using non-negative matrix factorization and linear models. Overall, cortical thinning seemed to be linked to both aging and AD progression, while decrease in myelin seemed to be a phenomenon mostly related to aging. No significant patterns of changes were seen in the prodromal phase of AD.
Structural magnetic resonance imaging (MRI) has proven to be a valuable tool for studying the Alzheimer’s disease (AD) spectrum, however morphometric measures lack neurobiological specificity. This may be aided by using a multivariate framework that integrates morphometric and quantitative MRI (qMRI) tissue parameters1. Here we examine cortical anatomy across the AD-spectrum using T1 and T2* maps, as indices of tissue myelination2 and iron content3 respectively.
Methods
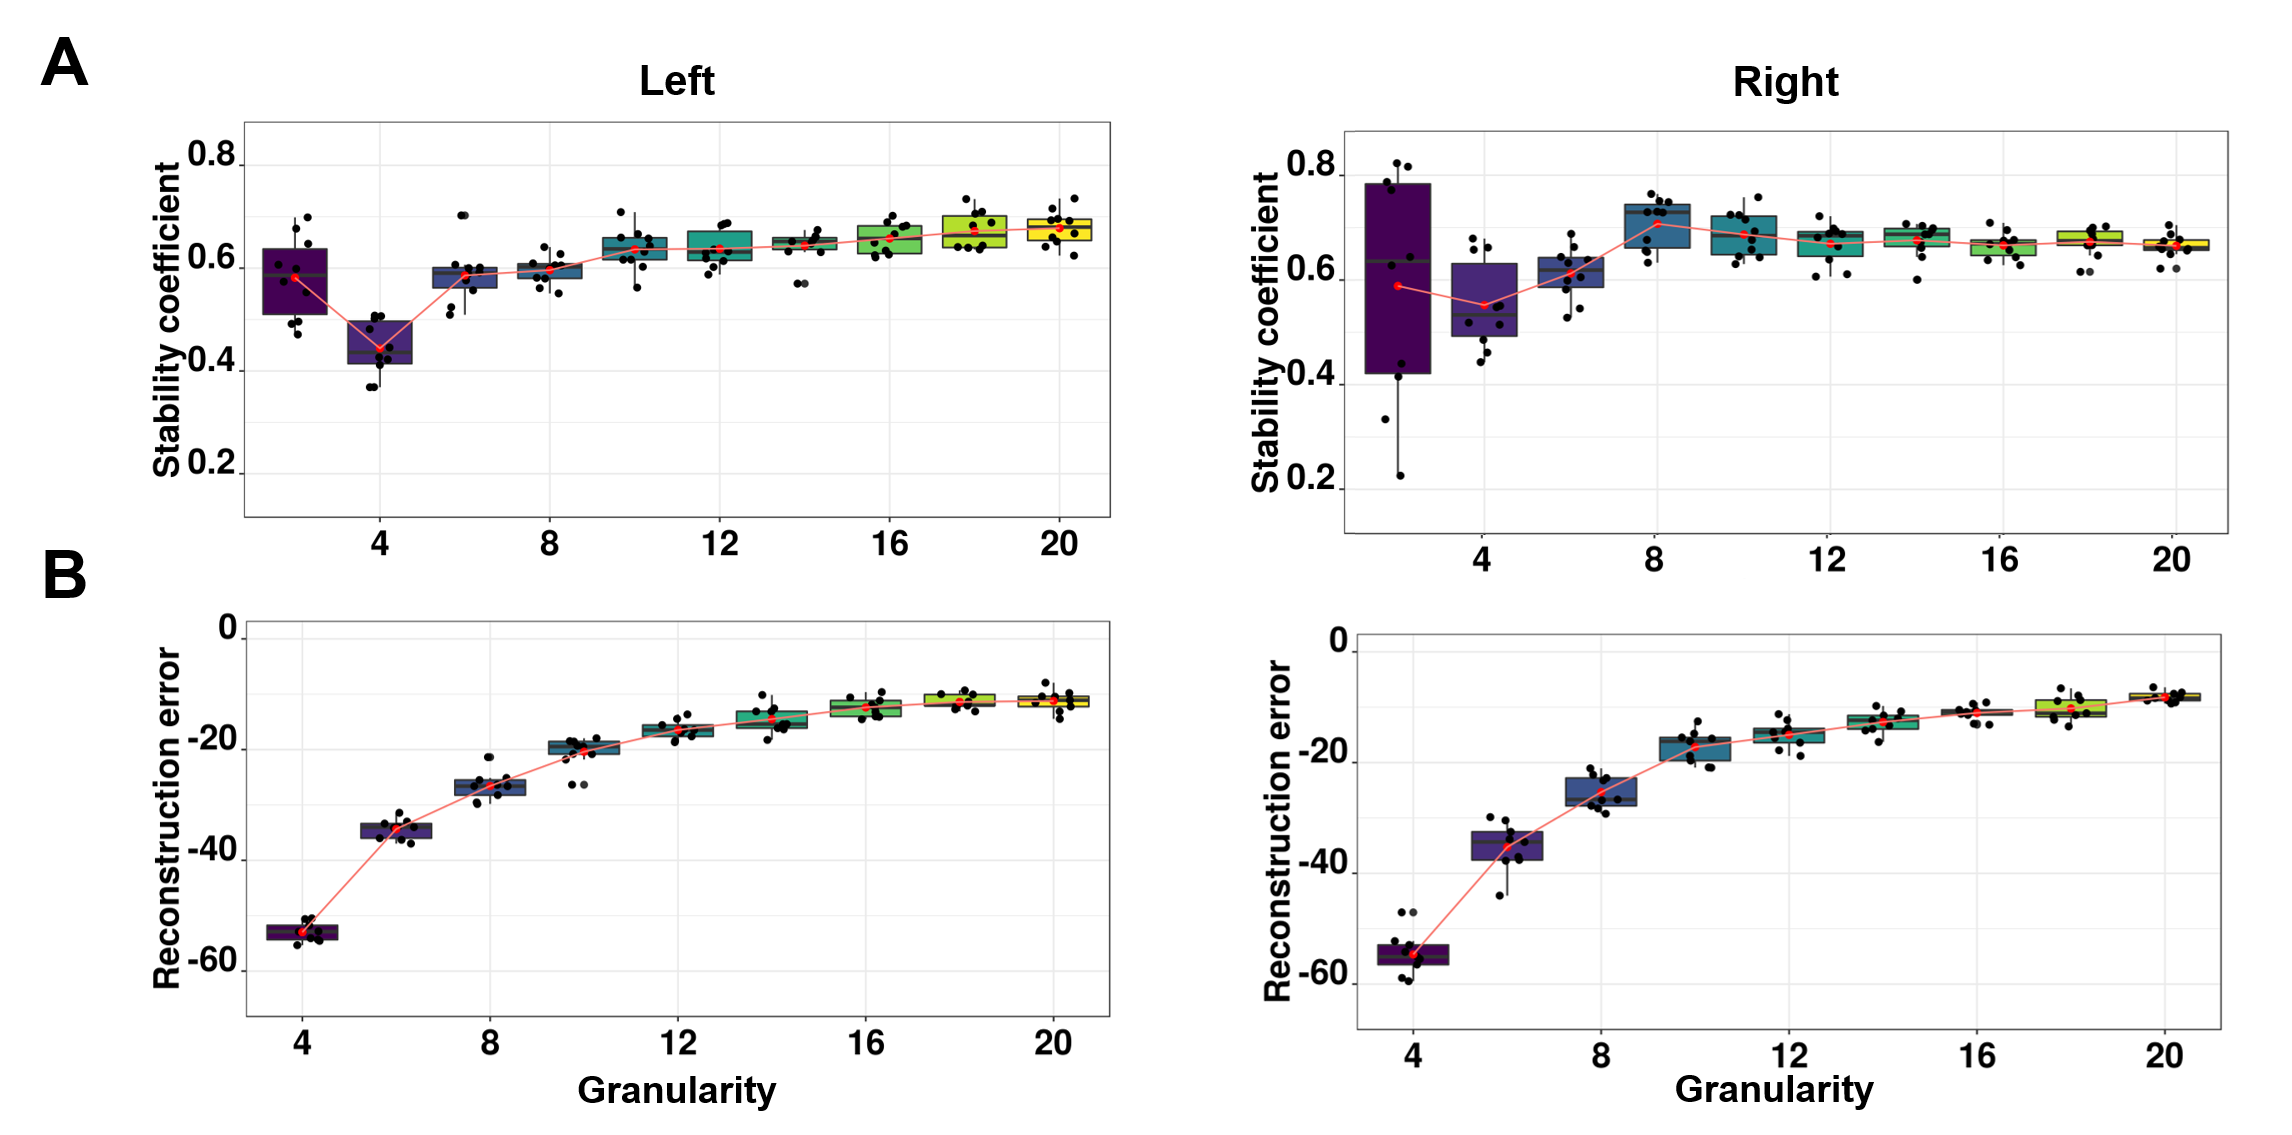
195 individuals were included: (44 healthy controls [HC], 67 cognitively healthy individuals with a parental AD-history [a known risk factor; FAMHX], 54 mild cognitive impairment [MCI] and 30 AD; age: 53-85 years old; 59% females). Participants were scanned on a 3T Siemens Tim Trio MRI scanner using a 32-channel head coil at the Douglas Research Centre (protocols approved by Research Ethics Board). T1 maps were acquired using the MP2RAGE sequence2 (TI1=700 ms, TI2=2500 ms, TR=5000 ms, TE=2.91 ms, α1=4, α2=5, bandwidth=240 Hz/pixel, echo spacing=6.8 ms, partial Fourier=6/8, resolution=1 mm isotropic). A 3D multi-echo GRE sequence (12 echoes, TR/TE1/TE12=44/2.84/39.80 ms, echo spacing=3.36 ms; bandwidth=500 Hz/Px; flip angle =15°, resolution = 1 mm isotropic) was used to calculate T2* maps by fitting a monoexponential decay curve (T2* = time at 37% of the signal at TE=0). To correct for the T2* dependence on myelinated fiber orientation relative to B0, T2* values were residualized from the angle between the vertex normal and B04. From MP2RAGE, the T1-weighted UNI images were preprocessed using the minc-bpipe-library pipeline, including N4 bias field inhomogeneity correction5 and then processed through the CIVET pipeline (version 1.1.12) to extract vertex-wise cortical thickness (CT), surface area (SA) and to generate pial surfaces (“0% surface”) and grey/white matter (GM/WM; “100% surface”). GM surfaces were created at several cortical depths (12.5%, 25%, 50%, 62.5%, 75%, 87.5%), from the pial surface to the GM/WM surface to extract and average vertex-wise T1 and T2* values from different depths. Orthogonal projective non-negative matrix factorization (OPNMF)6 was used to analyze morphometric data (CT, SA, T1, T2*)7. OPNMF decomposes a m x n input matrix into a component matrix W (m x k), and weight matrix H (k x n), constructed such that their multiplication minimizes the reconstruction error between the original and reconstructed data. The number of components, k, is user defined. W describes component location, while H contains subject-wise weightings describing individual variability of morphometric measures in each component. Each column of the input matrix contains hemispheric voxel-wise metrics (m=38561) and each row represents subject metrics (n=4 metrics x 195 subjects = 780 rows). To select the optimal number of components, we performed a split half analysis for k=2 to k=20 to assess stability and accuracy of decompositions across different granularities7. Linear models were used to investigate the relationships between each component weight and variables of interest. Age, group (HC as reference), sex, education, APOE4 status and Montreal Cognitive Assessment (MoCA) scores were used as fixed effects. False discovery rate was used to correct for multiple comparisons at p<0.05 threshold (q-values).
Results
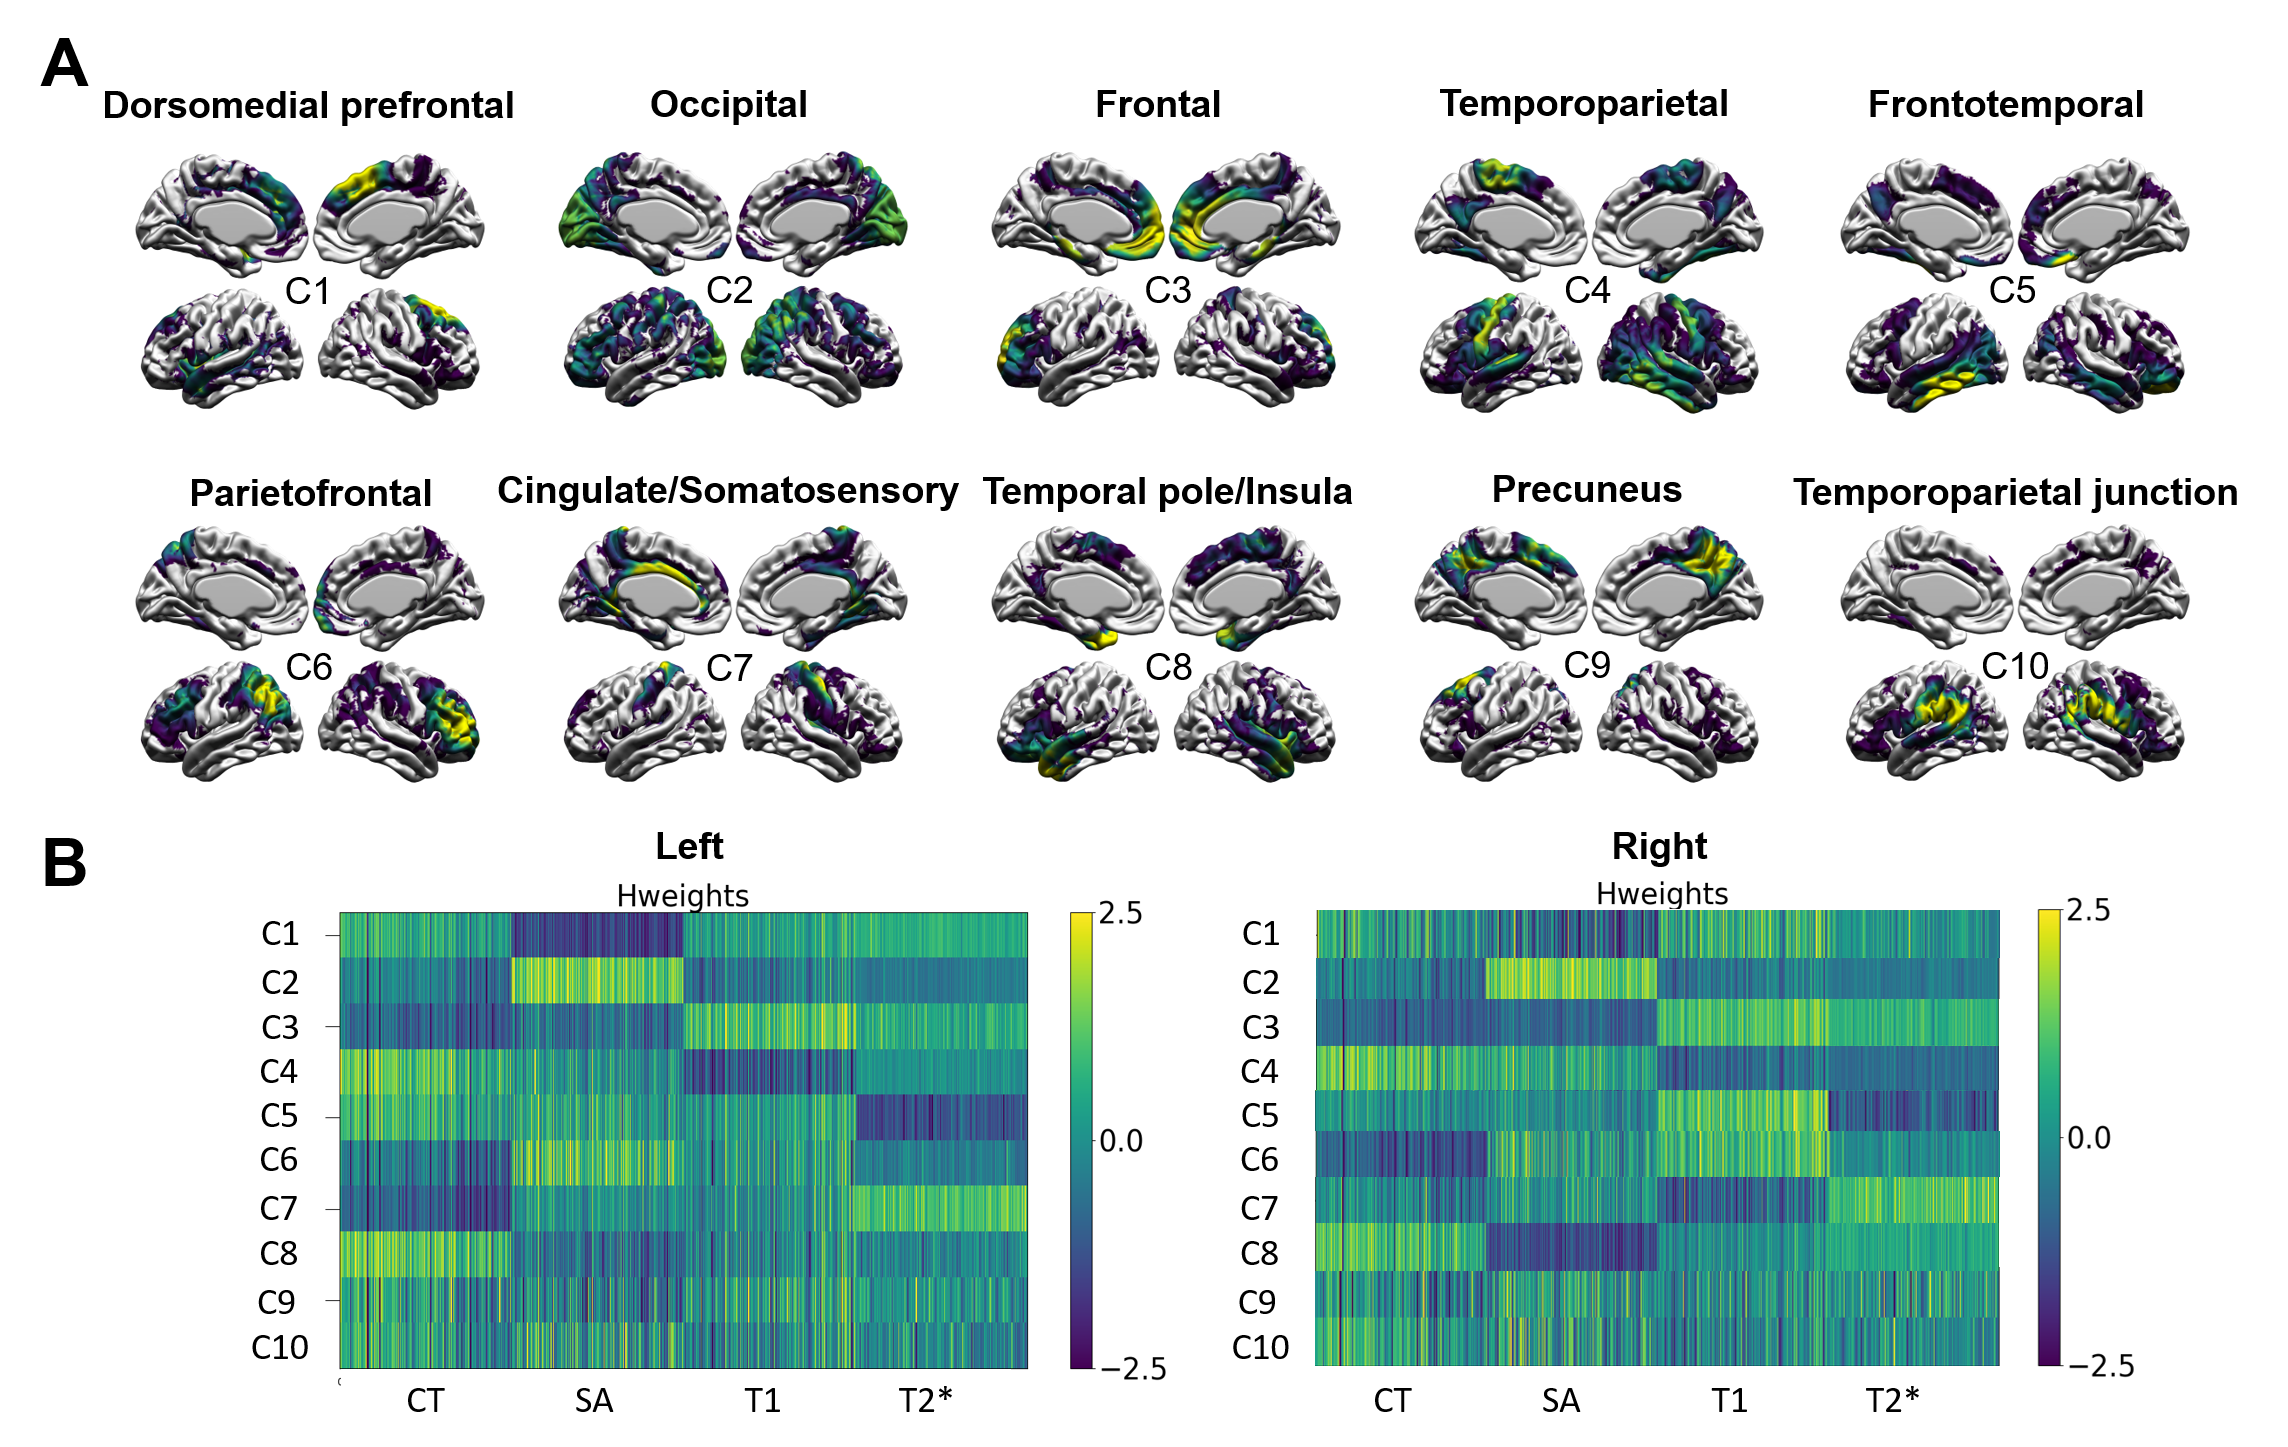
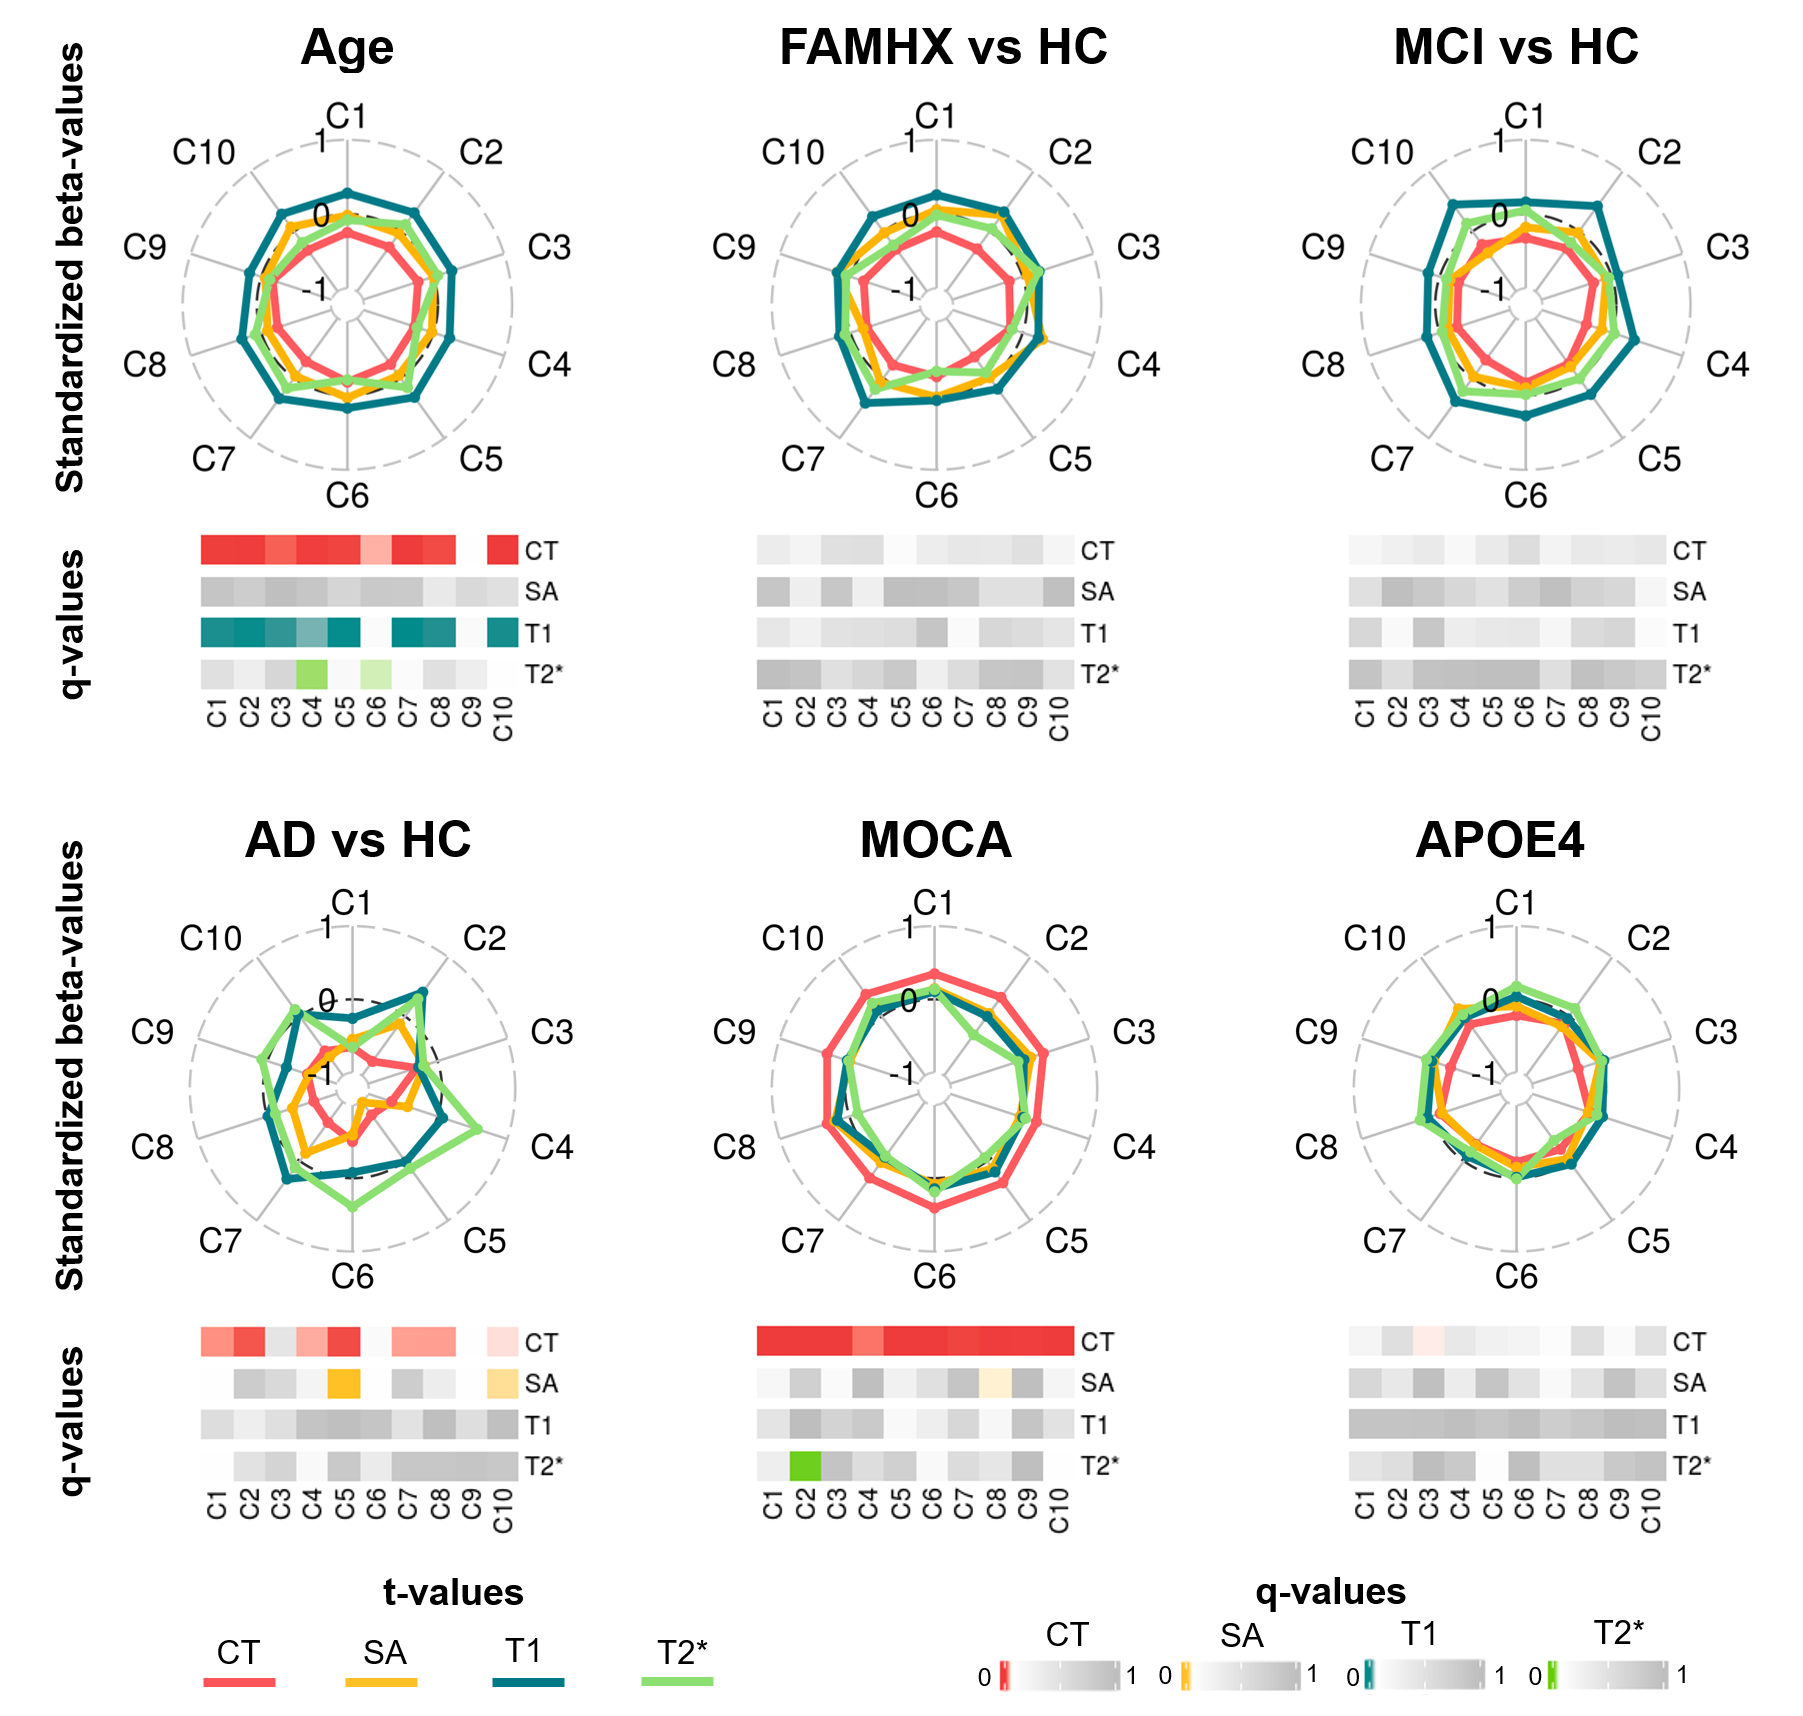
The stability analyses demonstrated that 10 components were the best suited to maximize the stability coefficient (figure 1A) and minimize the reconstruction error (figure 1B). These components demonstrated ten distinct brain patterns similar across hemispheres and representative of various cortical regions (for example C2 = occipital, C3=prefrontal; figure 2A). Figure 2B displays the subject weight matrix, used to describe both the group and individual level microstructural patterns associated with each component. Figure 3 shows the relationship between component weights and variables of interest. Age had a significant negative effect on CT of all components except C9 and on the SA of C4 and C6. Further, age was linked with increased T1 values in all components except C6 and C9. AD individuals demonstrated reduced CT in all components except C3, C6 and C9 and smaller SA values in C5, C6 and C10 compared to the controls. No significant difference was found between FAMHX and MCI groups compared to the controls. MoCA scores were positively related to CT in all components and negatively related to T2* value in C2.
Discussion
Advanced age is linked to reduced CT and myelin content (increased T1) in most areas of the cortex except the precuneus. Additionally, the temporoparietal and parietofrontal regions demonstrated iron accumulation in aging (reduced T2*). AD participants had lower CT overall, but specifically in the occipital and frontotemporal lobe8 and lower SA in the frontotemporal lobe and temporoparietal junction area9. MOCA scores were strongly related to increased CT throughout the brain and higher iron content in the occipital lobe. APOE4 carriers were linked to specific CT reduction in the frontal lobe.
Conclusion
Overall, cortical thinning is associated with both aging and AD progression, while decrease in myelin seems to be a phenomenon mostly related to aging. No significant patterns of changes were seen in the at-risk individuals and in the MCI group suggesting that the changes seen in the AD group might be subtle during the prodromal phase of AD.
Acknowledgements
No acknowledgement found.References
1. Tardif, C. L. et al. Advanced MRI techniques to improve our understanding of experience-induced neuroplasticity. Neuroimage 131, 55–72 (2016).
2. Marques, J. P. et al. MP2RAGE, a self bias-field corrected sequence for improved segmentation and T1-mapping at high field. Neuroimage 49, 1271–1281 (2010).
3. Stüber, C. et al. Myelin and iron concentration in the human brain: A quantitative study of MRI contrast. NeuroImage vol. 93 95–106 (2014).
4. Cohen-Adad, J. et al. T2* mapping and B0 orientation-dependence at 7T reveal cyto- and myeloarchitecture organization of the human cortex. Neuroimage 60, 1006–1014 (2012).
5. Tustison, N. J. et al. N4ITK: improved N3 bias correction. IEEE Trans. Med. Imaging 29, 1310–1320 (2010).
6. Sotiras, A., Resnick, S. M. & Davatzikos, C. Finding imaging patterns of structural covariance via Non-Negative Matrix Factorization. Neuroimage 108, 1–16 (2015).
7. Patel, R. et al. Investigating microstructural variation in the human hippocampus using non-negative matrix factorization. Neuroimage 207, 116348 (2020).
8. Pini, L. et al. Brain atrophy in Alzheimer’s Disease and aging. Ageing Res. Rev. 30, 25–48 (2016).
9. Yang, H. et al. Study of brain morphology change in Alzheimer’s disease and amnestic mild cognitive impairment compared with normal controls. General Psychiatry vol. 32 e100005 (2019).
Figures