2689
seeVR: an open toolbox for analyzing cerebro-vascular reactivity (CVR) data1Radiology, UMC Utrecht, Utrecht, Netherlands
Synopsis
The seeVR toolbox is a series of Matlab functions designed help analyze CVR through rapid implementation of processing pipelines. Depending on the type of stimulus used and the properties of the data acquisition, a number of options are available. All code is open-source and freely downloadable from the seeVR github repository (https://github.com/abhogal-lab/seeVR).
Purpose
Mapping CVR is done by acquiring consecutive Blood Oxygen Level Dependent (BOLD) functional MRI (fMRI) images (example figure1) while delivering a physiological stimulus intended to stress the cerebro-vasculature. This is usually through the inhalation of CO2-enriched air or the injection of a vasodilator such as acetazolamide. In stimulating the dilatory properties of the vasculature, CVR mapping techniques provides a means through which to reveal functional impairments[1,2] related to disease. This application has gradually translated this exciting technique from the research setting towards clinical application in a range of conditions[3-5]; see recent editorial in Radiology[6]. A variety of different approaches to generating CVR results have been proposed, each with their own nuances[7-9]. For starting researchers or clinicians interested in investigating CVR, but lacking support from a dedicated research group, the learning curve and start-up time to develop appropriate software tools can represent major barriers. The seeVR toolbox is a series of Matlab functions designed help analyze CVR through rapid implementation of processing pipelines. Depending on the type of stimulus used and the properties of the data acquisition, a number of options are available. All code is open-source and freely downloadable from the seeVR github repository (https://github.com/abhogal-lab/seeVR).Toolbox Overview
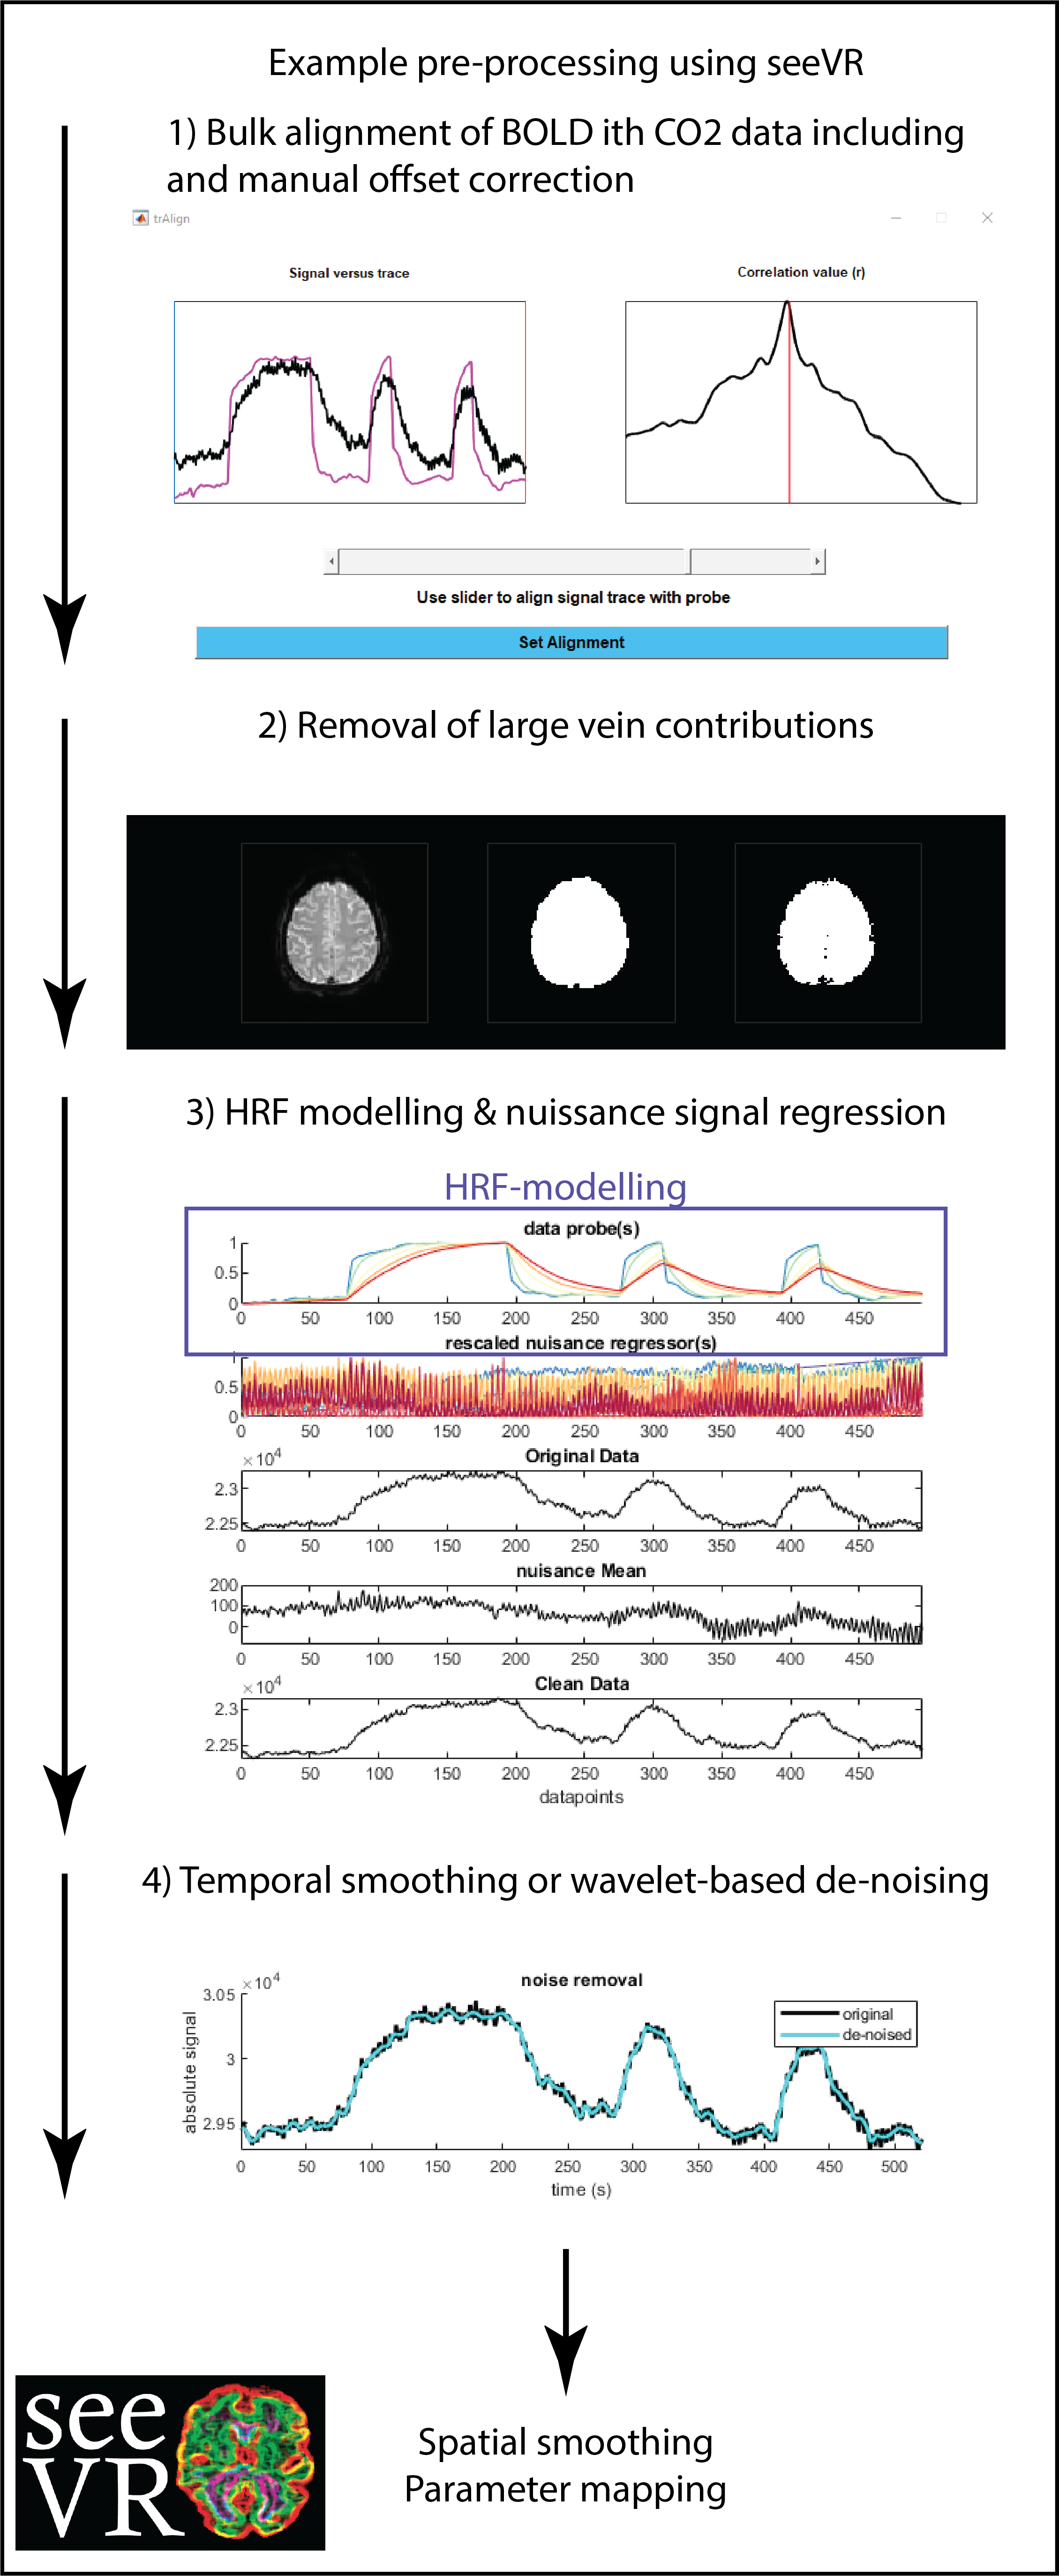
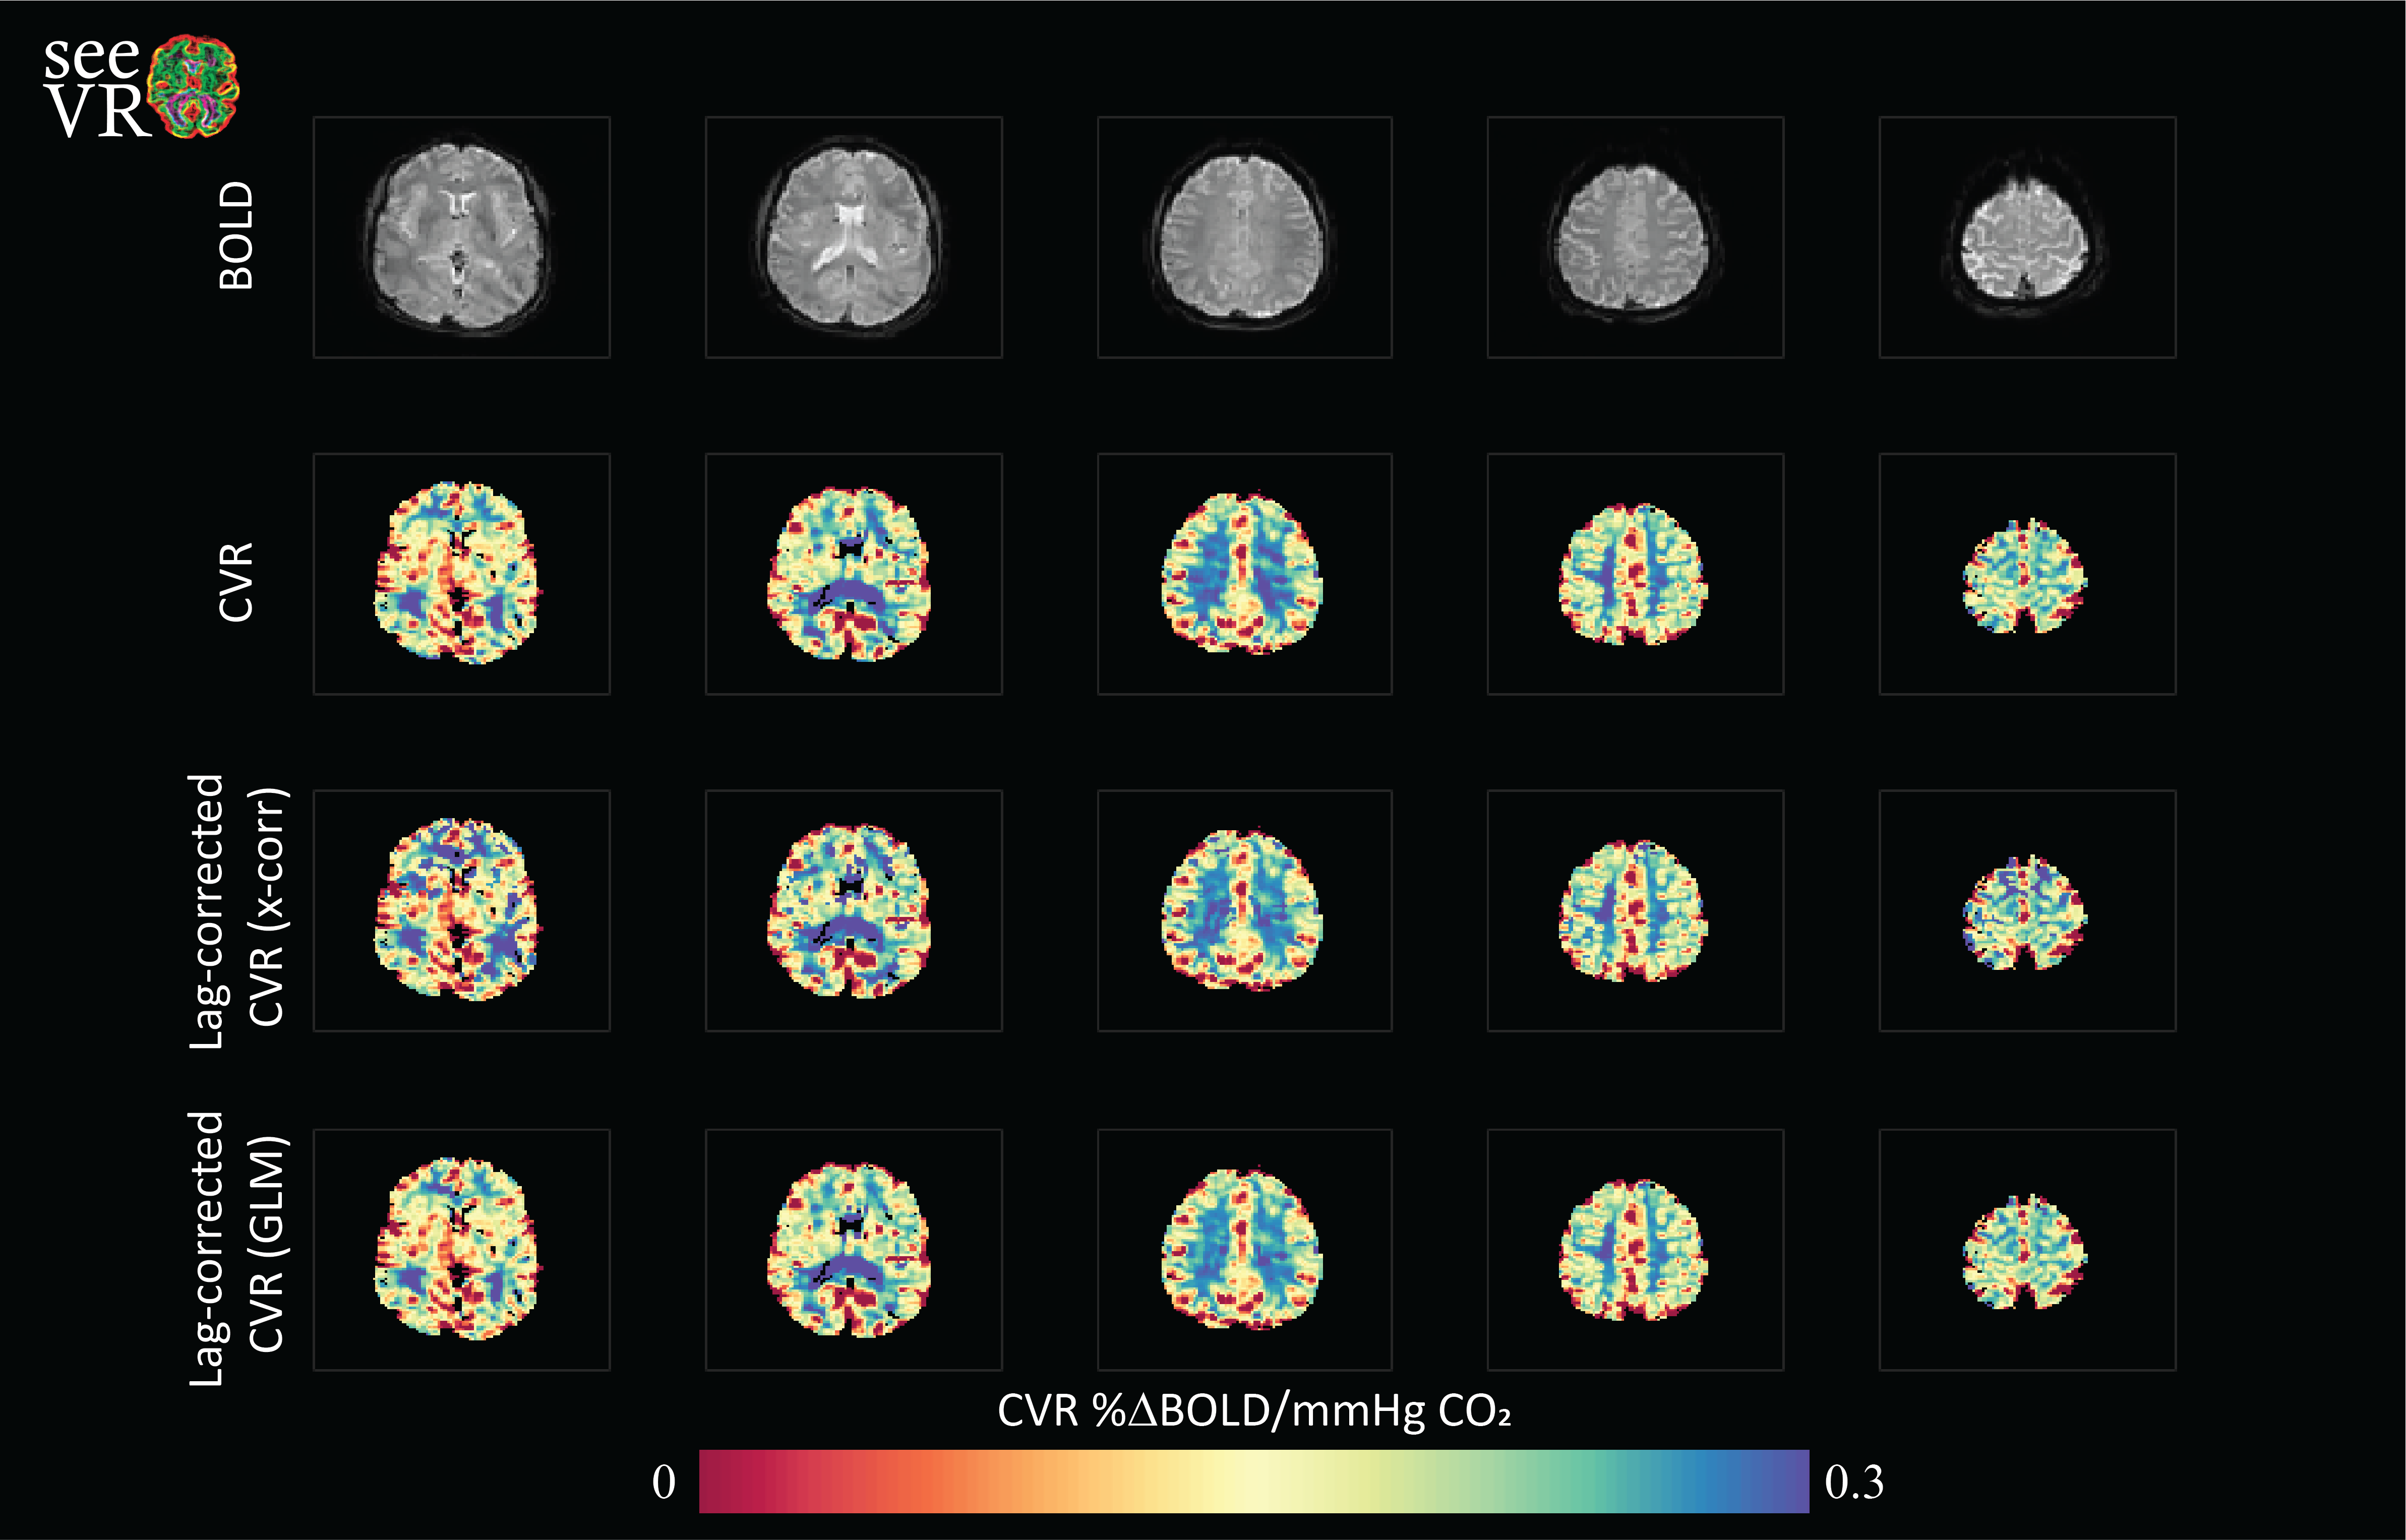
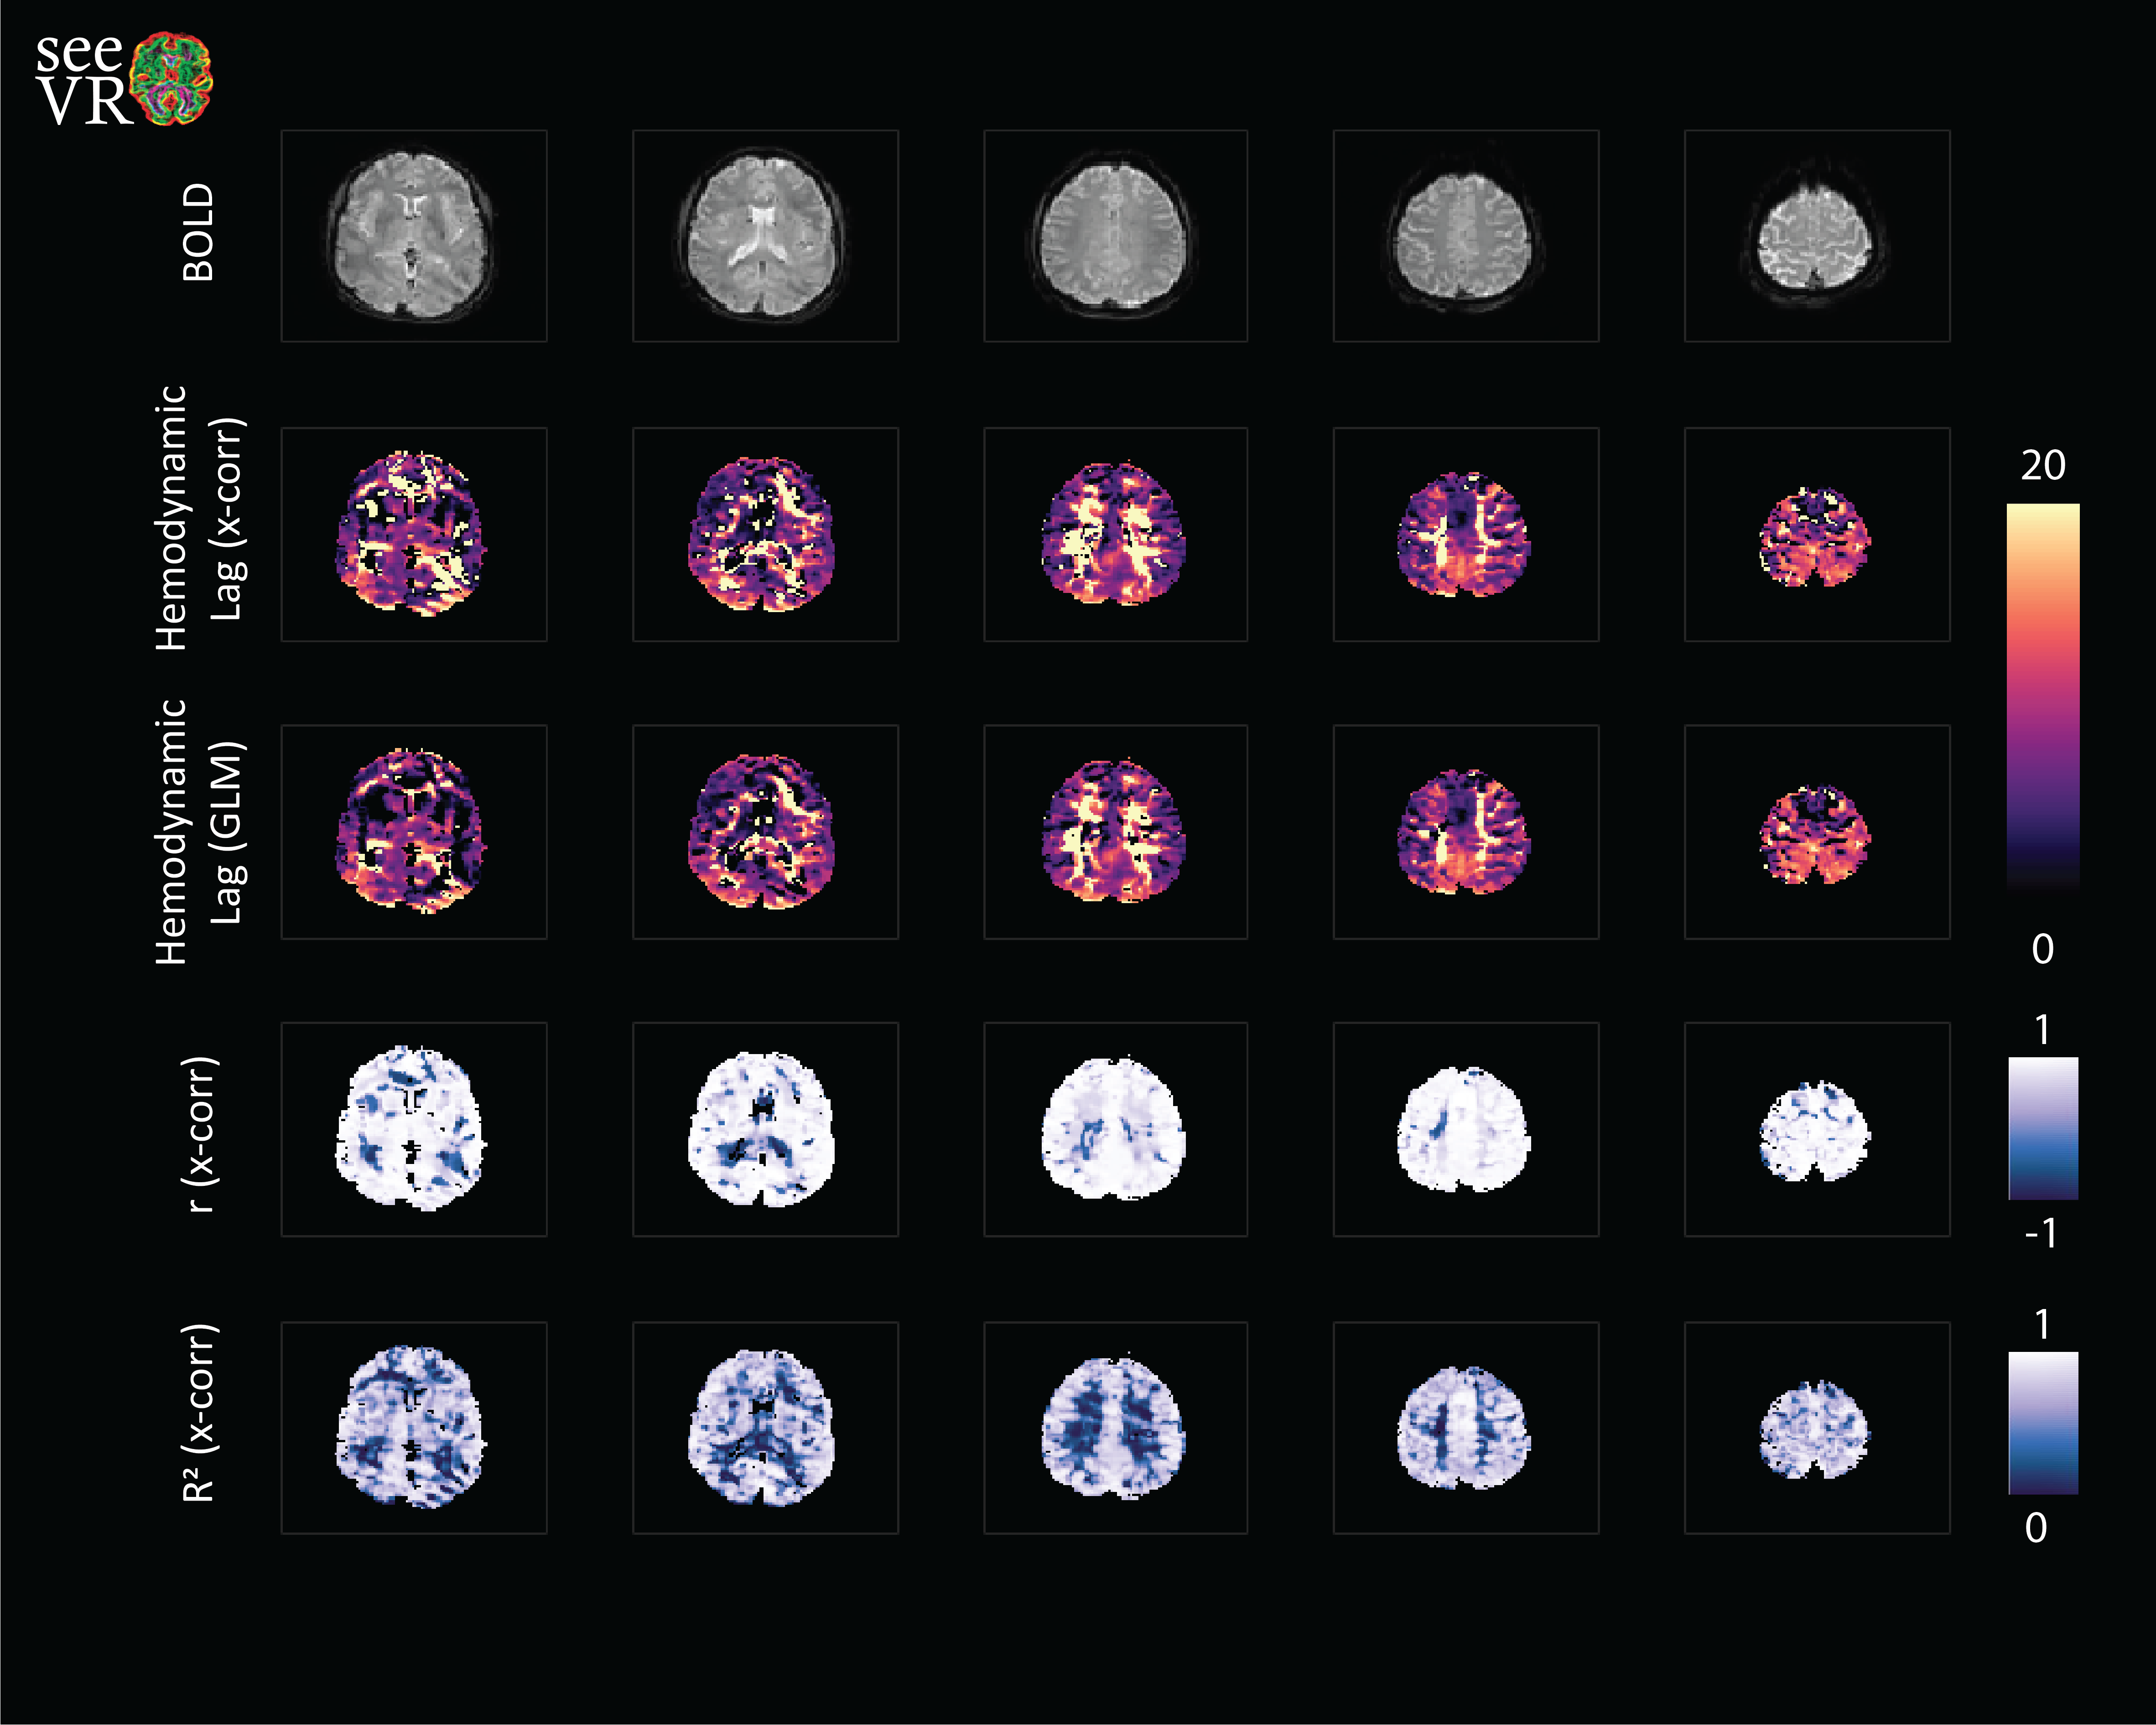
SeeVR is an open-source toolbox of MATLAB (The Mathworks, 2020a) functions distributed under the GNU General Public License. SeeVR makes use of the parallel computing toolbox where possible, the statistics toolbox, the wavelet toolbox and a selection of user-developed Matlab functions. SeeVR supports the entire processing pathway from the loading of imaging data to the saving of hemodynamic parameter maps. Pipelines can be constructed for data cleaning (Figure 1), bulk-processing of clinical data for simple outcomes such as basic CVR maps (Figure 2), or more complex analysis to extract fine-scale physiological information such as dispersion/onset, hemodynamic lag and lag-corrected CVR. The toolbox facilitates flexibility in processing options and major functions are built with tunable parameters that can be optimized based on data properties such as resolution, TR or SNR. There are functions for basic data handling, CO2/O2 (or alternative) trace alignment, dispersion modelling [7,10] using exponential and/or double-gamma HRFs, large vein and CSF removal, nuisance signal regression and CVR (also without CO2[11]) and hemodynamic lag mapping[9, 12] using cross-correlation and/or shifted-GLM approaches (Figure 3). Where possible, relevant statistical maps are output (t-statistics, r, beta (GLM), R2). As input, seeVR generally takes pre-processed BOLD data (i.e. distortion corrected, temporally re-aligned) in NIFTI format.Example Output
Figure 1 demonstrate some of the possible pre-processing steps that can simply be applied using various seeVR functions. Usually, passing the data, a mask and in some cases nuisance or explanatory regressors that are easily generated with associated functions is enough. When the user is satisfied with their pre-processing, the resulting data can be passed to the more complex functions that are used to generate hemodynamic parameter maps. Depending on the options chosen this may consist of simple CVR analysis (Figure 2) or more elaborate temporal analysis (figure 3).Discussion
The seeVR toolbox was designed to facility the rapid development of CVR data-analysis pipelines. A main strength is the implementation of a variety of analysis techniques that have been presented in the CVR literature as well expanded functionality such as the the ability to easily handle nuisance signal regression. Future development will include tools for plotting hemodynamic maps as well as a simple to use GUI using the Matlab runtime environment. It is hoped that the open-source nature of the toolbox will promote the engagement of a user community to improve current implementations, expand functionality and engage in open and transparent dissemination of analysis methods and parameter choices.Acknowledgements
I would like to acknowledge the following for their valuable discussions and contributions: Allen A. Champagne, Mario Baez, Wouter Schellekens, Eva E. Grinsven, Jeroen Siero, Stefan Rademakers. This work was partially funded by a VENI research grant awarded to the author (VENI.194.056).References
[1] Fierstra, J., et al., Measuring cerebrovascular reactivity: what stimulus to use? The Journal of Physiology, 2013. 591(23): p. 5809-5821. 11.
[2] Liu, P., J.B. De Vis, and H. Lu, Cerebrovascular reactivity (CVR) MRI with CO2 challenge: A technical review. Neuroimage, 2019. 187: p. 104-115.
[3] Spano, V.R., et al., CO2 blood oxygen level-dependent MR mapping of cerebrovascular reserve in a clinical population: safety, tolerability, and technical feasibility. Radiology, 2013. 266(2): p. 592-8. 13.
[4] Watchmaker, J.M., et al., Clinical Use of Cerebrovascular Compliance Imaging to Evaluate Revascularization in Patients With Moyamoya. Neurosurgery, 2019. 84(1): p. 261-271. 14.
[5] Donahue, M.J., et al., Routine clinical evaluation of cerebrovascular reserve capacity using carbogen in patients with intracranial stenosis. Stroke, 2014. 45(8): p. 2335-41.
[6] Wolf, R.L. and J.B. Ware, Cerebrovascular Reactivity Mapping Made Simpler: A Pragmatic Approach for the Clinic and Laboratory. Radiology, 2021. 299(2): p. 426-427.
[7] Measuring cerebrovascular reactivity: the dynamic response to a step hypercapnic stimulusJ Poublanc, AP Crawley, O Sobczyk, G Montandon, K Sam, DM Mandell, …, JCBFM 35 (11), 1746-1756
[8] A novel method of quantifying hemodynamic delays to improve hemodynamic response, and CVR estimates in CO2 challenge fMRIJ Yao, HC Yang, JH Wang, Z Liang, TM Talavage, GG Tamer Jr, I Jang, …, JCBFM, 2021
[9] A novel perspective to calibrate temporal delays in cerebrovascular reactivity using hypercapnic and hyperoxic respiratory challengesAA Champagne, AA Bhogal, NS Coverdale, CI Mark, DJ Cook, Neuroimage 187, 154-165
[10] Cerebrovascular reactivity in the brain white matter: magnitude, temporal characteristics, and age effectsBP Thomas, P Liu, DC Park, MJP Van Osch, H Lu, Journal of Cerebral Blood Flow & Metabolism 34 (2), 242-247
[11] Cerebrovascular reactivity mapping using resting-state BOLD functional MRI in healthy adults and patients with Moyamoya diseaseP Liu, G Liu, MC Pinho, Z Lin, BP Thomas, M Rundle, DC Park, J Huang, …, Radiology 299 (2), 419-425
[12] Physiological denoising of BOLD fMRI data using Regressor Interpolation at Progressive Time Delays (RIPTiDe) processing of concurrent fMRI and near-infrared spectroscopy (NIRS)BB Frederick, LD Nickerson, Y Tong, Neuroimage 60 (3), 1913-1923
Figures