2687
Demonstration of an end-to-end open-source pipeline for a spiral-based rs-fMRI sequence1Department of Biomedical Engineering, Columbia University, New York, NY, United States, 2Columbia Magnetic Resonance Research Center, New York, NY, United States
Synopsis
Spiral trajectories are suitable for fMRI as they provide high temporal resolution and motion tolerance. However, they are not typically available on scanners as the associated reconstruction is more involved. We have demonstrated the feasibility of an open-source spiral sequence end-to-end pipeline and compared it to the vendor-supplied EPI sequence. Although the spiral images showed signal loss near the frontal sinus, both datasets presented similar image quality and contrast. Importantly, the spiral sequence had a 2.3-fold advantage on temporal SNR and achieved analogous functional connectivity maps of the DMN, demonstrating the sequence BOLD sensitivity and viability.
Introduction
Resting-state functional Magnetic Resonance Imaging (rs-fMRI)1,2 sequences must deliver high spatio-temporal resolution while maximizing the T2* sensitivity to detect changes in the BOLD3 signal accurately. The spiral trajectory efficient use of gradients provides reduced sensitivity to motion and flow phase errors, increased sensitivity to functional activations4, and achieve shorter read-out times compared to Echo-Planar Imaging (EPI)4,5. The barriers to the widespread use of spiral sequences for fMRI include complex reconstruction schemes and restricted availability in commercial scanners4. We can relax the latter constraint by leveraging open-source software to design and implement spiral fMRI sequences in multi-vendor MRI systems6,7. A previous study8 demonstrated the feasibility of implementing a spiral-based sequence in a cross-vendor manner. The current study aims to demonstrate the feasibility of an end-to-end open-source pipeline from sequence design to functional analysis using a spiral trajectory for rs-fMRI.Methods
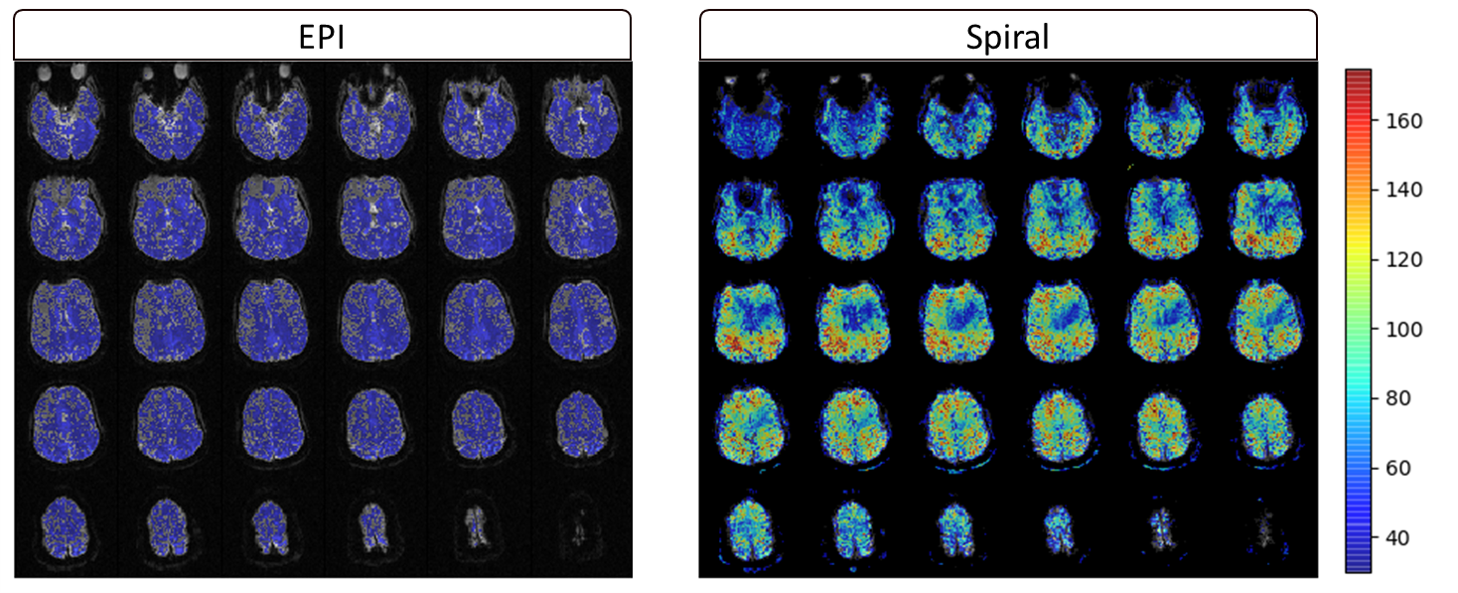
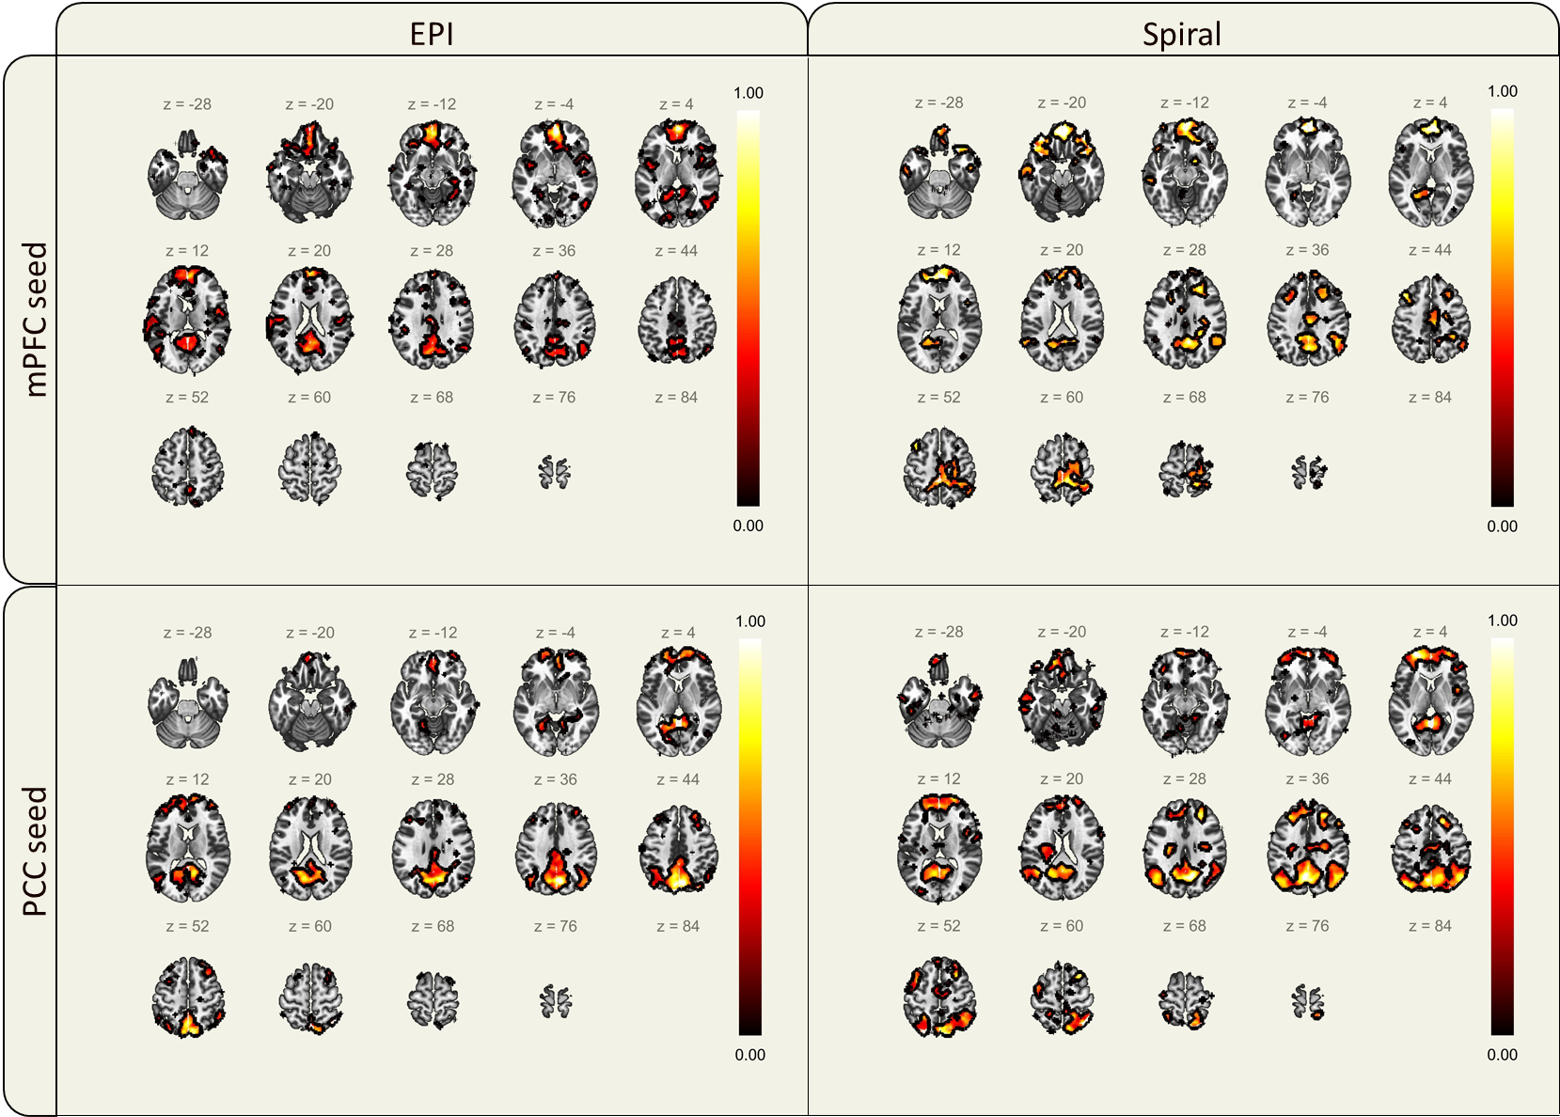
The spiral sequence is a three-shot 3D stack-of-spirals designed using Pulseq5 for deployment in a 3.0T Prisma Fit Siemens scanner (Siemens Healthineers, Erlangen). To improve the temporal resolution, the trajectory acquires only one of the shots per slice. A sliding window reconstruction later combines each of three consecutive time points to form a fully-sampled k-space volume. To validate the resulting images, we considered the vendor-supplied interleaved EPI sequence as the gold standard with similar acquisition parameters (Table 1). The imaging protocol also included a T1-weighted sequence to provide structural detail and a field map acquisition using the same resolution and slice planning as the functional sequences. We set the number of BOLD measurements to be 90 and 93 for the EPI and spiral sequences, respectively, in order to obtain 5 minutes long rs-fMRI experiments. We reconstructed the spiral raw data from the scanner using Python’s Non-Uniform Fourier Transform (PyNUFFT)9 package and visually compared the resulting images with EPI images. We also corrected these datasets using the acquired field map after phase unwrapping. For the EPI images, we leveraged FSL’s FUGUE10 tool for EPI distortion correction while spiral correction utilized the open-source OCTOPUS11 tool. The corrected images were again visually compared. Additionally, we calculated the temporal signal-to-noise ratio (TSNR) to assess the time course stability by dividing the mean of each voxel across time points by its standard deviation. Finally, we used the SPM-based functional connectivity toolbox CONN12 to obtain the functional connectivity maps for the Default Mode Network (DMN)13.Results
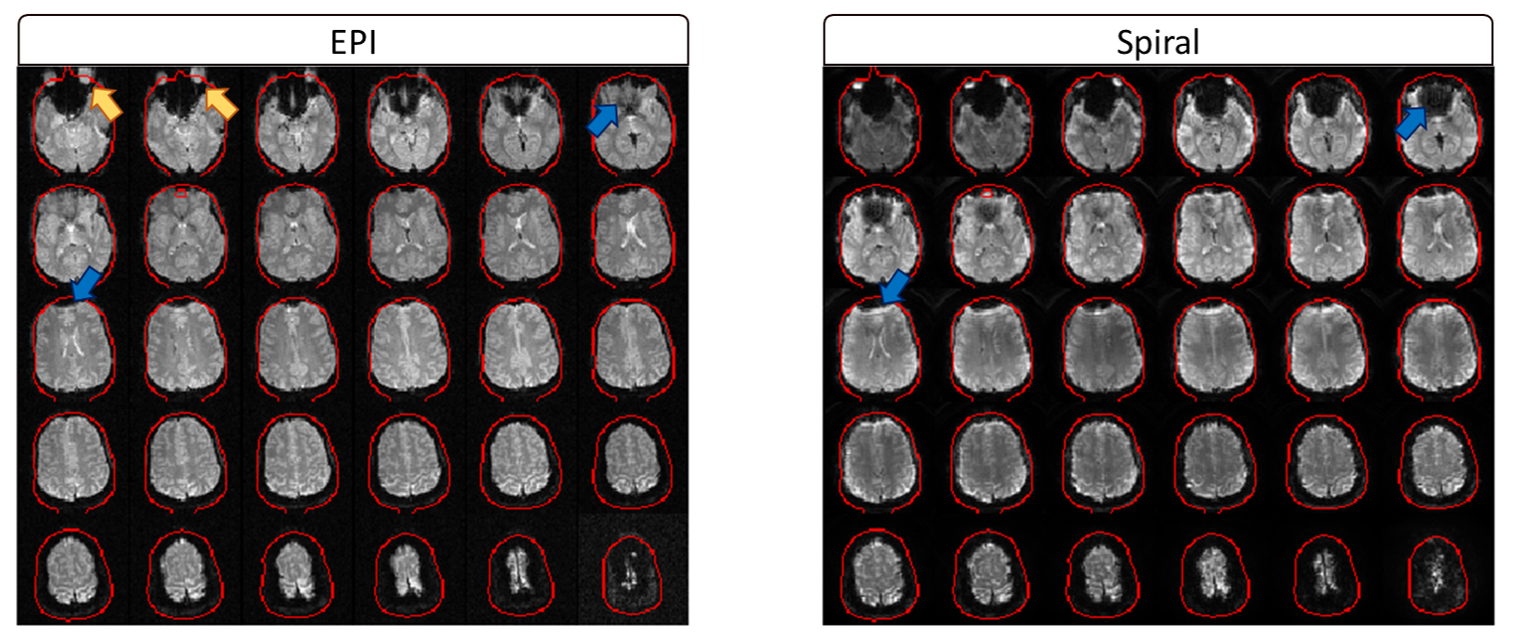
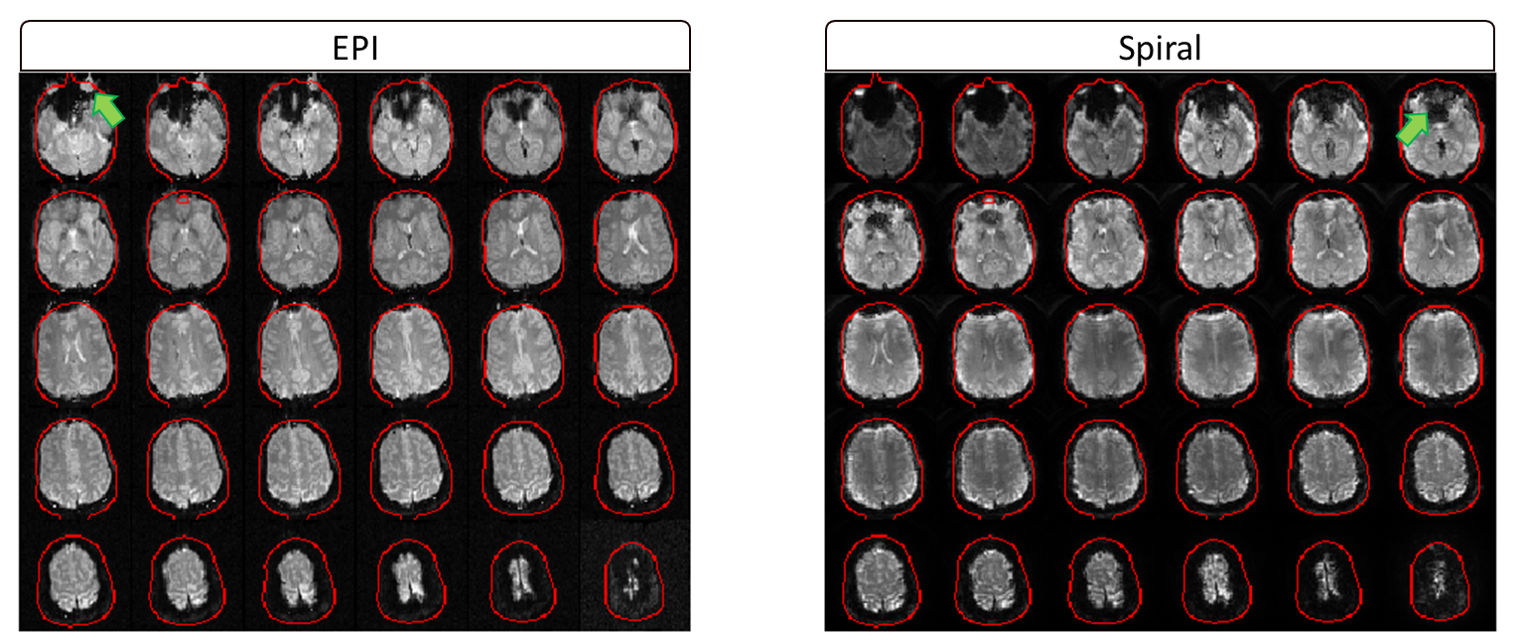
Visually inspecting the image quality of the resulting vendor-supplied EPI and open-source spiral sequences (Figure 1), we observed field inhomogeneity and susceptibility related artifacts in both cases. EPI images present geometrical distortion along the anterior-posterior direction, especially noticeable close to the eyes. Additionally, signal loss is present in both sets of images but more prominent in the spiral data in regions near the nasopharyngeal cavity and frontal sinus. Correction techniques moderately improve EPI’s geometric distortion and partly recover signal loss in the spiral images (Figure 2). Mean TSNR calculations returned a value of 35.55 and 81.5 for the EPI and spiral sequences, respectively (Figure 3), yielding a TSNR advantage of 2.3-fold by the spiral acquisition. Figure 4 shows DMN functional connectivity maps for both functional sequences using as seeds the medial Prefrontal Cortex (mPFC) and Posterior Cingulate Cortex (PCC).Discussion
Long read-out trajectories such as spiral and EPI have the advantage of rapidly acquiring k-space in a single TR. However, phase errors induced by field inhomogeneities or tissue susceptibilities accumulate along the readout direction, causing artifacts in the acquired images. The readout duration of the multi-shot spiral trajectory was almost three times shorter than the single-shot EPI. For this reason, blurring is not as visible in the images as geometrical distortions or signal loss, especially prominent in brain regions where air and tissue interface (Figure 1). Note that any difference in T2* contrast might be related to the differences in FA, TE and TR between both sequences. The TSNR mean values and maps obtained for each sequence with a very similar number of time points suggest that the spiral sequence has a higher BOLD sensitivity5. Furthermore, EPI mean TSNR was below 40, the threshold to detect an effect between conditions in fMRI14, indicating that more time points and consequently, a longer acquisition is required. The functional connectivity maps show connections between the mPFC and PCC as expected in the DMN for both sets of acquired data although these connections have a higher magnitude in the spiral maps. Moreover, the maps of the spiral data using the PCC seed show more connections to the angular gyrus. Future work on the open-source sequence includes investigating how the shimming settings of the scanner apply to Pulseq sequences to attempt to reduce field inhomogeneity artifacts in the images. Additionally, we will acquire data from more subjects to further explore the differences between spiral and EPI functional maps and assess the reproducibility and repeatability of the open-source sequence for cross-vendor sequence harmonization.Conclusion
We have successfully demonstrated the viability of functional images acquired using an open-source spiral sequence. The end-to-end pipeline up to resting-state functional connectivity analysis was validated comparing the results with the vendor-supplied EPI sequence.Acknowledgements
This study was funded [in part] by the Seed Grant Program for MR Studies and the Technical Development Grant Program for MR Studies of the Zuckerman Mind Brain Behavior Institute at Columbia University and Columbia MR Research Center site.
References
- B. Biswal, F. Zerrin Yetkin, V. M. Haughton, and J. S. Hyde, “Functional connectivity in the motor cortex of resting human brain using echo‐planar MRI,” Magn. Reson. Med., vol. 34, no. 4, pp. 537–541, 1995.
- F. Barkhof, S. Haller, and S. A. R. B. Rombouts, “Resting-state functional MR imaging: A new window to the brain,” Radiology, vol. 272, no. 1, pp. 29–49, 2014.
- J. E. Chen and G. H. Glover, “Functional Magnetic Resonance Imaging Methods,” Neuropsychol. Rev., vol. 25, pp. 289–313, 2015.
- J. D. Winter, J. Poublanc, A. P. Crawley, and A. Kassner, “Comparison of Spiral Imaging and SENSE-EPI at 1.5 and 3.0 T Using a Controlled Cerebrovascular Challenge,” J. Magn. Reson. Imaging, vol. 29, pp. 1206–1210, 2009.
- G. H. Glover, “Spiral imaging in fMRI,” Neuroimage, vol. 62, no. 2, pp. 706–712, 2012.
- J. F. Nielsen and D. C. Noll, “TOPPE: A framework for rapid prototyping of MR pulse sequences,” Magn. Reson. Med., vol. 79, pp. 3128–3134, 2018.
- K. Ravi, S. Geethanath, and J. Vaughan, “PyPulseq: A Python Package for MRI Pulse Sequence Design,” J. Open Source Softw., vol. 4, no. 42, 2019.
- M. Manso Jimeno, S. Geethanath, J.F. Nielsen and D.C. Noll, “Cross-vendor implementation of a Stack-of-spirals PRESTO BOLD fMRI sequence using TOPPE and Pulseq,” in ISMRM & SMRT Virtual Conference & Exhibition, 2020
- J. M. Lin, “Python non-uniform fast fourier transform (PyNUFFT): An accelerated non-cartesian MRI package on a heterogeneous platform (CPU/GPU),” J. Imaging, vol. 4.3, no. 51, 2018.
- M. Jenkinson, C. F. Beckmann, T. E. J. Behrens, M. W. Woolrich, and S. M. Smith, “FSL - Review,” Neuroimage, vol. 62, pp. 782–790, 2012.
- M. Manso Jimeno, J. Vaughan, and S. Geethanath, “Off-resonance CorrecTion OPen soUrce Software (OCTOPUS),” J. Open Source Softw., vol. 6, no. 59, p. 2578, 2021.
- S. Whitfield-Gabrieli and A. Nieto-Castanon, “Conn: A Functional Connectivity Toolbox for Correlated and Anticorrelated Brain Networks,” Brain Connect., vol. 2, no. 3, pp. 124–141, 2012.
- M. E. Raichle, A. M. MacLeod, A. Z. Snyder, W. J. Powers, D. A. Gusnard, and G. L. Shulman, “A default mode of brain function,” Proc. Natl. Acad. Sci. U. S. A., vol. 98, no. 2, pp. 676–682, 2001.
- K. Murphy, J. Bodurka, and P. A. Bandettini, “How long to scan? The relationship between fMRI temporal signal to noise ratio and necessary scan duration,” Neuroimage, vol. 34, no. 2, pp. 565–574, 2007.
Figures