2684
Data-driven heatmap clustering approach to analyzing structural connectomes1Diagnostic Imaging, St. Jude Children's Research Hospital, Memphis, TN, United States, 2Psychology, St. Jude Children's Research Hospital, Memphis, TN, United States
Synopsis
Heatmap differences between 336 patients treated for ALL and 59 age-similar controls were calculated for a limited set of reproducible edges and clustered using an agglomerative hierarchical clustering that identified four clusters with unique connectivity. Differences in edges demonstrated patterns of lower (group 2), higher (group 4), or mixed (group 1 & 3) connectivity relative to controls. Neurocognitive performance was substantially below normal on measures of memory (DSF – groups 2 & 3; DSB - group 1; Visual matching – group 2). This data driven approach was able to identify four distinct groups of patients with unique connectivity profiles and cognitive performance.
INTRODUCTION:
One of the challenges of analyzing whole brain structural connectomes is the large number of edges produced. This large number of edges makes comparisons between groups difficult due to the need to correct for multiple comparisons. To address this issue, we present a data-driven analysis approach using heatmaps generated by comparing MRI brain exams between a group of children treated for acute lymphoblastic leukemia (ALL) to age-similar controls, combined with an agglomerative hierarchical clustering to group patients.METHODS:
MRI exams of 336 children treated for ALL were acquired at the end of treatment (age at exam 3.4 – 21.6 years; 190 male, 146 female; 180 standard/high-risk therapy, 156 low-risk therapy). All patients were treated on a chemotherapy-only protocol, Total Therapy Study XVI (NCT00549848). An age-similar healthy control cohort of 59 participants (age 8.2 – 27.2 years; 35 male, 24 female) were also imaged. Neurocognitive data were obtained via protocol assessment for the patient group only. Imaging protocols were approved by the local Institutional Review Board. Written informed consent and/or assent was obtained as appropriate.Anatomic imaging was collected on all subjects using a 3D T1 weighted MPRAGE sequence [TR/TE/TI = 1560/2.75/900 ms] with 1 mm isotropic resolution on a 3.0T whole-body system (Siemens Medical Systems, Iselin, NJ). These isotropic images were processed using the FreeSurfer pipeline (http://surfer.nmr.mgh.harvard.edu/). This method uses both intensity and continuity information from the entire three dimensional MR volume in segmentation and deformation procedures to produce representations of cortical thickness, calculated as the closest distance from the gray/white boundary to the gray/CSF boundary at each vertex on the tessellated surface.1 A combined volumetric and surface-based registration is used to bring multimodal parcellations (HCP_MMP1.0) back into patient space as seeds and targets for tracking.2 Low resolution DTI data was acquired with 12 directions and a spatial resolution of 1.8x1.8x3.0 mm [TR/TE = 6500/100 ms; b=0, 700 s/mm2]. Some of the later patient exams were acquired with a multi-band EPI sequence with two reverse blip acquisitions and 64 directions (TR/TE = 4000/77.4 ms; MB, 4; resolution 1.8 x 1.8 x 1.8 mm; b = 1500 s/mm2). This data was resampled down to match the lower resolution 12 direction data. Diffusion data were processed with the MRtrix3 Software (http://www.mrtrix.org/).3
The two-dimensional connectivity matrices were converted into one-dimensional (1D) vectors that included the upper half of the symmetrical triangular matrix. A limited set of 1,368 reproducible edges were identified as having a connectivity strength of greater than 0.1 for at least 90% of patients and 90% of controls. For each of these edges, a linear regression of connectivity and age was generated for the controls and used as a reference for the patients. Subtracting the fitted control connectivity value from the patient value produced a difference for each edge where a negative value represented decreased connectivity relative to the age-similar control model. The 1D vector of these differences were generated for each patient and an agglomerative hierarchical clustering was performed along the columns of patients using the Euclidian distance metric and Ward’s minimum variance linkage method (Figure 1). Patient clusters were then characterized for demographic, treatment, and neurocognitive performance. Circos plots and glass brain networks were used to visualize the edges with differences outside ± 2 standard deviations.
RESULTS:
The heatmap and corresponding clusters are shown in Figure 1 where green represents edges where the patient connectivity is greater than the age-similar control and red where it is less. The yellow (group 1) and red (group 3) clusters (colored bars under dendrogram) demonstrated mixed edges with both greater and less connectivity. The blue (group 2) cluster of patients has predominantly lower connectivity, while the magenta (group 4) cluster of patients has predominantly higher connectivity. Connections with the largest differences are visualized in Figure 2. Patient demographic and treatment characteristics are demonstrated in Figure 3, while neurocognitive performance characteristics are shown in Figure 4.DISCUSSION:
Visualizing the connections with the largest differences in Figure 2 revealed some consistency of edge connections between the groups. The most striking observation is that the edges with the most decreased connectivity relative to controls were predominantly in frontal/prefrontal regions, while those with the most increased connectivity were predominantly in the occipital/temporal regions. This relationship should be further investigated.As demonstrated in Figure 3, there were no substantial differences in age or risk arm between the groups, but group 2 (blue) was predominantly male, while group 4 (magenta) was predominantly female. Neurocognitive performance (Figure 4) was substantially below normal on measures of working memory and processing speed (Digit Span Forward (DSF) – groups 2 & 3; Digit Span Backward (DSB) - group 1; and Visual matching – group 2). It is interesting to note that Group 3 had the most edges with large differences in the connectivity pattern, and this group also had the lowest mean performance on DSF and was one the youngest on average, which is interesting from a risk factor perspective.
CONCLUSION:
This data driven approach was able to identify 4 distinct groups of patients with unique connectivity profiles relative to age-similar controls that differed in demographics and cognitive performance.Acknowledgements
We gratefully acknowledge the valuable contributions of Rhonda Simmons and Kathy Jordan, advanced signal processing technicians, and funding in part by the Cancer Center Support Grant P30 CA-21765 and R01 CA90246 (WER) from the National Cancer Institute, and ALSAC.References
1. Fischl B, Dale AM. Measuring the thickness of the human cerebral cortex from magnetic resonance images. Proc Natl Acad Sci U S A. 2000;97: 11050-11055.2. Glasser MF, Coalson TS, Robinson EC, et al. A multi-modal parcellation of human cerebral cortex. Nature. 2016;536: 171-178.
3. Song R, Glass JO, Reddick WE. Modified Diffusion Tensor Image Processing Pipeline for Archived Studies of Patients With Leukoencephalopathy. J Magn Reson Imaging. 2021;54: 997-1008.
Figures
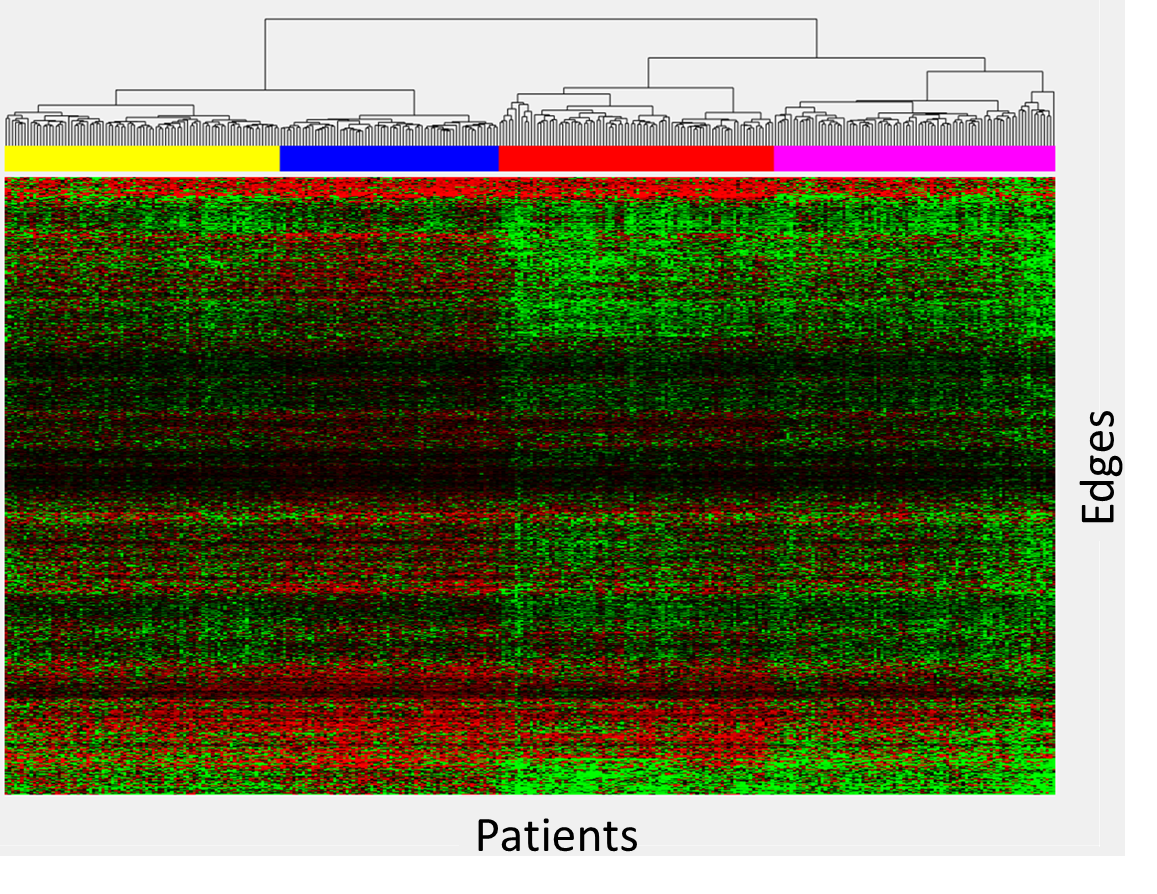
Figure 1: Heatmap of connectivity difference of patients relative to age-similar controls. Each column represents one patient, and each row represents a single edge. Clustergrams are shown at the top with corresponding groups indicated by color bars. A negative value for an edge indicates decreased connectivity relative to the age-similar control and is color coded red, while increased connectivity for an edge is color coded green.
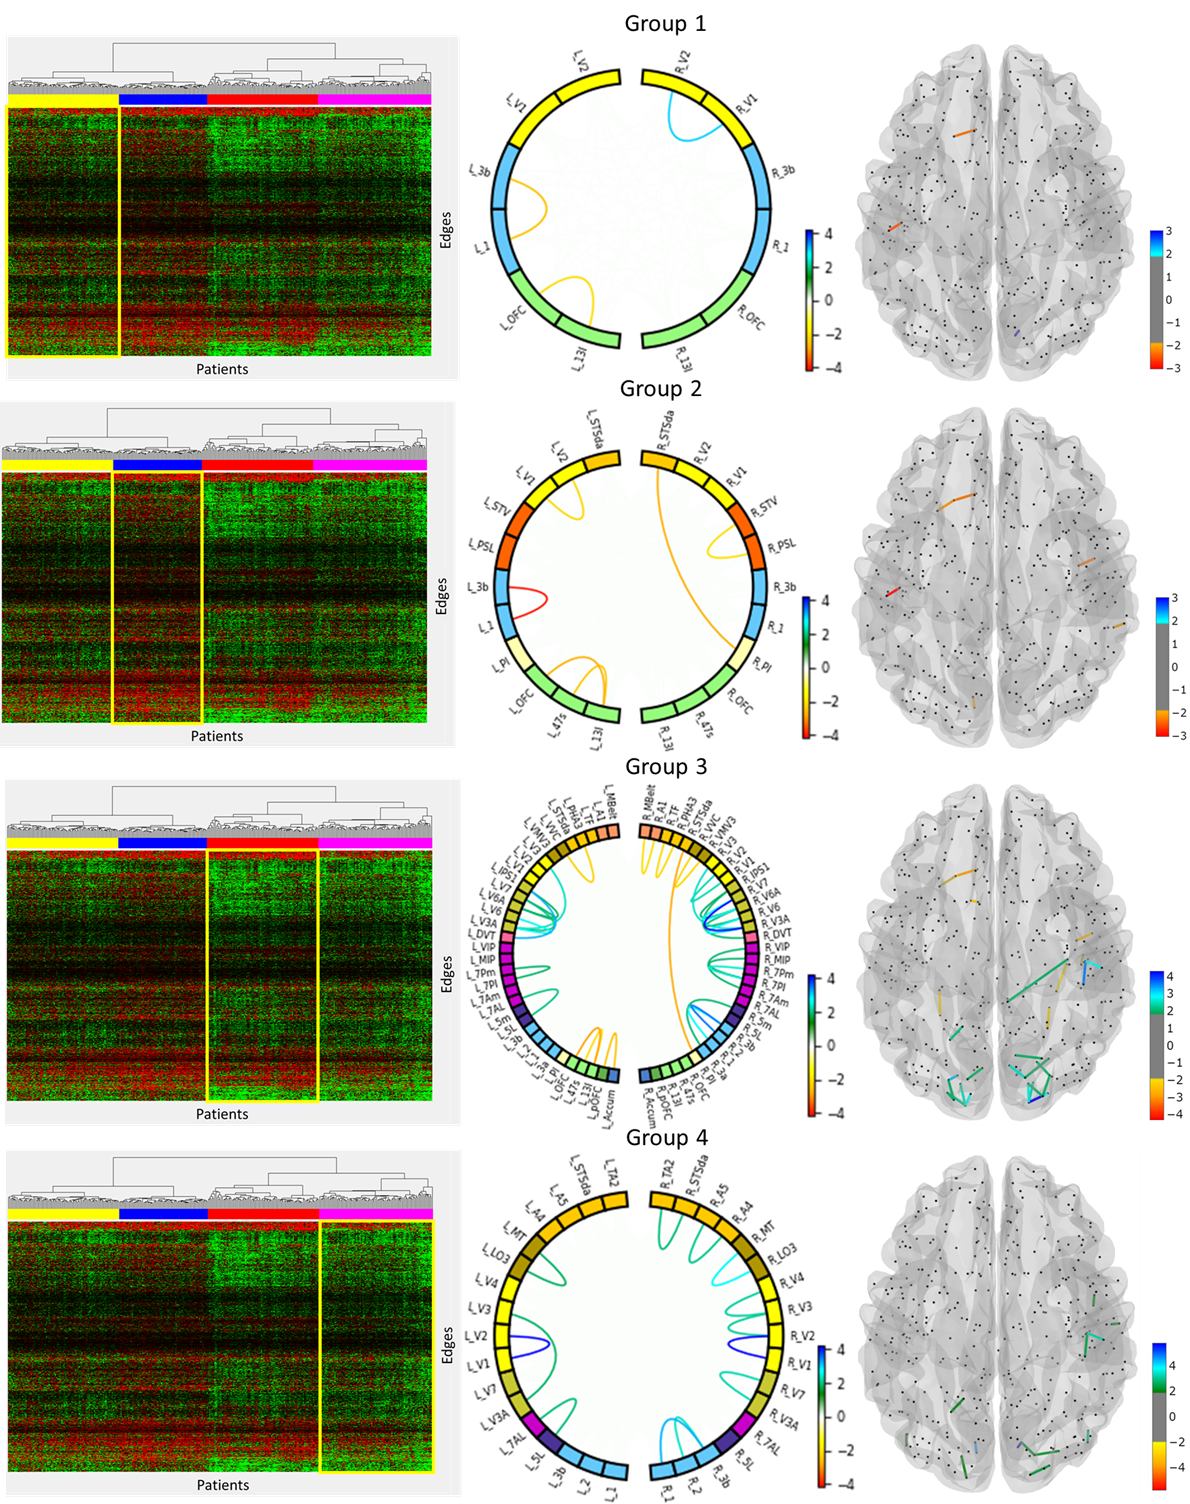
Figure 2: Visualization of edges with differences deviations relative to controls outside ± 2 standard deviations. Circos plots and glass brain networks were used to demonstrate edges with less connectivity (red/orange) or increased connectivity (blue/green).
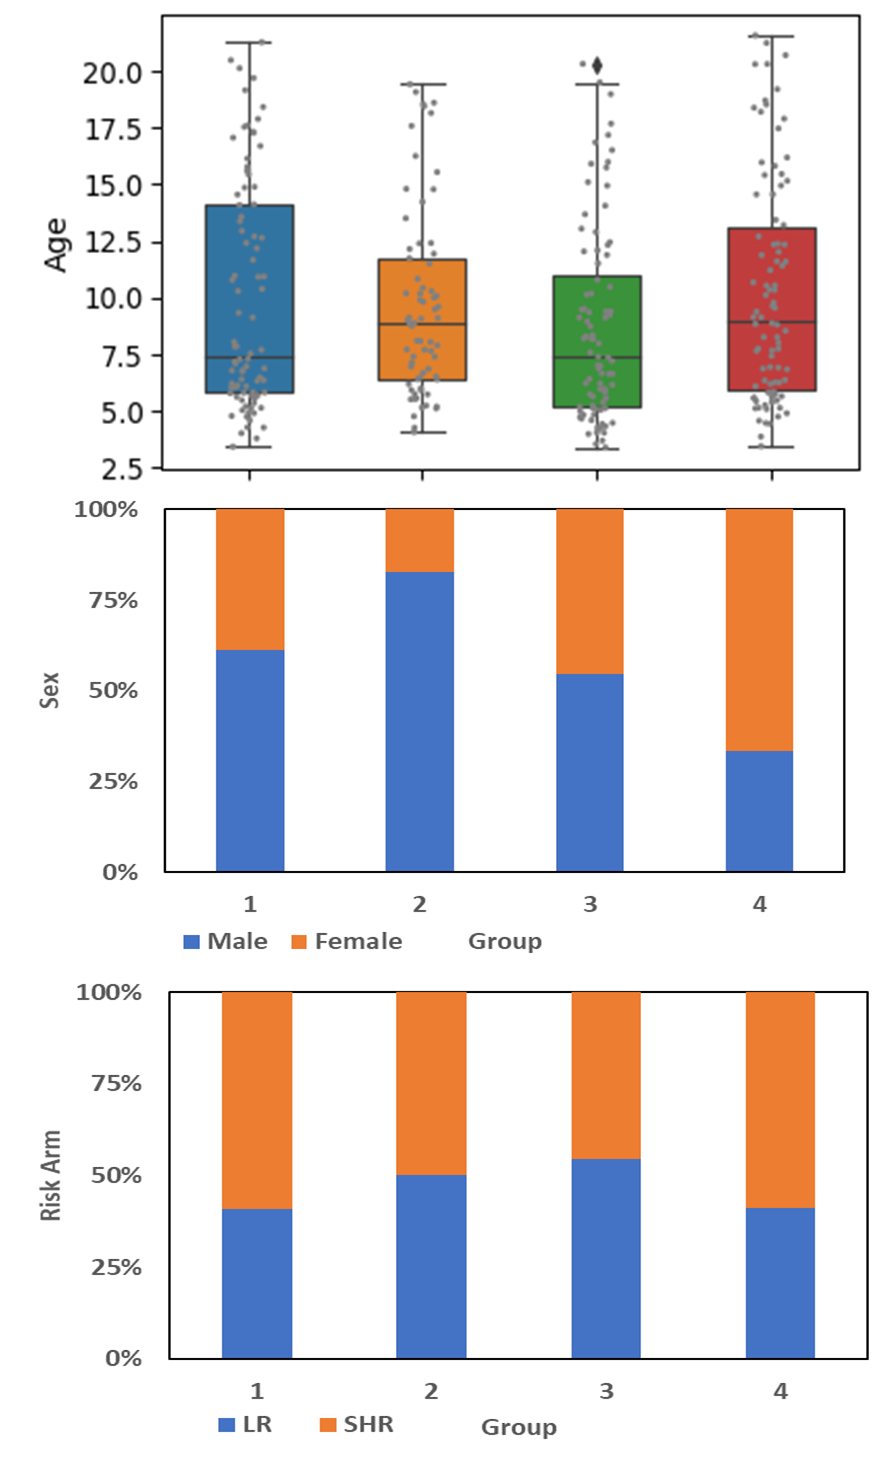
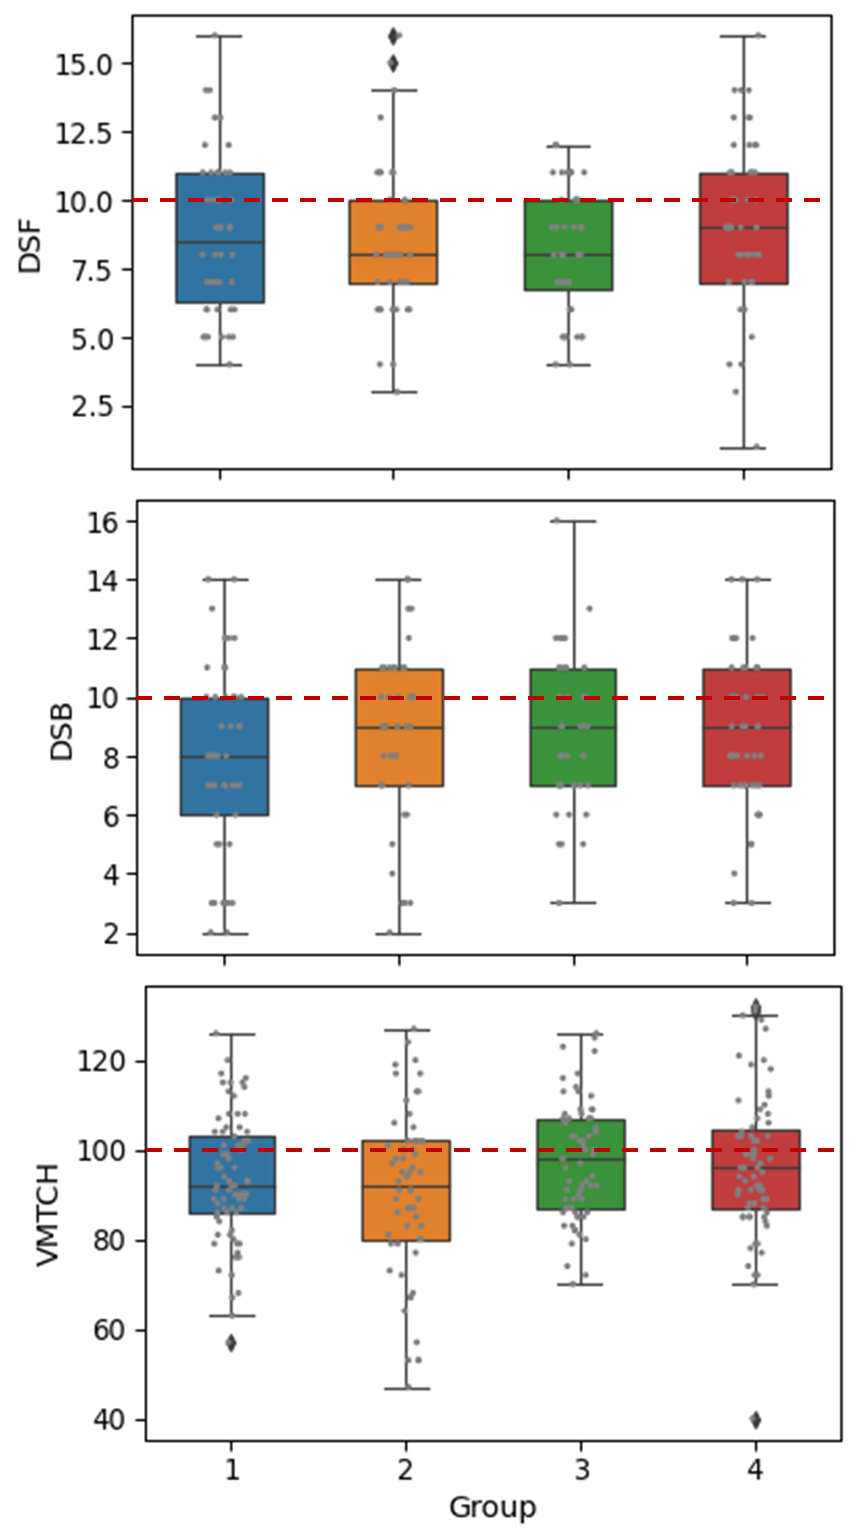
Figure 4: Neurocognitive performance on measures of working memory and processing speed is demonstrated by group. Measures included Digit Span Forward (DSF) and Digit Span Backward (DSB) from the age-appropriate Wechsler scale and Visual Matching (VMTCH) from the Woodcock Johnson Tests of Achievement, Third Edition. These are age adjusted standardized scores and the expected population mean is indicated by the horizontal line on each graph.