2683
Quality control and nuisance regression of fMRI, looking out where signal should not be found
Céline Provins1, Christopher J. Markiewicz2, Rastko Ciric2, Mathias Goncalves2, Cesar Caballero-Gaudes3, Russell A. Poldrack2, Patric Hagmann1, and Oscar Esteban1
1Radiology, Lausanne University Hospital and University of Lausanne, Lausanne, Switzerland, 2Department of Psychology, Stanford University, Stanford, CA, US, Stanford, CA, United States, 3Basque Center on Cognition, Brain and Language, Donostia, Spain, Donostia, Spain
1Radiology, Lausanne University Hospital and University of Lausanne, Lausanne, Switzerland, 2Department of Psychology, Stanford University, Stanford, CA, US, Stanford, CA, United States, 3Basque Center on Cognition, Brain and Language, Donostia, Spain, Donostia, Spain
Synopsis
Quality control of functional MRI data is essential as artifacts can have a critical impact on subsequent analysis. Yet, visual assessment of a dataset is tedious and time-consuming. By extending the carpet plot with the voxels located on a closed band (or “crown”) around the brain, we showed that fMRI data quality can be assessed more effectively. This new feature has been incorporated into MRIQC and fMRIPrep. In addition, a new nuisance regressor has been added to the latter, calculated from timeseries within this new “crown”.
Introduction
Functional MRI (fMRI) may be degraded by a multitude of artifacts, notably respiratory, scanner, and motion-related. Since such distortions often have a critical impact on subsequent image processing and analysis1–3, it is essential to assess data quality and to ensure that preprocessing correctly accounts for those artifacts. Visually assessing every image in a dataset is tedious and time-consuming. Thus, it requires appropriate protocols and tools to make the quality assessment efficient and more consistent between raters. Contributing to this effort, Power4 developed the so-called “carpet plot”, a visualization tool providing a compact and comprehensive representation of an fMRI scan. Identifying sources of non-neural signals is also critical for reliable statistical modeling. Patriat et al.5 showed that nuisance regressors extracted from voxels located on a closed band (or “crown”) around the brain (see Fig. 1) improves motion regression. In this work, we combine these two ideas and show that extending the carpet plot with the crown results in a more efficient assessment of BOLD (blood-oxygen level-dependent) fMRI scans. The “royal carpet plot” (so called for inclusion of the crown) has been implemented in MRIQC6 and fMRIPrep7. Furthermore, the fMRIPrep confound outputs have been enriched with the crown-based nuisance regressors.Methods
For the implementation of both the royal carpet plot and the crown-regressors, the first step is to delineate the crown region. We follow the procedure by Patriat et al.5 of subtracting a brain mask from its inflated counterpart. Figure 1 displays the crown mask for a representative subject.The carpet plot is a two-dimensional heatmap of timeseries where the x-axis represents time and the y-axis corresponds to voxels. The original version contains only voxels from inside the brain4, and we extend it with voxels within the crown mask. The voxels are grouped by regions identifiable thanks to a colorbar paired with a legend. Each regional block is furthermore reordered such that voxels with similar BOLD dynamics are placed close to one another. This is done using Ward’s hierarchical clustering on Euclidean distances between pairs of z-scored time-series. This reordering follows the method developed by Aquino et al.8 to reveal non-global structures present in the fMRI signal.
Leveraging the crown mask, fMRIPrep was furthermore extended to calculate crown-regressors. These regressors reuse the existing implementation of anatomical CompCor9 within fMRIPrep, thereby generating regressors corresponding to the 24 first principal components extracted from principal component analysis on the crown voxels time series5.
The royal carpet plots displayed in the results are extracted from two independent open datasets available on OpenNeuro10 : ds00000511 and ds00003012.
Results
The royal carpet plot helps evaluate scan quality in a way that would not be possible in the absence of the crown. This section illustrates this for two instances.Figure 2 shows the royal carpet plot for two representative subjects undergoing a breath holding task, in which the instructions were to alternate between holding breath and breathing regularly while resting. The two respiration regimes are distinguishable as alternating light and dark voxel patches across time. This modulation is not visible in the crown for a low motion subject (cf fig.2. left), but it is in a high motion subject (cf fig.2. right).
Figure 3 displays a representative royal carpet plot in which the dark bands visible in the GM spill over in the WM, but not in the crown.
In addition to the royal carpet plot, we implemented in fMRIPrep the crown-regressors. The top 3 crown-regressors for a representative subject can be visualized on Figure 4.
Discussion
Royal carpet plots help assess fMRI data quality effectively. The crown’s advantage is that it contains only voxels from which we do not expect (in principle) any signal, as they lie outside the brain. At the same time, the crown contains voxels that are close enough to the brain to capture artifactual signal arising from, e.g. large head movements or signal spill-outs. As a consequence, the crown is a good region to observe in order to evaluate scan quality.In a breath holding task, it is expected that holding one’s breath modulates the fMRI signal within GM differently than breathing freely, given the BOLD dependence on the oxygenation level of the blood. Because the crown is not vasculated, the presence of breath modulation patterns there can be interpreted as a sign of low quality, likely due to motion.
Furthermore, the crown presents the advantage over the white matter (WM) that it is minimally confounded by partial volume effects. Mapping the WM cluster displaying the dark bands into the brain confirms that this signal spill is due to partial volume effects, as those voxels lay indeed at the interface with GM.
We have also implemented the regressors proposed by Patriat et al., effectively expanding the confounding factors provided by fMRIPrep. The signal in the crown-regressors presents a sharp deflection when a large head movement occurs. This goes in the direction that the latter capture motion-related artifacts5.
Conclusion
In this work, we showed how integrating the crown in the carpet plot enables faster assessment of fMRI scan quality. Moreover, we extended MRIQC and fMRIPrep to equip researchers with the two new features.Acknowledgements
This work has been supported by the NIMH (RF1MH121867; RAP, OE). CP, and OE receive support from the SNSF Ambizione Project “Uncovering The Interplay Of Structure, Function, and Dynamics of Brain Connectivity using MRI” (grant number PZ00P2_185872).Figures
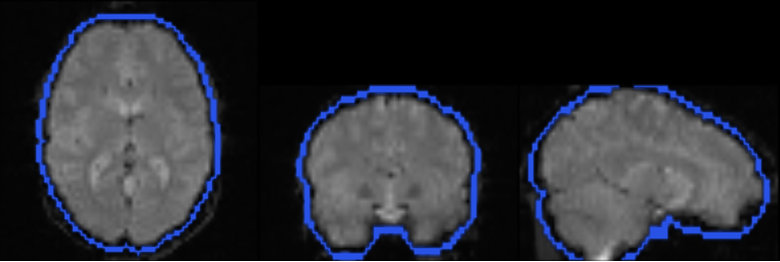
Fig.
1. The
crown mask (in blue) for a representative subject overlaid on the BOLD
image.
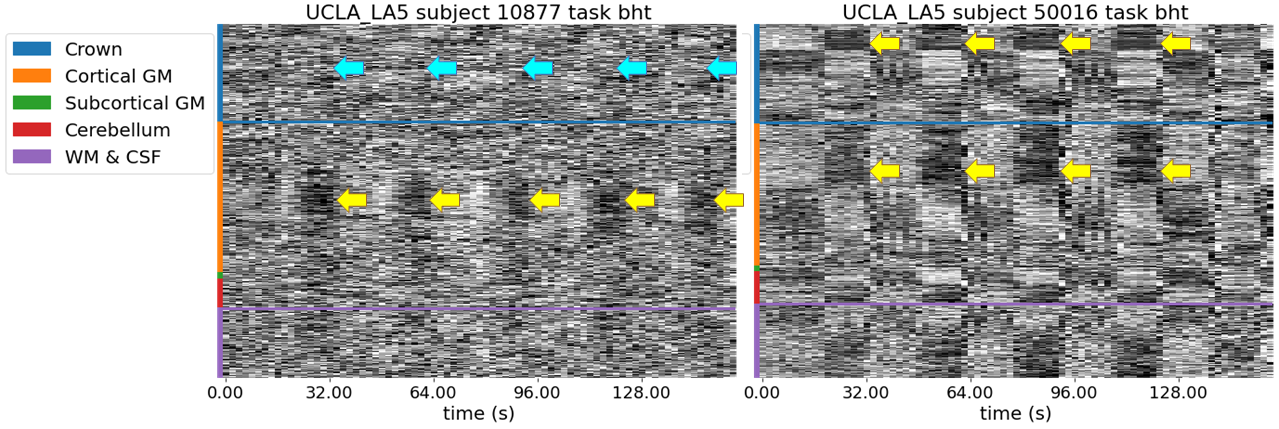
Fig. 2. The royal carpet plot enables differentiation of good and bad quality scans by the presence or absence of breath modulation in the crown during a breath holding task (bht). The yellow arrows point to visible dark signal deflections corresponding to a different respiration regime. The blue arrows designate that the signal deflections are not visible in the crown, therefore indicating a good quality scan, contrary to the scan on the right.
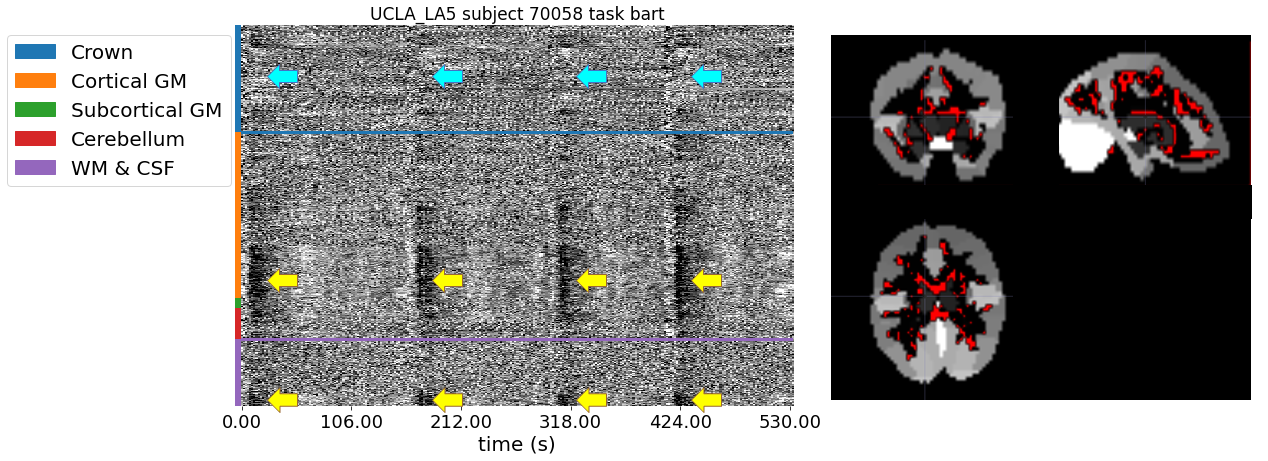
Fig. 3. The crown, unlike the white matter (WM) and cerebrospinal fluid (CSF) mask, is only minimally confounded by partial volume effect. The dark bands present in GM are visible in the WM as well, but not in the crown. On the right, the mask of the WM cluster displaying the dark bands (in red) is overlaid on top of the anatomical segmentation (grey tons correspond to GM). Since this mask fall close to the boundary with GM, this confirms that this signal spill is due to partial volume effects.
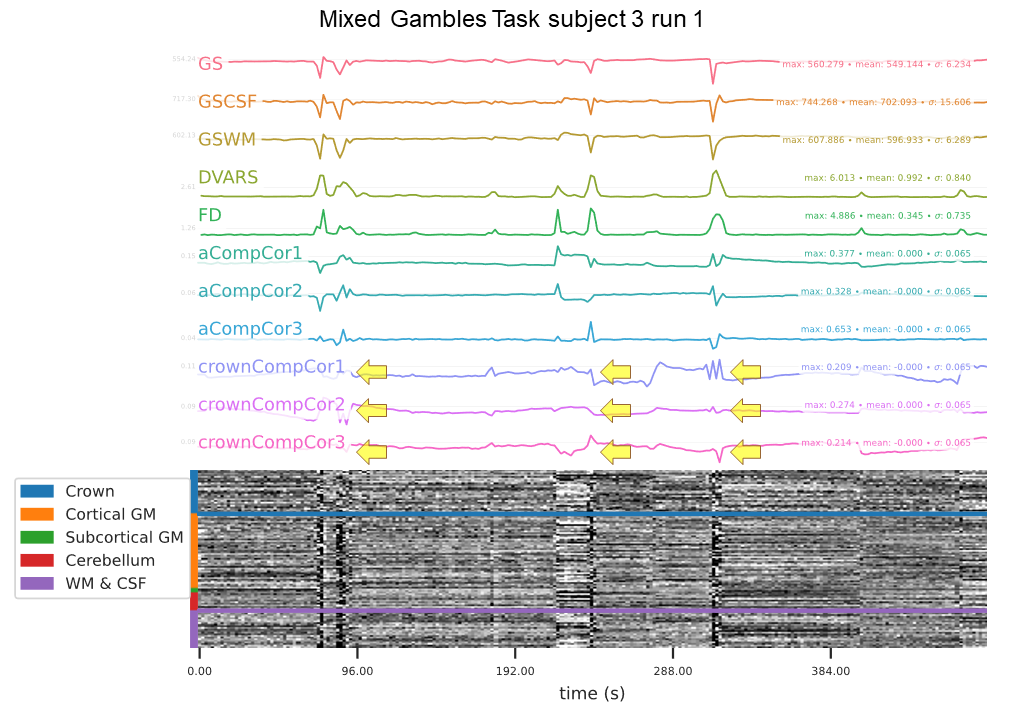
Fig. 4. In addition to the global signals and motion measures, the top 3 principal components of anatomical CompCor (aCompCor) as well as the top 3 crown-regressors are plotted on top of the royal carpet plot in the fMRIPrep visual report. When a large head movement occurs, identifiable by both a vertical disruption in the royal carpet plot and a peak in the motion measures DVARS and FD, the crown-regressors also present a sharp deflection (as pointed out by the yellow arrows).
DOI: https://doi.org/10.58530/2022/2683