2682
SANDIAMICO: an open-source toolbox for Soma And Neurite Density Imaging (SANDI) with AMICO1Department of Computer Science, University of Verona, Verona, Italy, 2Department of Neuroscience, Rehabilitation, Ophthalmology, Genetics, Maternal and Child Health (DINOGMI), University of Genoa, Genoa, Italy, 3CNRS, Inria, Inserm, Univ Rennes, Rennes, France, 4Centre for Medical Image Computing (CMIC), Department of Computer Science, University College London, London, United Kingdom, 5Cardiff University Brain Research Imaging Centre (CUBRIC), School of Psychology, Cardiff University, Cardiff, United Kingdom, 6School of Computer Science and Informatics, Cardiff University, Cardiff, United Kingdom
Synopsis
The soma and neurite density imaging (SANDI) model has been recently introduced to estimate diffusion MRI indices of apparent neurite and soma density noninvasively in the brain. Here, we introduce SANDIAMICO a fast (10 seconds for whole brain images) and robust implementation for estimating SANDI parameters using the Accelerated Microstructure Imaging via Convex Optimization (AMICO) framework. Using numerical simulations and in vivo human data, we show excellent performances of SANDIAMICO in terms of accuracy, precision, robustness to noise and intra-subject reproducibility.
Introduction
Over the last decades, many microstructural models and signal representations have been proposed to infer brain tissue microstructure from the diffusion-weighted MRI (dMRI) signal1,2. The soma and neurite density imaging (SANDI) model3 has been recently proposed to estimate MRI indices of apparent neurite and soma density noninvasively in the brain. However, the estimation of these parameters from dMRI measurements is challenging4 and time consuming when using conventional fitting methods based on non-linear least square (NLLS) minimization.To overcome this issue, we propose SANDIAMICO: a new implementation of SANDI inside the Accelerated Microstructure Imaging via Convex Optimization (AMICO5) framework. We demonstrate the performance of SANDIAMICO in simulations and in vivo dMRI data from MICRA dataset6. The SANDIAMICO toolbox is available at https://github.com/daducci/AMICO.
Methods
SANDI. The SANDI model assumes that soma (neuronal and glial cell bodies) and neurites (axons, dendrites, and glial processes) can be approximated as two non-exchanging compartments, modeled as sphere of certain size and cylinders of zero radius (“sticks”), respectively. Under these assumptions, the normalized direction-averaged dMRI signal ($$$S_{avg}$$$) can be expressed as:$$\frac{S_{avg}(b)}{S(0)}=f_{neurite}S_{neurite}(b,D_{in})+f_{soma}S_{soma}(b, D_{soma},R_{soma})+(1-f_{neurite}-f_{soma})S_e(b,D_e)$$
where $$$f_{neurite}$$$ is the neurite signal fraction, $$$D_{in}$$$ the intra-neurite axial diffusivity; $$$f_{soma}$$$ the soma signal fraction, $$$R_{soma}$$$ the apparent soma radius, $$$D_{soma}=3$$$μm2/ms and $$$D_e$$$ the extra-cellular diffusivity3. $$$S_{neurite},S_{soma}$$$ and $$$S_{e}$$$ are the dMRI signals of each compartment, computed as in 3.
SANDIAMICO rewrites Eq.(1) as linear system Ax=y, where A is a matrix containing simulated signals (i.e., dictionary of response functions) of each compartment, y is the vector of measured signals, and x the unknown contributions. In general, how we build the matrix A impacts the results of the estimated model parameters7, hence the design of A must be taken carefully. Here we propose a data-driven approach for the design of an optimal dictionary, given a dMRI acquisition and the SANDI model. Specifically, we propose to construct a matrix A with minimized mutual coherence; the number of columns for each compartment is therefore adapted to the sensitivity of the signal response to the respective microstructure parameters8. The elements of x are then estimated using a non-negative least square with Tikhonov regularization. A graphical representation of this pipeline is reported in Figure 1.
We used both analytical simulations and in vivo human data to compare the performance of AMICO with and without dictionary optimization and NLLS estimations under controlled and real conditions, respectively.
Simulations We generated 10,000 different synthetic signals using random combinations of the SANDI model parameters and Eq.(1), according to the MICRA acquisition protocol6 and adding Gaussian noise with SNR=100, similar to the data. We varied:
- $$$f_{neurite},f_{soma}\in[0,1]$$$
- $$$D_{in}, D_{e}\in[0.25,3]$$$µm2/ms
- $$$R_{soma}\in[0,12]$$$µm.
In vivo data We tested the quality of the fitting against common knowledge of the cytoarchitectonics of the Brodmann’s areas using two human subjects from the MICRA dataset6, acquired twice on a 3T Siemens Connectom scanner with b=0,0.2,0.5,1.2,2.4,4,6ms/μm2 and respectively 11, 20, 20, 30, 61, 61, and 61 gradient directions; TE/TR=59/3000ms; δ/Δ=7/25ms, resolution 2×2×2mm3. Although not optimal, MICRA satisfies most of SANDI’s applicability assumptions3.
For both scans of each subject, we preprocessed the dMRIs using a combination of FSL10, MRtrix311 and DESIGNER12 pipelines following these steps: denoise13, degibbs14, Rician bias correction12, movement artifacts and susceptibility induced distortions removal15–17, B1-bias correction18. We used Freesurfer19 to project the parameters maps estimated by SANDIAMICO onto the midpoint cortical surface.
Results and Discussion
Table 1 reports the results obtained on simulations for the optimal lambda found in Figure 2. For both choices of SNR, SANDIAMICO with optimization of the dictionary outperforms the other two methods. Moreover, as expected, AMICO in general shows higher robustness to noise with only minimal loss in accuracy (i.e., higher mse and bias at SNR=100) compared to NLLS. Finally, SANDIAMICO is over 30x faster than NLLS: fitting time 2 seconds versus 60 seconds.Figure 3 reports the maps fitted for the two scans of the two subjects of the MICRA’s dataset. From the axial slices we do not observe major differences between scans. We also report the normalized distribution plots of each metric with the two scans drawn with different colors. We appreciate that for both subjects, the two curves almost completely overlap for all the metrics, suggesting high repeatability. Moreover, the overall pattern is similar among the subjects and confirms the inter-subject variability previously observed20. We also highlight that for each scan, the fitting of the whole brain (~233000 voxels) done by SANDIAMICO required only 10 seconds.
Figure 4 reports projections on the cortex of the apparent soma density for the two acquisitions of each subject. On the right we also show the cortex parcellated in Brodmann’s areas. As previously observed3, the variations of $$$f_{soma}$$$ values over the midpoint cortical surface followed the expected cyto-architectonics of several Brodmann’s areas.
Conclusions
We presented SANDIAMICO, an open-source toolbox for the fitting of the SANDI model. We showed that the SANDIAMICO implementation provides fast and robust estimation of SANDI parameters furthering their use in several neuroscience applications.Acknowledgements
We thank the team of the micro2macro event of Brainhack 2020, who helped enhancing AMICO to fit the SANDI model. MP is supported by UKRI Future Leaders Fellowship (MR/T020296/1).
References
1. Novikov DS, Fieremans E, Jespersen SN, Kiselev VG. Quantifying brain microstructure with diffusion MRI: Theory and parameter estimation. NMR Biomed. 2019;32(4):e3998. doi:10.1002/nbm.3998
2. Alexander DC, Dyrby TB, Nilsson M, Zhang H. Imaging brain microstructure with diffusion MRI: practicality and applications. NMR Biomed. 2019;32(4):e3841. doi:10.1002/nbm.3841
3. Palombo M, Ianus A, Guerreri M, et al. SANDI: A compartment-based model for non-invasive apparent soma and neurite imaging by diffusion MRI. Neuroimage. 2020;215:116835. doi:https://doi.org/10.1016/j.neuroimage.2020.116835
4. Afzali M, Nilsson M, Palombo M, Jones DK. SPHERIOUSLY? The challenges of estimating spherical pore size non-invasively in the human brain from diffusion MRI. bioRxiv. 2020. doi:10.1101/2020.11.06.371740
5. Daducci A, Canales-Rodríguez EJ, Zhang H, Dyrby TB, Alexander DC, Thiran J-P. Accelerated Microstructure Imaging via Convex Optimization (AMICO) from diffusion MRI data. Neuroimage. 2015;105:32-44. doi:http://dx.doi.org/10.1016/j.neuroimage.2014.10.026
6. Koller K, Rudrapatna U, Chamberland M, et al. MICRA: Microstructural image compilation with repeated acquisitions. Neuroimage. 2021;225:117406. doi:https://doi.org/10.1016/j.neuroimage.2020.117406
7. Donoho DL, Elad M, Temlyakov VN. Stable recovery of sparse overcomplete representations in the presence of noise. IEEE Trans Inf Theory. 2006. doi:10.1109/TIT.2005.860430
8. Truffet R, Barillot C, Caruyer E. Optimal selection of diffusion-weighting gradient waveforms using compressed sensing and dictionary learning. In: ISMRM 2019 - 27th Annual Meeting \\& Exhibition. Montréal, Canada; 2019:1-3. https://www.hal.inserm.fr/inserm-02015394.
9. Welsch RE. Robust regression using iteratively reweighted least-squares. Commun Stat - Theory Methods. 1977. doi:10.1080/03610927708827533
10. Smith SM, Jenkinson M, Woolrich MW, et al. Advances in functional and structural MR image analysis and implementation as FSL. In: NeuroImage. ; 2004. doi:10.1016/j.neuroimage.2004.07.051
11. Tournier J-D, Smith R, Raffelt D, et al. MRtrix3: A fast, flexible and open software framework for medical image processing and visualisation. Neuroimage. 2019;202:116137. doi:https://doi.org/10.1016/j.neuroimage.2019.116137
12. Ades-Aron B, Veraart J, Kochunov P, et al. Evaluation of the accuracy and precision of the diffusion parameter EStImation with Gibbs and NoisE removal pipeline. Neuroimage. 2018. doi:10.1016/j.neuroimage.2018.07.066
13. Cordero-Grande L, Christiaens D, Hutter J, Price AN, Hajnal J V. Complex diffusion-weighted image estimation via matrix recovery under general noise models. Neuroimage. 2019. doi:10.1016/j.neuroimage.2019.06.039
14. Kellner E, Dhital B, Kiselev VG, Reisert M. Gibbs-ringing artifact removal based on local subvoxel-shifts. Magn Reson Med. 2016. doi:10.1002/mrm.26054
15. Andersson JLR, Graham MS, Zsoldos E, Sotiropoulos SN. Incorporating outlier detection and replacement into a non-parametric framework for movement and distortion correction of diffusion MR images. Neuroimage. 2016;141:556-572. doi:https://doi.org/10.1016/j.neuroimage.2016.06.058
16. Andersson JLR, Sotiropoulos SN. An integrated approach to correction for off-resonance effects and subject movement in diffusion MR imaging. Neuroimage. 2016;125:1063-1078. doi:10.1016/J.NEUROIMAGE.2015.10.019
17. Andersson JLR, Skare S, Ashburner J. How to correct susceptibility distortions in spin-echo echo-planar images: application to diffusion tensor imaging. Neuroimage. 2003;20(2):870-888. doi:https://doi.org/10.1016/S1053-8119(03)00336-7
18. Tustison NJ, Avants BB, Cook PA, et al. N4ITK: improved N3 bias correction. IEEE Trans Med Imaging. 2010;29(6):1310-1320. doi:10.1109/TMI.2010.2046908
19. Fischl B, Salat DH, Busa E, et al. Whole brain segmentation: automated labeling of neuroanatomical structures in the human brain. Neuron. 2002;33:341-355. doi:10.1016/s0896-6273(02)00569-x
20. Genc S, Chamberland M, Koller K, et al. Repeatability of soma and neurite metrics in cortical and subcortical grey matter. bioRxiv. 2020.
Figures
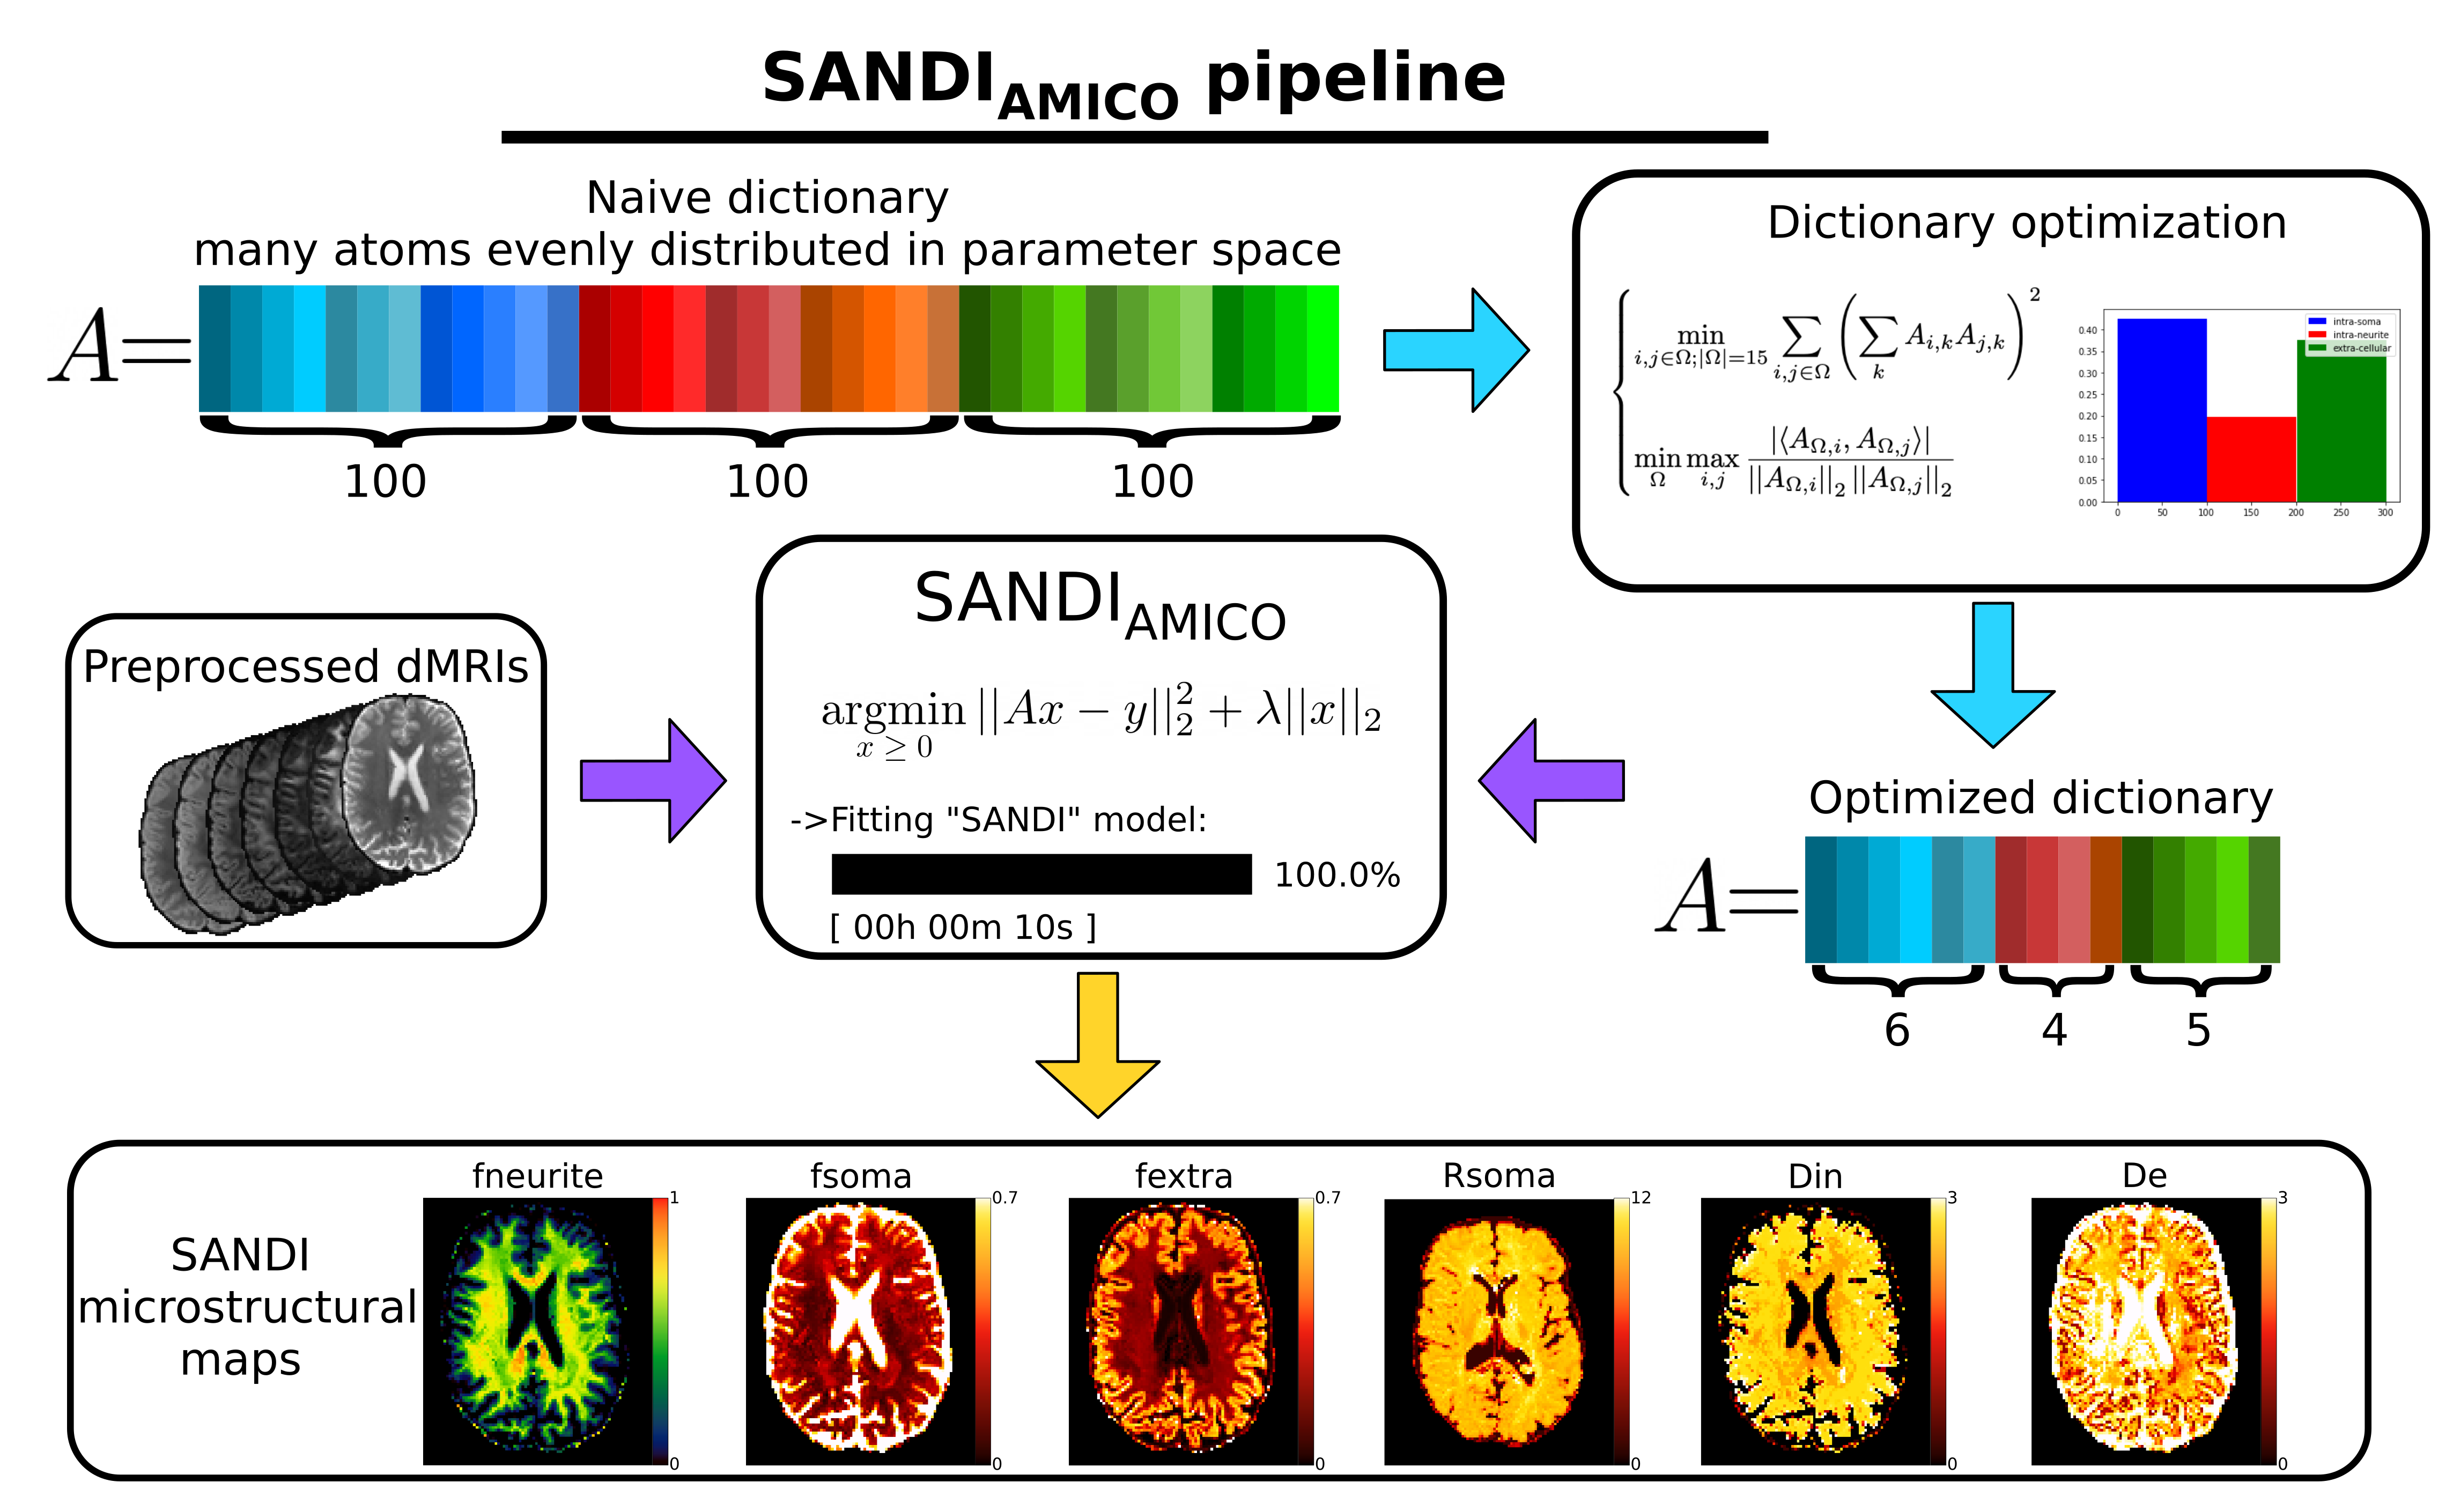
Figure 1: Graphical representation of our pipeline. Starting by a naive dictionary composed by many response functions (atoms) evenly distributed to cover the parameters space, we optimize it minimizing mutual coherence to obtain the exact number of atoms needed to robustly describe each compartment. We then feed the preprocessed dMRIs to SANDIAMICO and recover the SANDI microstructural maps. Diffusivities are reported in μm2/ms, Rsoma in μm.
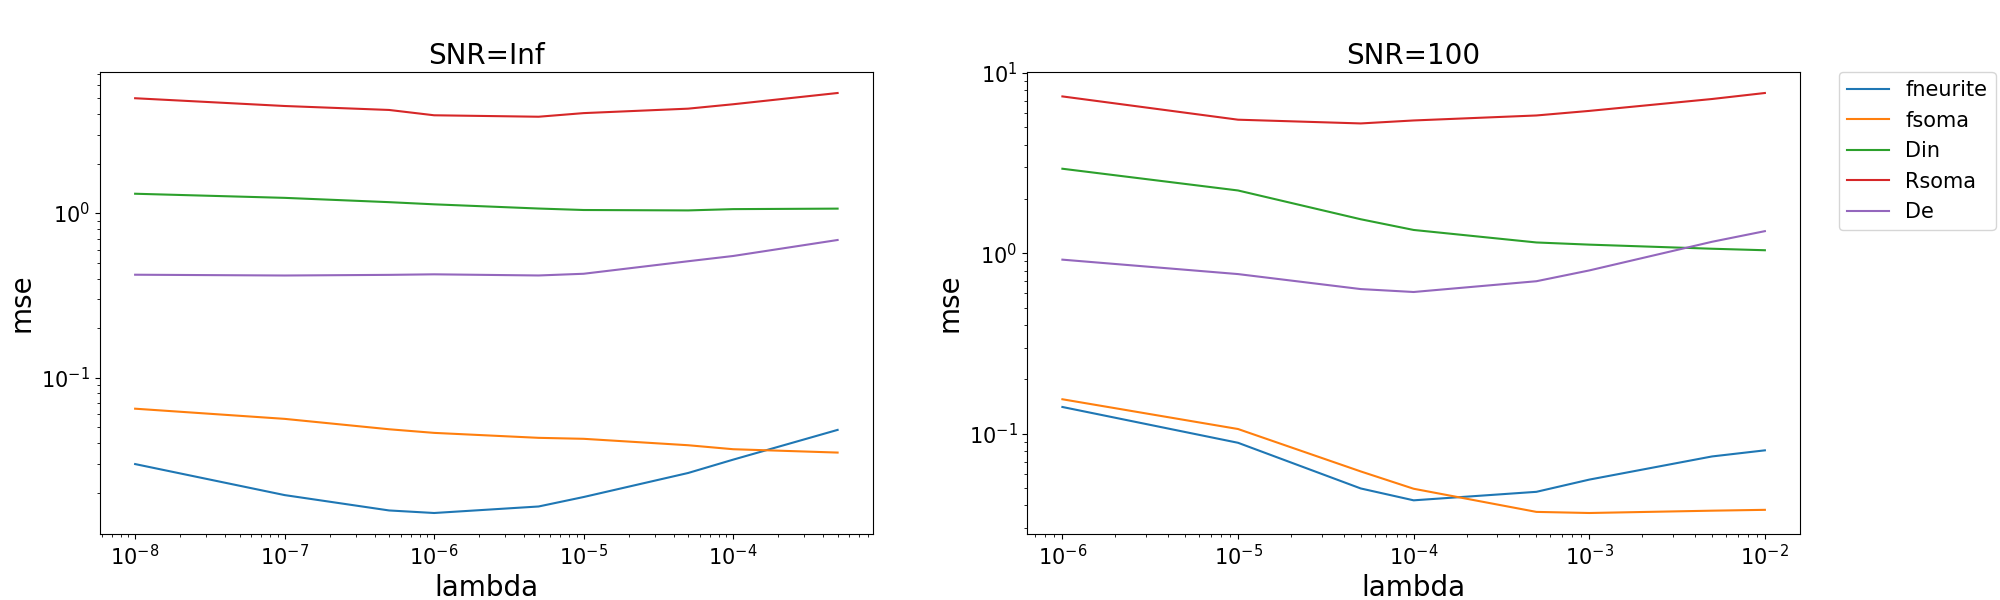
Figure 2: Plots of mean square error (mse) as function of the parameter lambda obtained in the two simulated dataset with SNR=Inf and SNR=100. Based on the behavior of these lines, we set the value of lambda as the one that minimized the mse for more parameters and we compared SANDIAMICO with and without dictionary optimization and the standard NLLS fitting procedure (Table 1). lambda=5E-4 found to be the best in the case of SNR=100 is the one we also used for in vivo analyses.
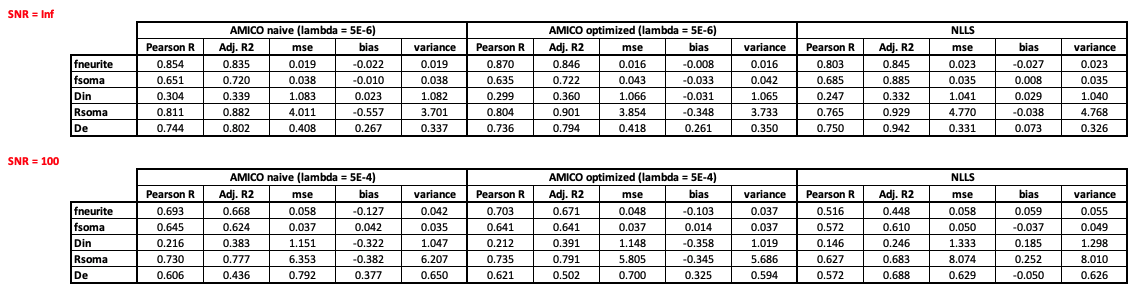
Table 1: Comparison between SANDIAMICO with (AMICO optimized) and without (AMICO naive) dictionary optimization and the standard NLLS fitting procedure in simulations. We report Pearson r, Adjusted R2, mean squared error (mse), bias and variance of the estimated model parameters with the ground-truth values of all methods on synthetic data with SNR=Inf (top) and SNR=100 (bottom).
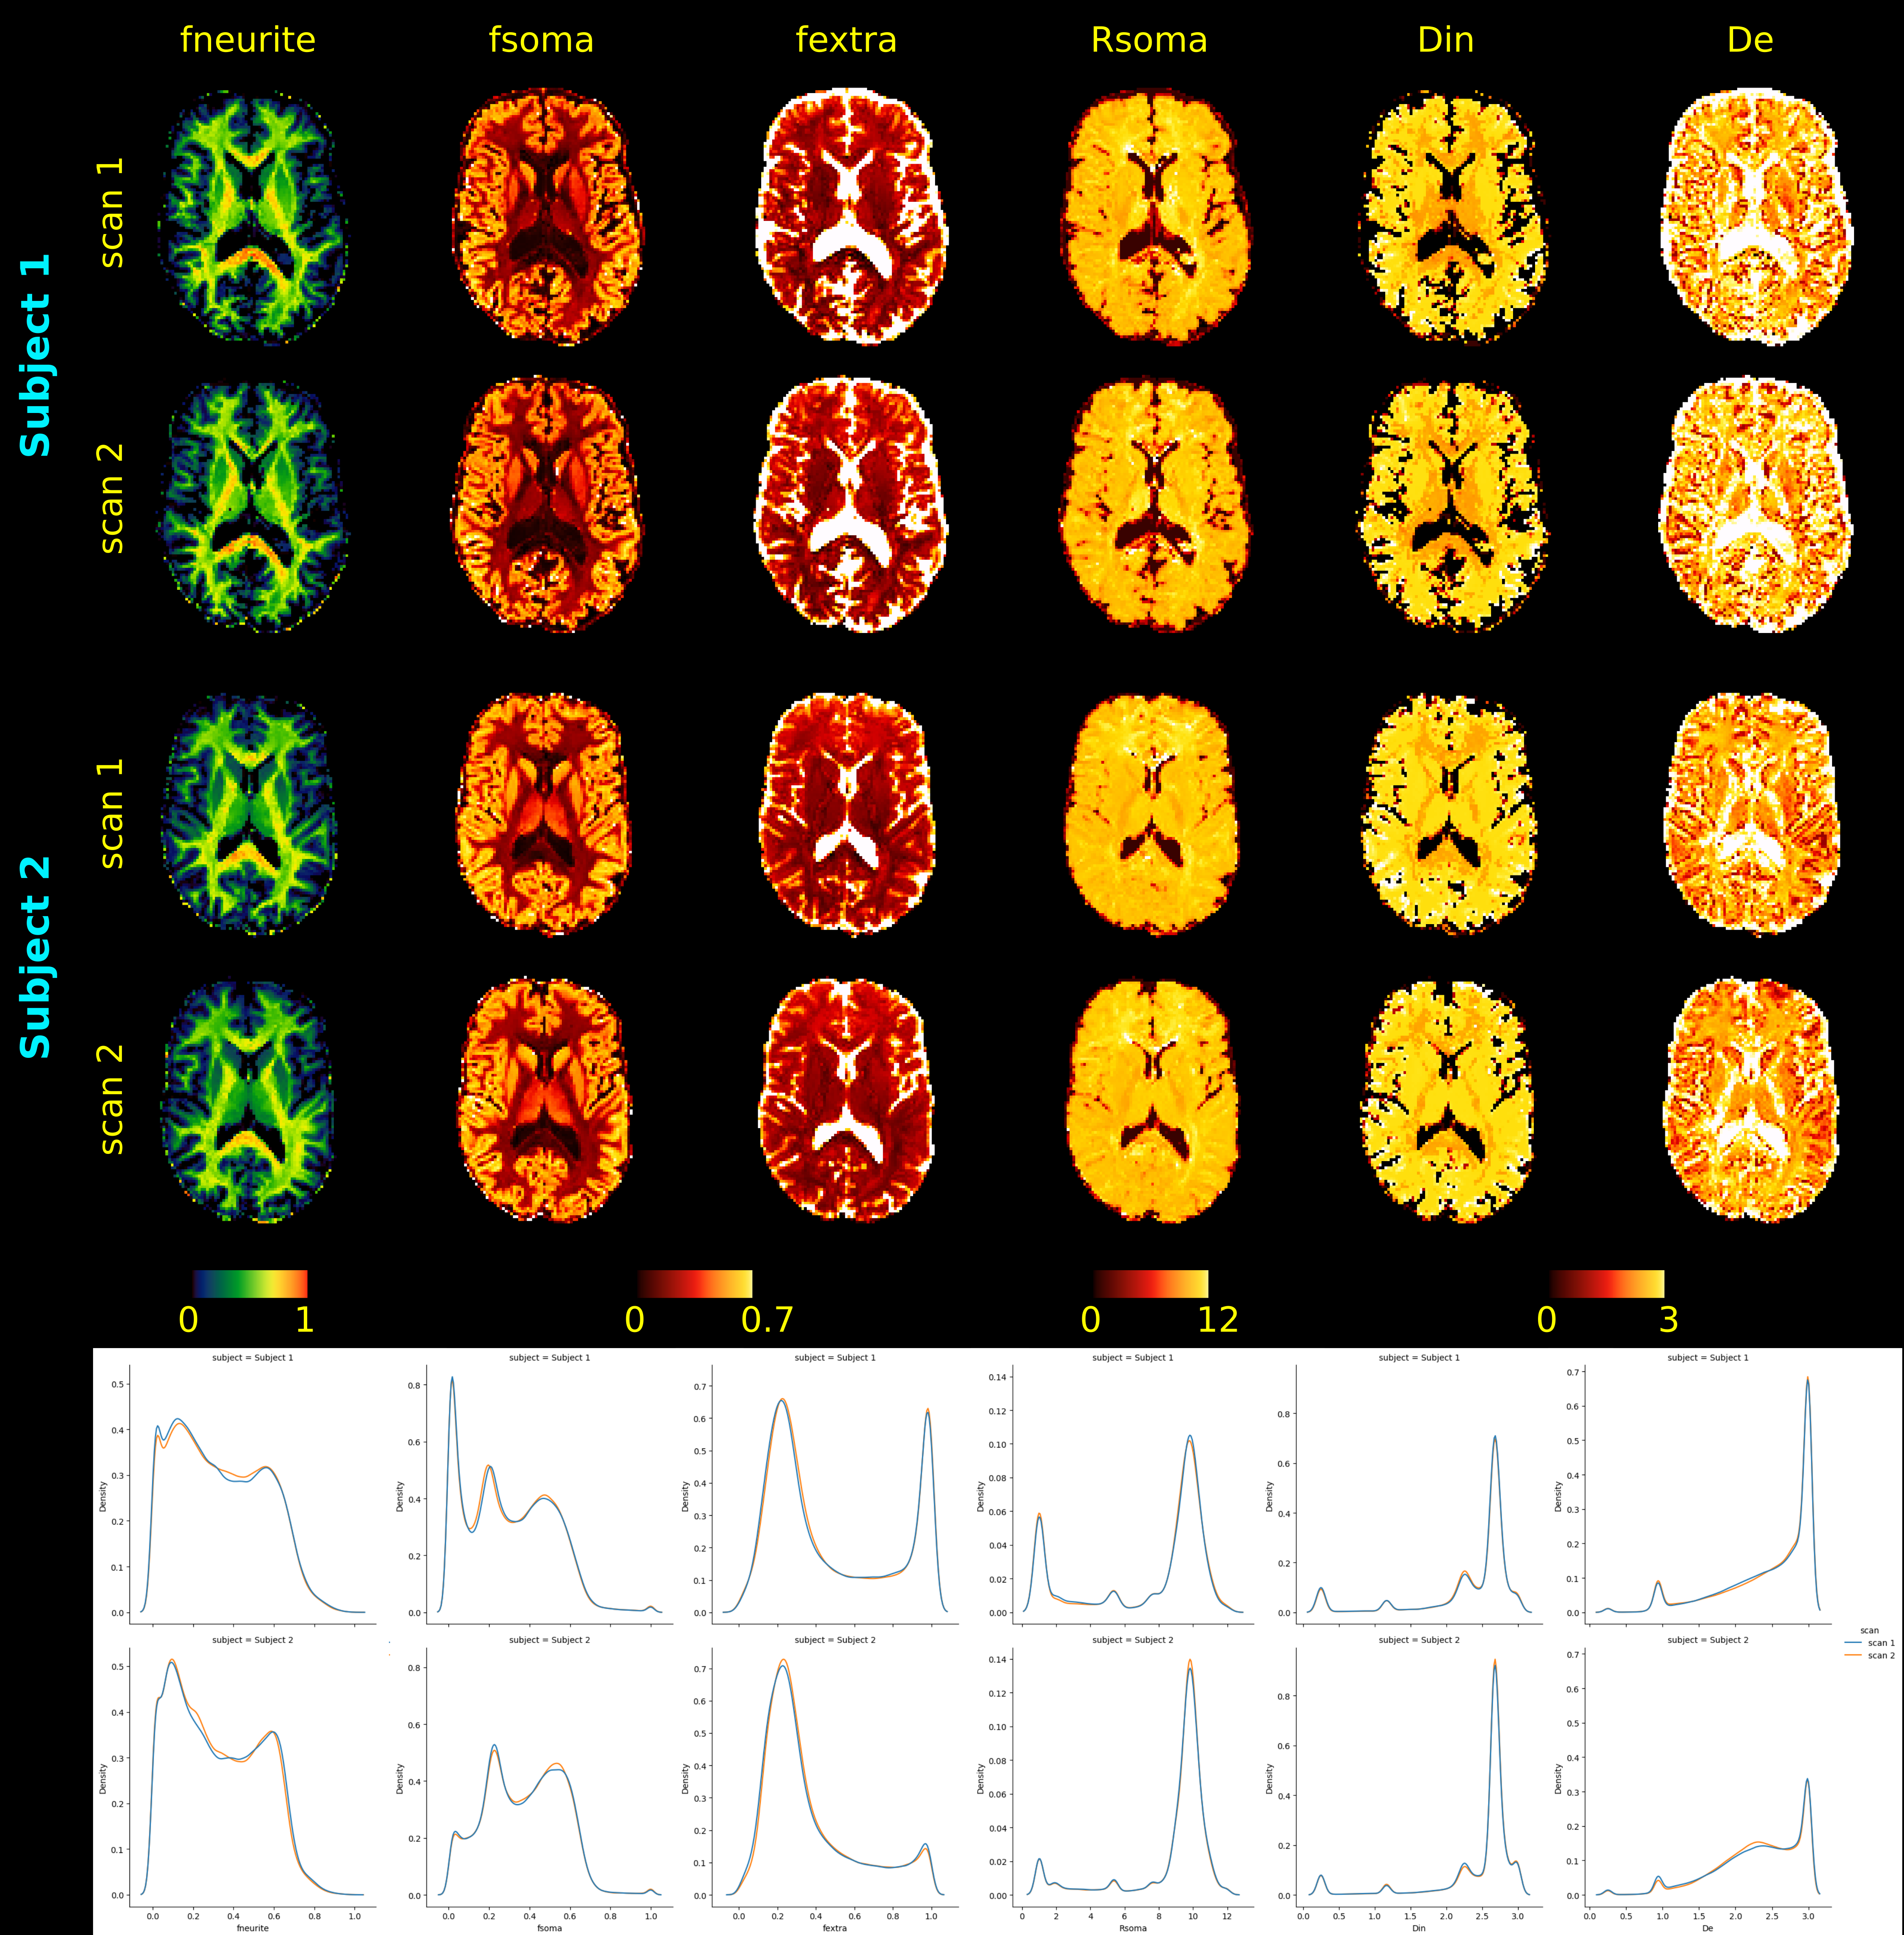
Figure 3: SANDI microstructural maps obtained with the optimized SANDIAMICO on two scans of the first two subjects of the MICRA dataset. On the bottom row, for each subject we also report the normalized distribution plots relative to each metric with the two scans drawn with different colors. For each curve, we clearly distinguish at least two peaks located at the same value for both subjects, that suggest the reasonable different behavior of microstructural parameters in GM and WM. Diffusivities are reported in μm2/ms, Rsoma in μm.
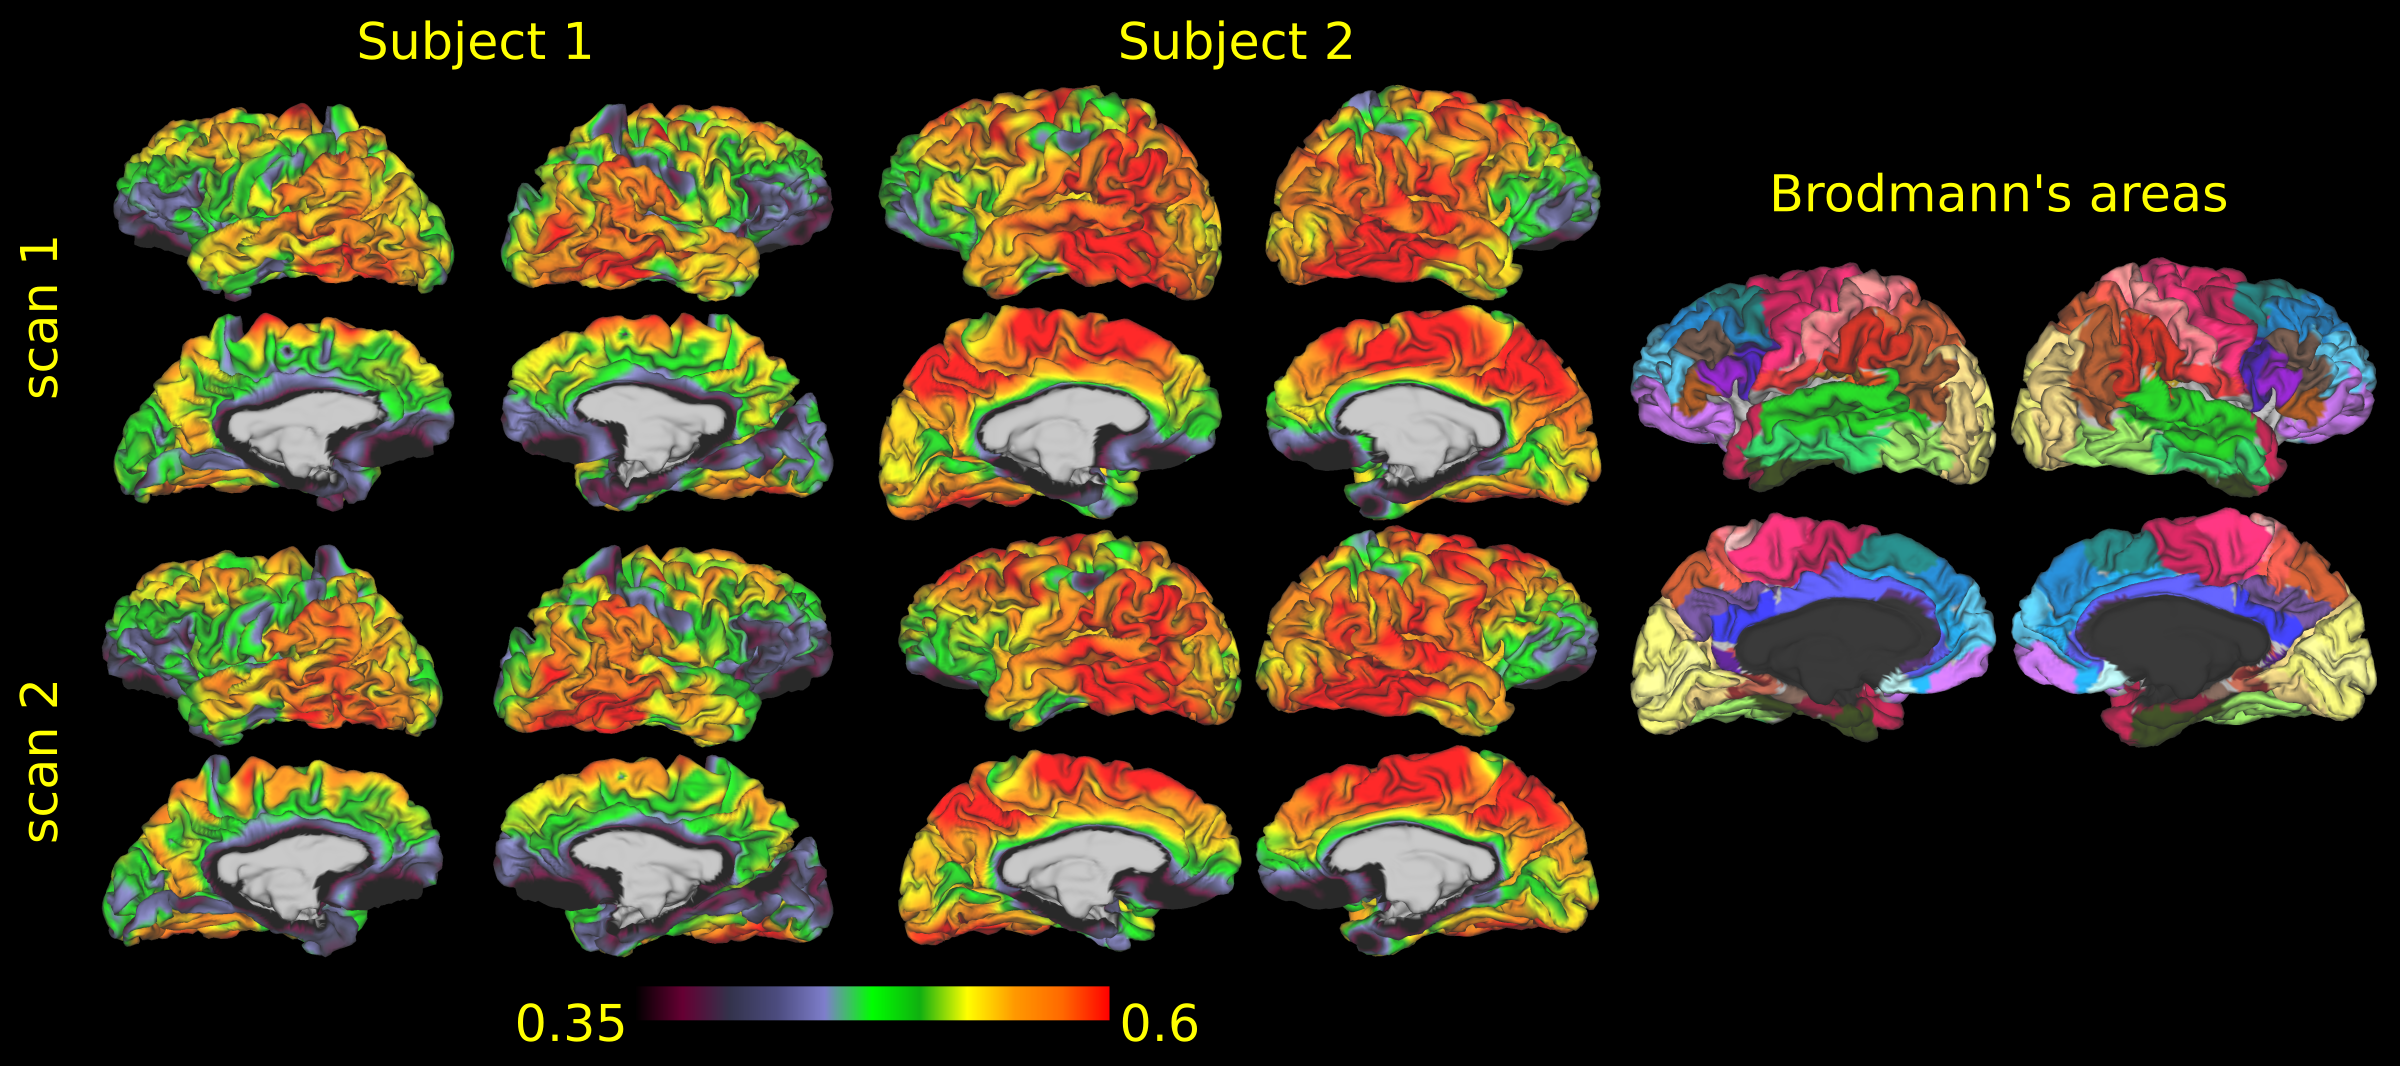
Figure 4: Projections of fsoma on the midpoint cortical surface of the two scans of the two healthy subjects of the MICRA dataset analyzed with SANDIAMICO. On the right we also report the parcellation in Brodmann’s areas to visually compare it with the density of soma.