2680
Mapping Brain Metabolite Differences Between HIV Clade-C Infected Individuals and Healthy Subjects Using a Whole-Brain MRSI1Radiology, University of Miami, Miami, FL, United States, 2Post Graduate Institute of Medical Education & Research, Chandigarh, India
Synopsis
Magnetic resonance spectroscopic imaging (MRSI) based studies investigating brain metabolite alterations due to HIV infection generally acquired MR spectra from single or multi-voxels covering regions related to HIV. In this study, we acquire whole-brain MRSI data to map regional metabolite variations in the entire brain, determine regions mostly affected by HIV clade-C infection, and identify the mechanism by which HIV damages the brain. Results show widespread increases in myo-inositol, glutamate/glutamine, choline, and creatine, and decreases in N-acetylaspartate, indicating neuronal dysfunction and astrogliosis in the white matter, as well as disruptions in synaptic transmission, neurotoxicity and inflammation throughout the brain.
Introduction
Several studies have used magnetic resonance spectroscopic imaging (MRSI) methods for identification of differences in brain metabolite levels between individuals with HIV infection and healthy subjects. Concordance across the literature indicates lower N-acetylaspartate (NAA), and higher total-choline (Cho) and myo-inositol (myo-Ins) associated with HIV infection.1 Increased glutamate/glutamine (Glx) is reported in most studies,2 but a few papers showed reductions.3 However, the majority of MRSI studies have used MR spectra acquired from single voxels or multi-voxels to try to encompass regions of interest (ROI) related to HIV.4 To our best knowledge, none have attempted to map these metabolite changes at the whole-brain level. Thus, the aim of this study is to acquire whole-brain MRSI data for quantitating metabolite concentrations in the entire brain and determine which regions are mostly affected by HIV clade-C infection.Methods
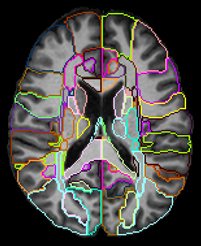
MRI Data were collected on a 3T Siemens scanner at the Post Graduate Institute of Medical Education & Research (PGIMER) in India from 216 volunteers with 108 Clade-C HIV+ subjects (78/30 male/female; age: 31.1±7.1 ), and 108 age-matched controls (72/36 male/female; age: 31.6±6.3 ). All HIV subjects were cART-naïve, i.e., received no HIV therapeutics until the MRI scan. The protocol included: (a) T1-weighted MPRAGE image (TR/TE: 2300/2.42 ms; voxel dimension: 1.0 × 1.0 × 1.0 mm; 160 axial slices); (b) whole-brain MRSI sequence using a 3-dimensional EPSI spin-echo sequence with: TR = 1,551 ms, TE = 17.6 ms, TI = 198 ms, matrix size of 50X50 with 18 slices, FOV = 280 × 280 × 180 mm.To perform an ROI-based analysis, the MRSI data were processed using the Metabolite Imaging and Data Analysis System (MIDAS) software.5,6 MIDAS’s Map-INTegrated (MINT) module integrates spectra from voxels within an atlas defined ROI to create a single integrated spectrum and perform spectral fitting. This results in higher SNR and more accurate fitting compared to individual voxel fitting. MINT includes filters for rejecting poor-quality data on a voxel-by-voxel basis. We used a modified JHU-MNI-SS-type2 atlas7 with 107 delineated ROIs covering the whole brain from which we obtain metabolite values. The spectral results are corrected for cerebrospinal fluid (CSF) partial volumes obtained from T1 images, and are normalized to the non-suppressed water reference data from the same ROI. ROIs with from less than 10 voxels, or where less than a third of either HIV+ or control subjects had acceptable data were rejected from analysis. Finally, by merging data from contralateral brain ROIs we obtained data from 38 unique ROIs (Figure 1).
Statistical analysis was performed using R. ROI-based comparisons between HIV+ and control groups were carried out for each metabolite using a t-test to find significant differences with a significance threshold of p < 0.05 corrected for multiple comparisons with FDR. Metabolites analyzed were: reatine (Cr), NAA, Cho, m-Ins, and Glx with their respective ratios over Cr for more stable results (NAA/Cr, Cho/Cr, m-Ins/Cr, Glx/Cr). Effect sizes (Cohen’s d) were calculated for each variable/ROI to map the differences in metabolite levels throughout the brain.
Results
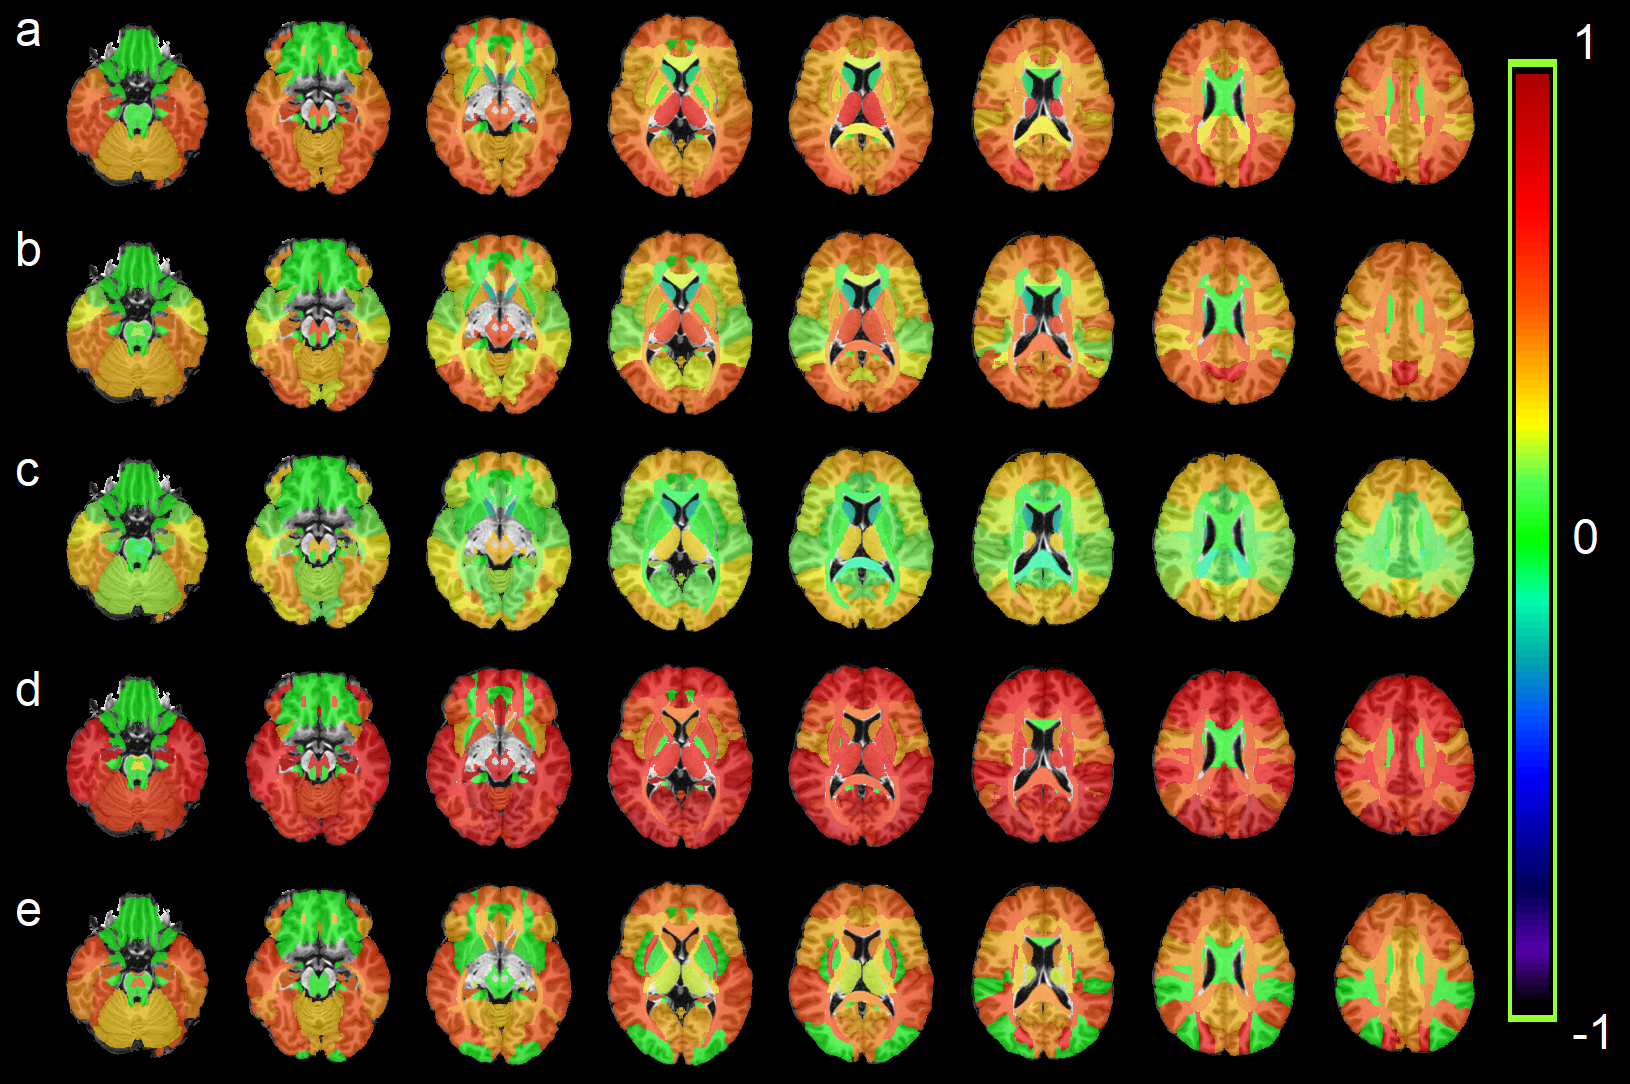
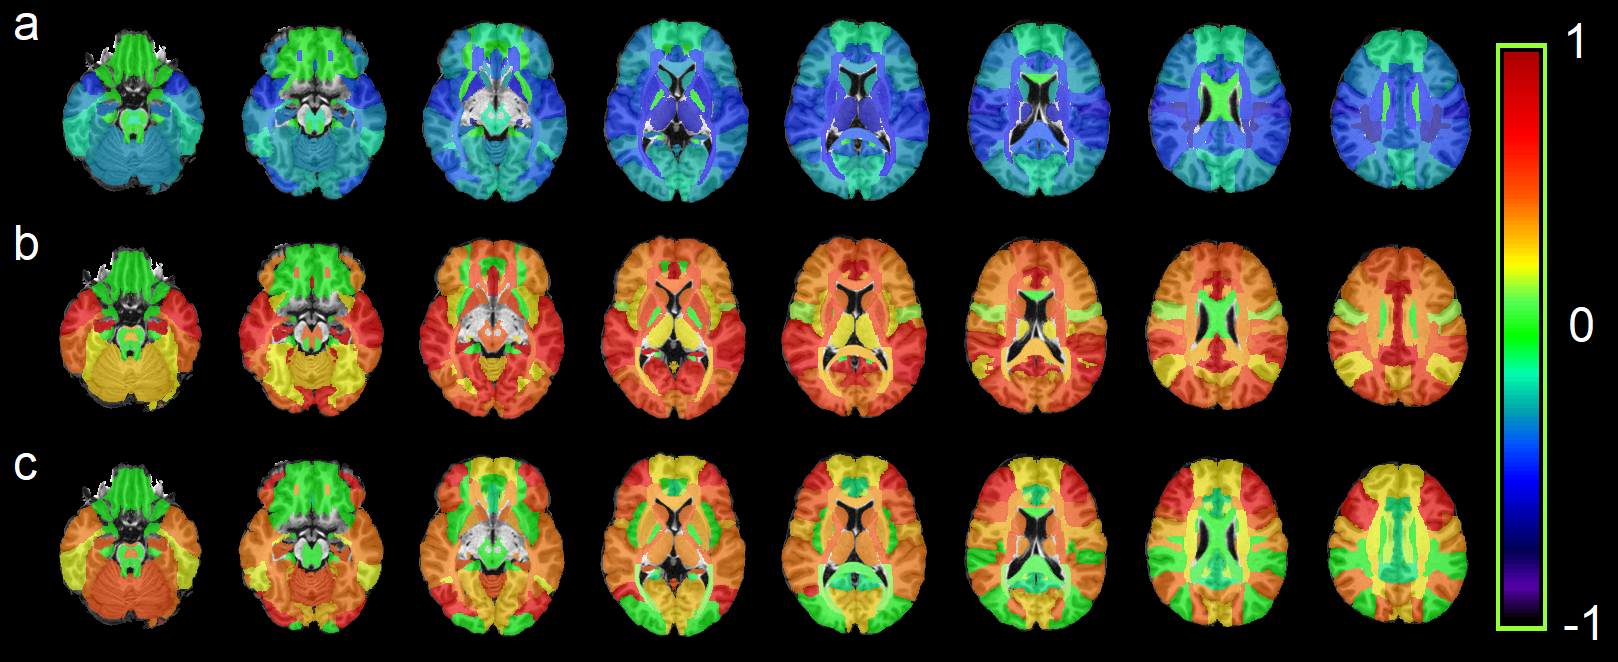
All metabolites except for NAA had an upward trend among HIV+ subjects with significant increases for Cr, Cho, m-Ins, and Glx in 30, 20, 36, and 28 ROIs, respectively (Figure 2). NAA decreased in some WM ROIs but was not significant. Ratios m-Ins/Cr and Glx/Cr also showed elevated values in the HIV+ group, while NAA/Cr had a downward trend concentrated in the WM (Figure 3). Cho/Cr did not show any change since both Cr and Cho were increasing. The most regionally widespread and statistically significant alterations were m-Ins, with individual ROI values plotted in Figure 4, highlighting it as potentially the most relevant biomarker for HIV infection.Discussion
The widespread alterations in metabolite levels provide an insight into the mechanism by which HIV infection damages the brain. Figure 3-a shows that the biggest reductions in NAA/Cr for HIV subjects are concentrated in white matter (WM) regions, notably the corona radiata and internal capsule, and the thalamus. NAA, localized almost exclusively within the neurons, is generally referred to as an indicator of neuronal integrity, viability, and dysfunctions due to HIV infection; though neurons are not known to be infected by HIV itself, the viral products in the vicinity of neurons impact them. This is mirrored by the increase in Cho in WM ROIs and frontal and occipital lobes of HIV group reflecting cell membrane disruption, active demyelination, microglial proliferation, reactive astrogliosis and inflammation (Figure 2-b). Alterations in m-Ins are the most significant with the highest increases found in the frontal, temporal, occipital and cingulate gyri of HIV group (Figure 2-d). m-Ins is also an indicator of gliosis and inflammation. Increase in Glx in WM and several lobes (Figure 2.e) indicates compromised synaptic transmission and bystander toxicity in the brain.8Conclusion
Our whole-brain MRSI approach with ROI-based spectral fitting can map regional metabolite variations with improved SNR and accuracy for evaluation of different brain regions are affected by HIV infection. Results suggest neuronal loss or dysfunction and astrogliosis in WM and the basal ganglia, microglial proliferation (gliosis) in the frontal and occipital lobes, disruptions in synaptic transmission, neurotoxicity and inflammation throughout the brains of individuals with HIV infection.Acknowledgements
Funding from NIH grant, R01 NS094043.References
1. Chelala L, O’Connor EE, Barker PB et al. Meta-analysis of brain metabolite differences in HIV infection. Neuroimage Clin. 2020;28:102436.
2. Bairwa D, Kumar V, Vyas S, et al. Case control study: magnetic resonance spectroscopy of brain in HIV infected patients. BMC Neurol. 2016;16(99).
3. Ernst T, Jiang CS, Nakama H, et al. Lower brain glutamate is associated with cognitive deficits in HIV patients: A new mechanism for HIV-associated neurocognitive disorder. J Magn Reson Imaging. 2010;32(5):1045–53.
4. Boban J, Thurnher MM, Brkic S, et al. Neurometabolic Remodeling in Chronic Hiv Infection: a Five-Year Follow-up Multi-Voxel Mrs Study. Scientific Reports. 2019;9:19799.
5. Maudsley AA, Darkazanli A, Alger JR, et al. Comprehensive processing, display and analysis for in vivo MR spectroscopic imaging. NMR in biomedicine. 2006;19(4):492-503.
6. Maudsley AA, Domenig C, Govind V, et al. Mapping of brain metabolite distributions by volumetric proton MR spectroscopic imaging (MRSI). Magnetic resonance in medicine: official journal of the Society of Magnetic Resonance in Medicine/Society of Magnetic Resonance in Medicine. 2009;61(3):548-559.
7. Oishi K, Faria A, Jiang H, et al. Atlas-based whole brain white matter analysis using large deformation diffeomorphic metric mapping: application to normal elderly and Alzheimer's disease participants. Neuroimage. 2009;46(2):486-99.
8. Gorska AM and Eugenin EA. The Glutamate System as a Crucial Regulator of CNS Toxicity and Survival of HIV Reservoirs. Front Cell Infect Microbiol. 2020;10:261.
Figures