2679
Longitudinal metabolic and morphometric characterization of a knock-in mouse model of SpinoCerebellar Ataxia Type 71Université Paris-Saclay, Commissariat à l’Energie Atomique et aux Energies Alternatives (CEA), Centre National de la Recherche Scientifique (CNRS), Molecular Imaging Research Center (MIRCen), Laboratoire des Maladies Neurodégénératives, Fontenay-aux-Roses, France, 2Université de Strasbourg, Institut de Génétique et de Biologie Moléculaire et Cellulaire, Illkirch, France, 3Centre National de la Recherche Scientifique, Unité Mixte de Recherche 7104, Illkirch, France, 4Institut National de la Santé et de la Recherche Médicale U964, Illkirch, France
Synopsis
SpinoCerebellar Ataxia Type 7 (SCA7) is an autosomal dominant degenerative disease defined by neurodegeneration of the retina and cerebellum. While gene silencing therapeutic strategy is developing, there is a need of biomarkers for evaluation of their efficacy. Here we characterize a recent knock-in mouse model of SCA7 with in-vivo longitudinal MRI and MRS. SCA7140Q/5Q display a wide range of phenotypes, including morphological and metabolic alterations in key brain structures. Our longitudinal protocol allowed better understanding of the chronology of these alterations and offers pertinent biomarkers for evaluation of therapies using the SCA7140Q/5Q model.
Purpose
SpinoCerebellar Ataxia type 7 (SCA7) is a neurodegenerative disorder caused by CAG repeats encoding polyglutamine expansion in the ATXN7 protein, which is part of the SAGA transcriptional coactivator complex1. This mutation leads to neurodegeneration in the cerebellum and retina. Gene silencing strategy is very promising for SCA7 treatment, but development of these therapies lacks suitable biomarkers and animal models.Recently, we characterized a new knock-in mouse model of SCA7, which was the first model to display the broad spectrum of phenotypes observed in clinical SCA72. Furthermore, its lifespan of 54 weeks allows monitoring the pathogenesis with symptoms appearing progressively. In the present study, we performed a longitudinal, multiparametric MRI follow-up of SCA7 mice in order to better characterize this model and identify biomarkers. Such biomarkers could be used to evaluate therapy efficacy in SCA7 and similar diseases.
Material & Methods
Mouse model: Knock-in mice harboring 140 CAG repeats inserted in the murine Atxn7 gene were used. Heterozygous mice for the Atxn7 gene (SCA7140Q/5Q, n=6 females) were compared to their relative age-matched littermates (WT, n=10 females).Anesthesia: Anesthesia was induced by inhalation of 2% isoflurane in a mix 1:1 of O2:air. Mice were then administered a subcutaneous bolus of 0.025 mg/kg of medetomidine. Isoflurane was then gradually lowered to 0.5% with continuous perfusion of 0.05 mg/kg/h medetomidine.
MRI protocol: Animals were scanned longitudinally (16, 24, 30 weeks of age) on a horizontal 11.7T Bruker magnet using a Cryoprobe. The protocol included anatomical imaging (TSE sequence, 100 slices, 0.1 x 0.1mm², 0.2mm slice thickness) and acquisition of a metabolic profile in a voxel placed in the hippocampus by 1H-MRS (LASER, TE/TR=20/1000ms, 6 x 1.5 x 2mm3, Figure 2b).
Image Analysis: Images were co-registered and automatically segmented using an atlas composed of a high-resolution template based on Allen mouse brain atlas3. The registration pipeline used an in-house python library (Sammba-MRI4). Spectra obtained with 1H-MRS were processed with LCModel5 and metabolite concentration was evaluated relative to total Creatine (tCr) level (CRLB < 5%).
Statistical analysis: After Shapiro-Wilk normality test, one-way ANOVA with repeated measures was used for statistical analysis and was followed by Tukey post-hoc test. Bonferroni correction for multiple comparisons was also applied.
Results
Morphometry: Brain structures volumes were calculated based on segmentation of anatomical images and compared between SCA7140Q/5Q and WT. Figure 1 presents the results as volume variation maps between the two groups. The brain of SCA7140Q/5Q mice showed global and progressive atrophy, with parieto-temporal cortex (-8.8%, p<0.01) and thalamus (-8.5%, p<0.01) reaching significant volume loss as soon as 16 weeks of age. At 24 weeks, atrophy of motor (-8.6%, p<0.05), frontal (-13.6%, p<0.05) and parieto-temporal (-14.1%, p<0.01) cortices was observed, as well as in the striatum (-17.2%, p<0.01) and thalamus (-13.4%, p<0.01). At 30 weeks, due to death of two SCA7140Q/5Q mice, only striatum (-19.8%, p<0.05) and thalamus (-17.2%, p<0.05) reached significance. However, trend of marked atrophy was visible in the whole brain.1H-MRS: SCA7140Q/5Q mice showed altered metabolism in the hippocampus at every timepoint (Figure 2a). At 16 weeks of age, glutamine (Gln) was increased by 44% in this structure (p<0.001). At 24 weeks, this effect was still visible (+76%, p<0.001), and myo-inositol (Ins) was also altered, with reduction of 25% in SCA7140Q/5Q mice (p<0.05). At 30 weeks, in addition to these effects, total N-acetyl-aspartate (tNAA) level was reduced (-15.9%, p<0.001).
Discussion
In a previous ex-vivo MRI study on 24 weeks-old mice2, we identified atrophy of several structures in the brain of SCA7140Q/5Q and SCA7140Q/140Q mice, including hippocampus, cortex and corpus callosum, as well as global brain atrophy. All these effects were dependent on genotype, showing the more pronounced phenotype of homozygous mice.Here, we characterized temporally this volume loss in the SCA7140Q/5Q model with a longitudinal in-vivo study. Our results confirmed atrophy of the whole brain and aforementioned regions, and highlighted other structures that showed high volume loss. Atrophy of all structures was increased with ageing of mice, showing aggravation of phenotype in SCA7140Q/5Q mice.
Interestingly, striatum and thalamus, two structures involved in movement control, showed particularly pronounced atrophy, reaching nearly 20% loss in SCA7140Q/5Q mice compared to WT. SCA7 is characterized by preferential degeneration of the Purkinje cells in the cerebellum, leading to deficient movement coordination. While in-vivo MRI of the cerebellum is difficult to achieve with optimal SNR due to distance to the antenna, our results show that longitudinal follow-up of basal ganglia structures volumes may reflect ataxia and serve as biomarkers of the disease.
In addition, 1H-MRS showed progressive disorganization of the metabolism in the hippocampus of SCA7140Q/5Q mice. Gln and Ins levels alteration suggests impaired astrocytic function, while tNAA decrease appearing at 30 weeks is typical of neuronal suffering or loss. This result is in compliance with published data on the chronology of neurodegeneration in this model2. Our protocol thus seems to identify the time course of neuronal dysfunction in SCA7140Q/5Q mice.
Conclusion
Our longitudinal study demonstrates the pertinence of the SCA7140Q/5Q model with better characterization of its metabolic and morphologic alterations. This protocol bears a potential for in-vivo evaluation of gene silencing therapies, with biomarkers on both micro- and macroscopic scales.Acknowledgements
Project was supported by eRARE ERA-Net (“TreatPolyQ” ANR-17-RAR3-0008-01). 11.7T scanner was funded by NeurATRIS (“Investissements d'Avenir”, ANR-11-INBS-0011).References
1. Niewiadomska-Cimicka, A. & Trottier, Y. Molecular Targets and Therapeutic Strategies in Spinocerebellar Ataxia Type 7. Neurotherapeutics 16, 1074–1096 (2019).
2. Niewiadomska-Cimicka, A. et al. SCA7 Mouse Cerebellar Pathology Reveals Preferential Downregulation of Key Purkinje Cell-Identity Genes and Shared Disease Signature with SCA1 and SCA2. J. Neurosci. 41, 4910–4936 (2021).
3. Lein, E. S. et al. Genome-wide atlas of gene expression in the adult mouse brain. Nature 445, 168–176 (2007).
4. Celestine, M., Nadkarni, N. A., Garin, C. M., Bougacha, S. & Dhenain, M. Sammba-MRI: A Library for Processing SmAll-MaMmal BrAin MRI Data in Python. Front. Neuroinformatics 14, (2020).
5. Provencher, S. W. Estimation of metabolite concentrations from localized in vivo proton NMR spectra. Magn. Reson. Med. 30, 672–679 (1993).
Figures
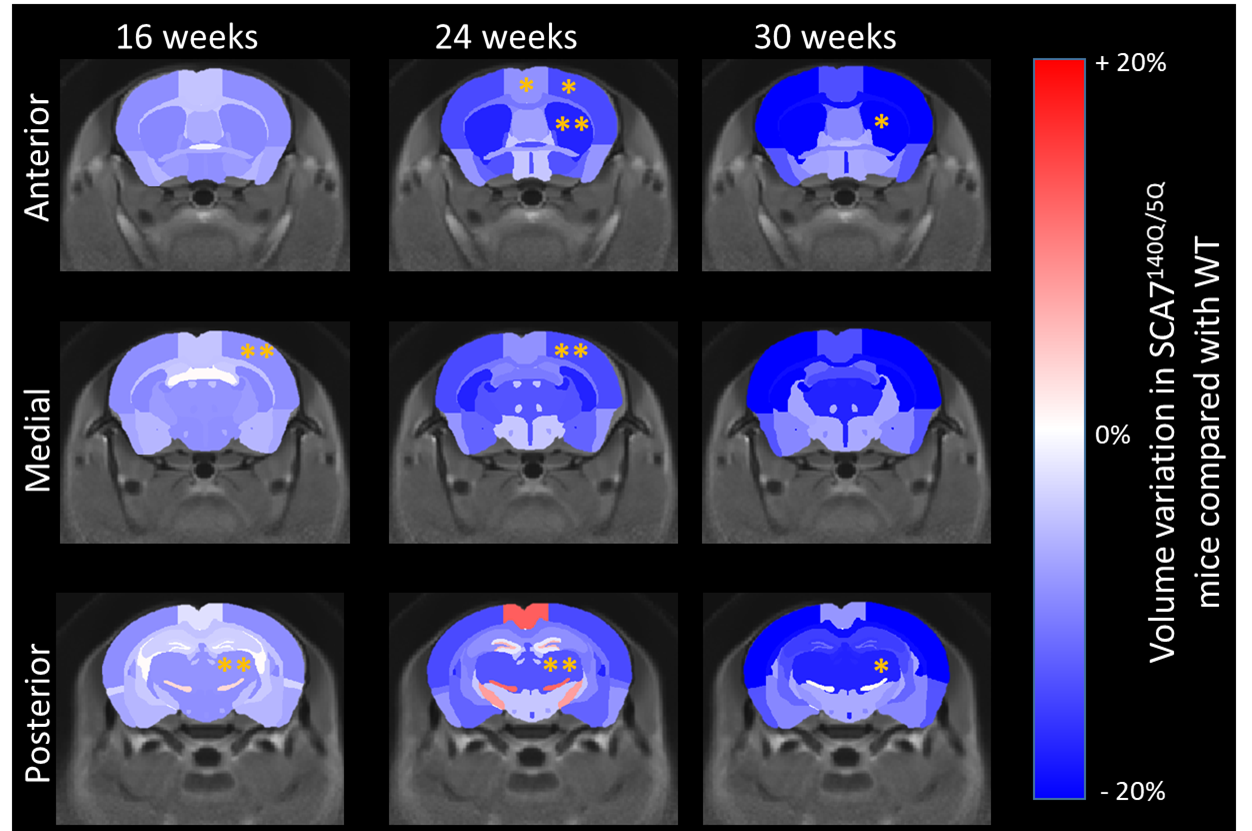
Figure 1: Volume variation maps between SCA7140Q/5Q and WT mice. Variation was calculated for each structure as (Volume(SCA7)-Volume(WT))/Volume(WT). *p<0.05, **p<0.01 (repeated measures ANOVA + Tukey post hoc and Bonferroni correction for multiple comparisons)

Figure 2: a) Levels of metabolites of interest relative to total Creatine level. b) Localization of the voxel of acquisition in a representative dataset. GABA=gamma-aminobutyric acid, Gln= glutamine, Glu= glutamate, Ins= myo-inositol, Tau= Taurine, tNAA= total N-acetyl-aspartate, tCho= total choline. *p<0.05, **p<0.01, ***p<0.001 (repeated measures ANOVA + Tukey)