2675
Multiple System Atrophy Classification via 3D Convolutional Neural Network and Simulated Brain MRI Parametric Maps1ToNIC, Toulouse NeuroImaging Center, Université de Toulouse, Inserm, UPS, Toulouse, France, 2LAAS CNRS, Université de Toulouse, CNRS, INSA, UPS, Toulouse, France, 3French Reference Center for MSA, Department of Neurosciences and Clinical Pharmacology Clinical Investigation Center CIC1436, NS-Park/FCRIN Network, ToNIC, Toulouse NeuroImaging Center University Hospital of Toulouse, Inserm, Université de Toulouse 3, Toulouse, France, 4French Reference Center for MSA, Department of Neurology for Neurodegenerative Diseases, University Hospital Bordeaux, Bordeaux, France, 5Univ. Bordeaux, CNRS, IMN, UMR 5293, F-33000 Bordeaux, France, 6Dept. Medicine, University of Otago, Christchurch and New Zealand Brain Research Institute, Christchurch, New Zealand, 7CRCT, Centre de Recherche en Cancerologie de Toulouse, Inserm, Toulouse, France
Synopsis
As a rare neurodegenerative disorder, multiple system atrophy (MSA) can be challenging to analyse using a deep learning approach given the limited sample size. A method is submitted to produce cluster-based simulated brain MR parametric maps from healthy controls, using regional intensity distribution belonging to a set of MSA patients. This enabled to train a 3D CNN only with the simulated set. Testing on the MSA data set, the accuracy obtained was comparable to the state-of-the-art. This approach allows to deal with small samples of data in deep learning, while exploiting a-priori knowledge of the disease.
Introduction
Multiple System Atrophy (MSA) is a rare neurodegenerative disease, whose differential diagnosis from Parkinson’s disease and related syndromes can be difficult1. Biomarkers extracted from mean diffusivity (MD) parametric maps computed from diffusion-weighted MRI have shown great potential in distinguishing MSA patients from healthy controls (HC) 2. Increase of MD values can indeed indicate anomalies at the microstructural level3.Convolutional neural networks (CNNs) are increasingly used in neuroimaging to classify brain disorders with promising results4,5. However, analysis of rare diseases through these methods may be hindered by the lack of sufficient examples needed to train deep networks.
In this study, we propose to use 3D CNN in combination with simulated brain MD parametric maps to discern MSA patients from HC. To create the simulated data using a cluster-based approach, we focused on the cerebellum, one region of interest in diagnosing MSA6. We trained the 3D CNN exclusively with the simulated data to distinguish the simulated images from the original ones. Testing on the MSA set, we achieved results compatible with the state of the art.
Methods
The MSA data set was composed by MD maps derived from 29 MSA patients and 26 healthy controls. For the MSA cluster-based simulated (MSAc-Sim) images, we modified MNI coregistered MD maps from 89 healthy participants (HP) of an external set. All details regarding these data sets are available in previous studies2,7.Figure 1 shows the main steps of our approach: (i) Extraction of MD values from the cerebellum of MSA patients; (ii) Computation of histogram from MD values, used to perform k-means clustering8; (iii) Cluster definition from Mild to Severe according to increasing MD values; (iv) Computation of mean MD values for each cluster, obtaining the mean cerebellum MSA patterns (in Figure 2); (v) Modification of the external HP set by histogram-matching technique using mean cerebellum MSA patterns9. In Figure 3, examples of MSAc-Sim images are provided.
The number of clusters (k) was identified using the silhouette method10. We considered k=2, presenting the best silhouette coefficient, and k=3 for comparison.
We implemented the 3D CNN architecture presented in Figure 1, used in a previous work, taking inspiration from AlexNet and VGG-Net11-13. Using 3D images as input favours in fact the integration of MRI spatial information14. Convolutional layers were characterized by 3x3x3 kernel size, instead pooling layers by 2x2x2 kernel size. The CNN was trained exclusively using the MSAc-Sim images and original HP images. 10-fold cross validation was applied on 80% of the entire set, whereas the rest was left out for testing. Model trained for 100 epochs, using Adam optimizer and initial learning rate equal to 0.00005, with a decreasing scheme if no improvement in performance was detected. For each fold, the model presenting smallest loss value on the validation set was selected.
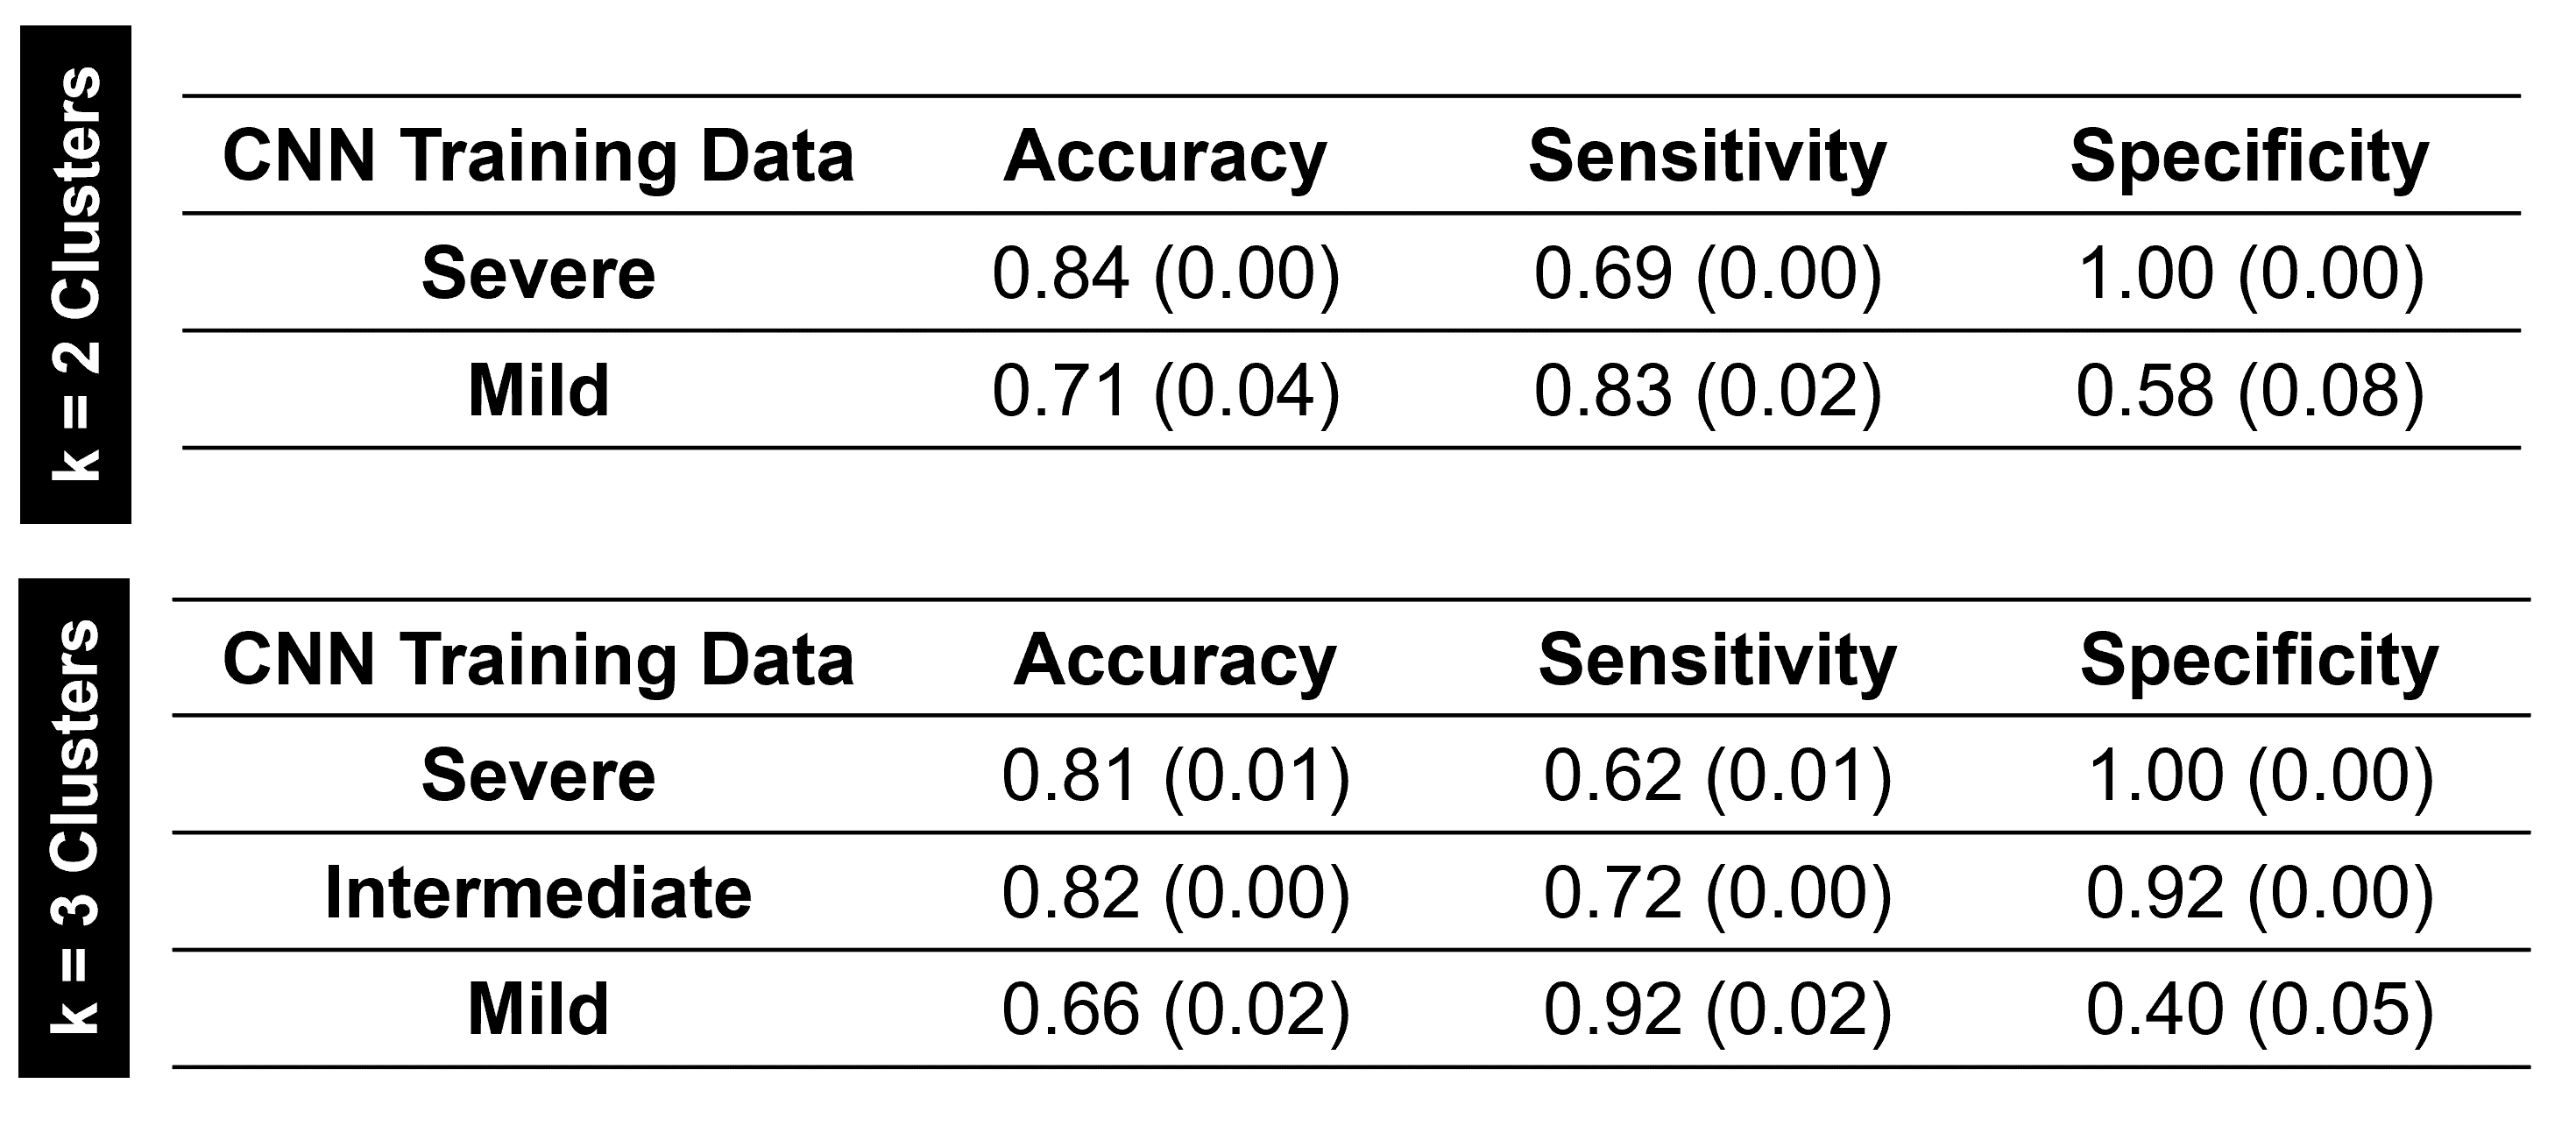
We used the 3D CNN trained with MSAc-Sim images to test on the unseen set of MSA patients and healthy matched controls. We evaluated performances considering sensitivity, specificity, and accuracy.
Results
The best accuracy on the MSA set (0.84) was obtained by the CNN trained with cluster Severe (k=2). Performances are detailed in Figure 4. The HC were well classified (specificity equal to 1.00), whereas sensitivity on MSA patients was around 0.70. However, misclassified patients belonged to Mild clusters, thus involving minor MD increases. In general, Mild clusters showed poor performance with accuracy around 0.70. The Intermediate cluster did not present considerably different performances from severe clusters.Discussion
In this study, we successfully classified MSA patients using 3D CNN trained with cluster-based simulated data. Our best accuracy (0.84) is in line with previous studies using support vector machine and features extracted by human operators2,15.Our findings are promising in at least three aspects:
· Completely automatic approach with features learned directly from brain MRI data.
· The knowledge enclosed within the simulated MD maps was enough to correctly classify over 80% of MSA patients.
· The method used to create the simulated set is highly customizable: we only used the mean image of each cluster, but we could modify the reference pattern considering e.g. the standard deviation. This would allow to increase the variability of the training set and potentially ameliorate performance.
It is important to note that MSA brain patterns are not limited to modifications of the cerebellum. Our approach based on only one modified brain region did not cover the whole MSA cerebral pathophysiological changes. This could explain the limit in the accuracy reached in our study. Moreover, further analyses are needed to evaluate the specificity of this approach in other diseases involving cerebellum changes. Another limitation is the restricted sample size for the external and MSA sets. However, our approach offers a way to cope with the case of few available samples, as for rare diseases.
Conclusion
The creation of simulated data based on a priori-knowledge of neurodegenerative pathologies revealed efficient to identify real pathologic patterns via 3D CNN. Future works include targeting other regions involved in the MSA pathophysiological alteration and investigating the impact of these findings on other neurodegenerative diseases.Acknowledgements
We would like to thank the MRI technical platform at Toulouse Neuroimaging Center (ToNIC), Université de Toulouse, Inserm, UPS, France.References
1. Barbagallo G, Sierra-Peña M, Nemmi F, et al. Multimodal MRI assessment of nigro-striatal pathway in multiple system atrophy and Parkinson disease. Mov Disord. 2016 Mar;31(3):325-34. doi: 10.1002/mds.26471. Epub 2015 Dec 17. PMID: 26676922.2. Nemmi F, Pavy-Le Traon A, Phillips OR, et al. A totally data-driven whole-brain multimodal pipeline for the discrimination of Parkinson's disease, multiple system atrophy and healthy control. Neuroimage Clin. 2019;23:101858. doi: 10.1016/j.nicl.2019.101858. Epub 2019 May 13. PMID: 31128523; PMCID: PMC6531871.
3. Le Bihan D, Iima M. Diffusion Magnetic Resonance Imaging: What Water Tells Us about Biological Tissues. PLoS Biol. 2015 Jul 23;13(7):e1002203. doi: 10.1371/journal.pbio.1002203. Erratum in: PLoS Biol. 2015 Sep;13(9):e1002246. PMID: 26204162; PMCID: PMC4512706.
4. Litjens G, Kooi T, Bejnordi BE, et al. A survey on deep learning in medical image analysis. Med Image Anal. 2017 Dec;42:60-88. doi: 10.1016/j.media.2017.07.005. Epub 2017 Jul 26. PMID: 28778026.
5. Jo T, Nho K, Saykin AJ. Deep Learning in Alzheimer's Disease: Diagnostic Classification and Prognostic Prediction Using Neuroimaging Data. Front Aging Neurosci. 2019 Aug 20;11:220. doi: 10.3389/fnagi.2019.00220. PMID: 31481890; PMCID: PMC6710444.
6. Péran P, Barbagallo G, Nemmi F, et al. MRI supervised and unsupervised classification of Parkinson's disease and multiple system atrophy. Mov Disord. 2018 Apr;33(4):600-608; doi: 10.1002/mds.27307. Epub 2018 Feb 23. PMID: 29473662.
7. Villain E, Mattia GM, Nemmi F, et al. "Visual interpretation of CNN decision-making process using Simulated Brain MRI," 2021 IEEE 34th International Symposium on Computer-Based Medical Systems (CBMS) 2021; 515-520; doi: 10.1109/CBMS52027.2021.00102.
8. Lloyd SP. Least Squares Quantization in PCM. IEEE Transactions on Information Theory. 1982;28;129–137.
9. González, RC and Woods RE. Digital image processing, 3rd Edition. 2008.
10. Rousseeuw P. Silhouettes: a graphical aid to the interpretation and validation of cluster analysis. Journal of Computational and Applied Mathematics. 1987; 20; 53-65.
11. Krizhevsky A, Sutskever I, Hinton GE. “ImageNet classification with deep convolutional neural networks.” Communications of the ACM 2012; 60; 84-90.
12. Simonyan K, Vedaldi A, and Zisserman A. Deep inside convolutional networks: Visualising image classification models and saliency maps. 2014.
13. Mattia GM, Nemmi F, Villain E et al. Investigating the discrimination ability of 3d convolutional neural networks applied to altered brain mri parametric maps. TechRxiv, Preprint. 2021.
14. Trivizakis E, Manikis GC, Nikiforaki K, et al. Extending 2-D Convolutional Neural Networks to 3-D for Advancing Deep Learning Cancer Classification With Application to MRI Liver Tumor Differentiation. IEEE J Biomed Health Inform. 2019 May;23(3):923-930. doi: 10.1109/JBHI.2018.2886276. Epub 2018 Dec 11. PMID: 30561355.
15. Huppertz HJ, Möller L, Südmeyer M, et al. Differentiation of neurodegenerative parkinsonian syndromes by volumetric magnetic resonance imaging analysis and support vector machine classification. Mov Disord. 2016 Oct;31(10):1506-1517. doi: 10.1002/mds.26715. PMID: 27452874.
Figures
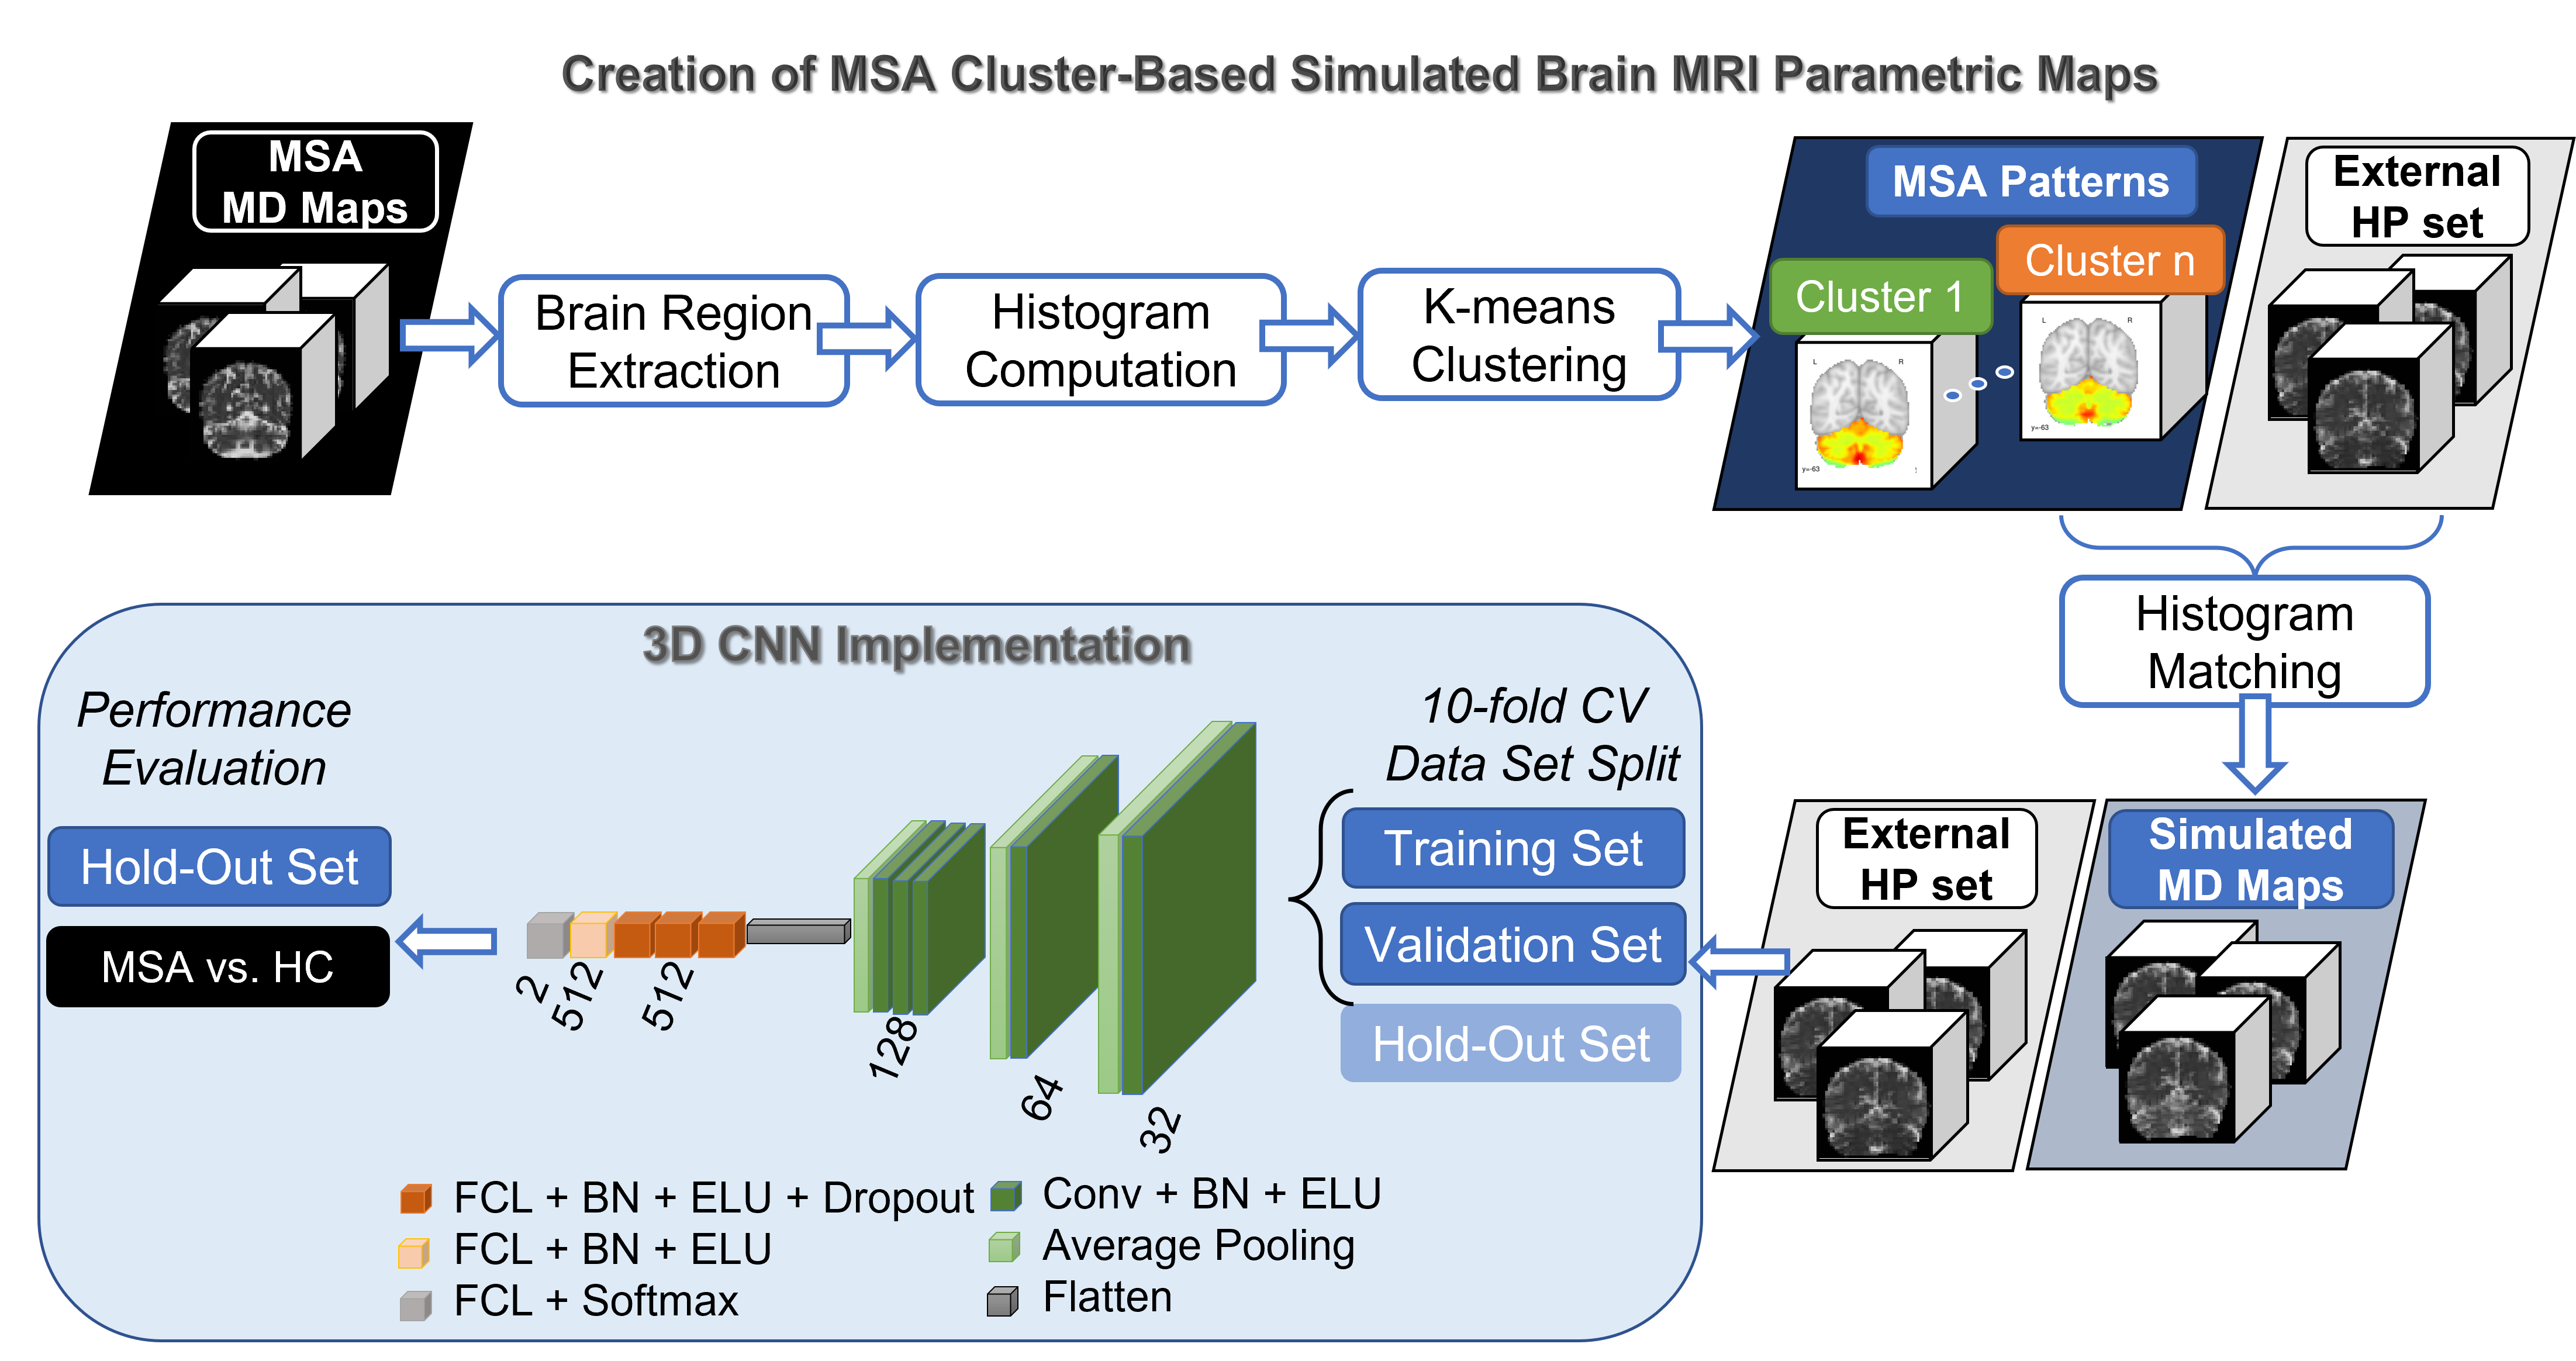
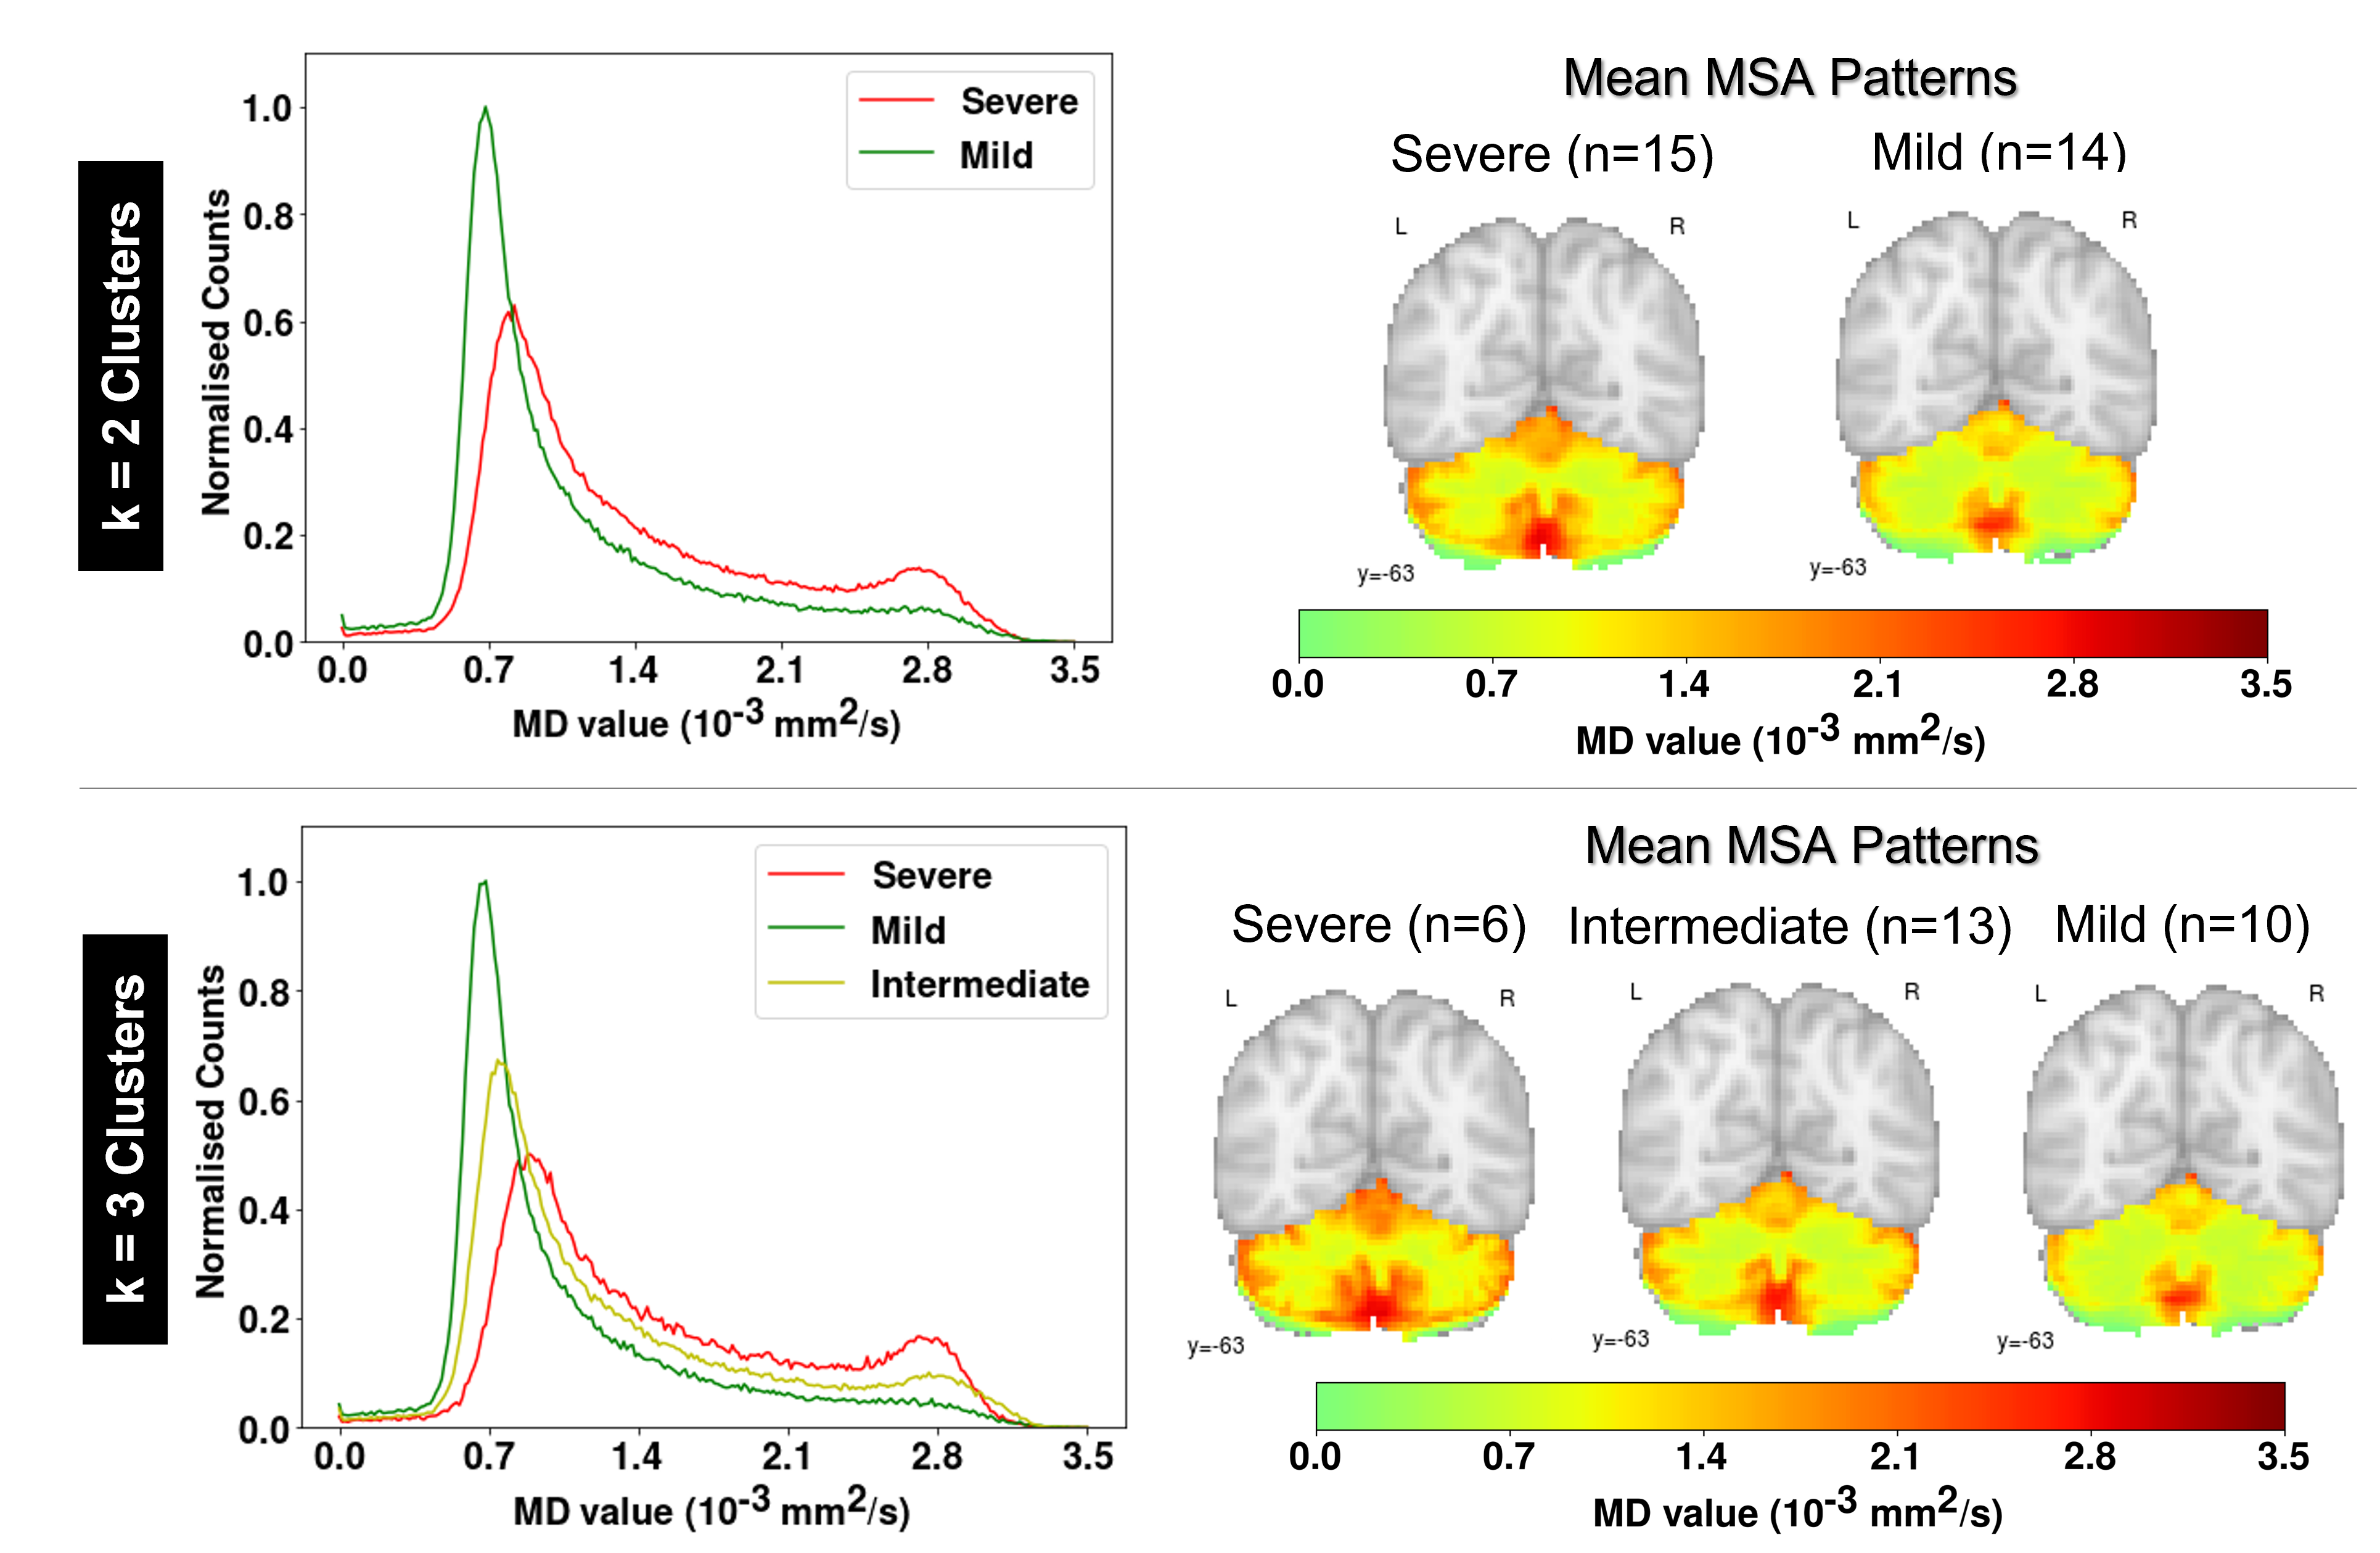
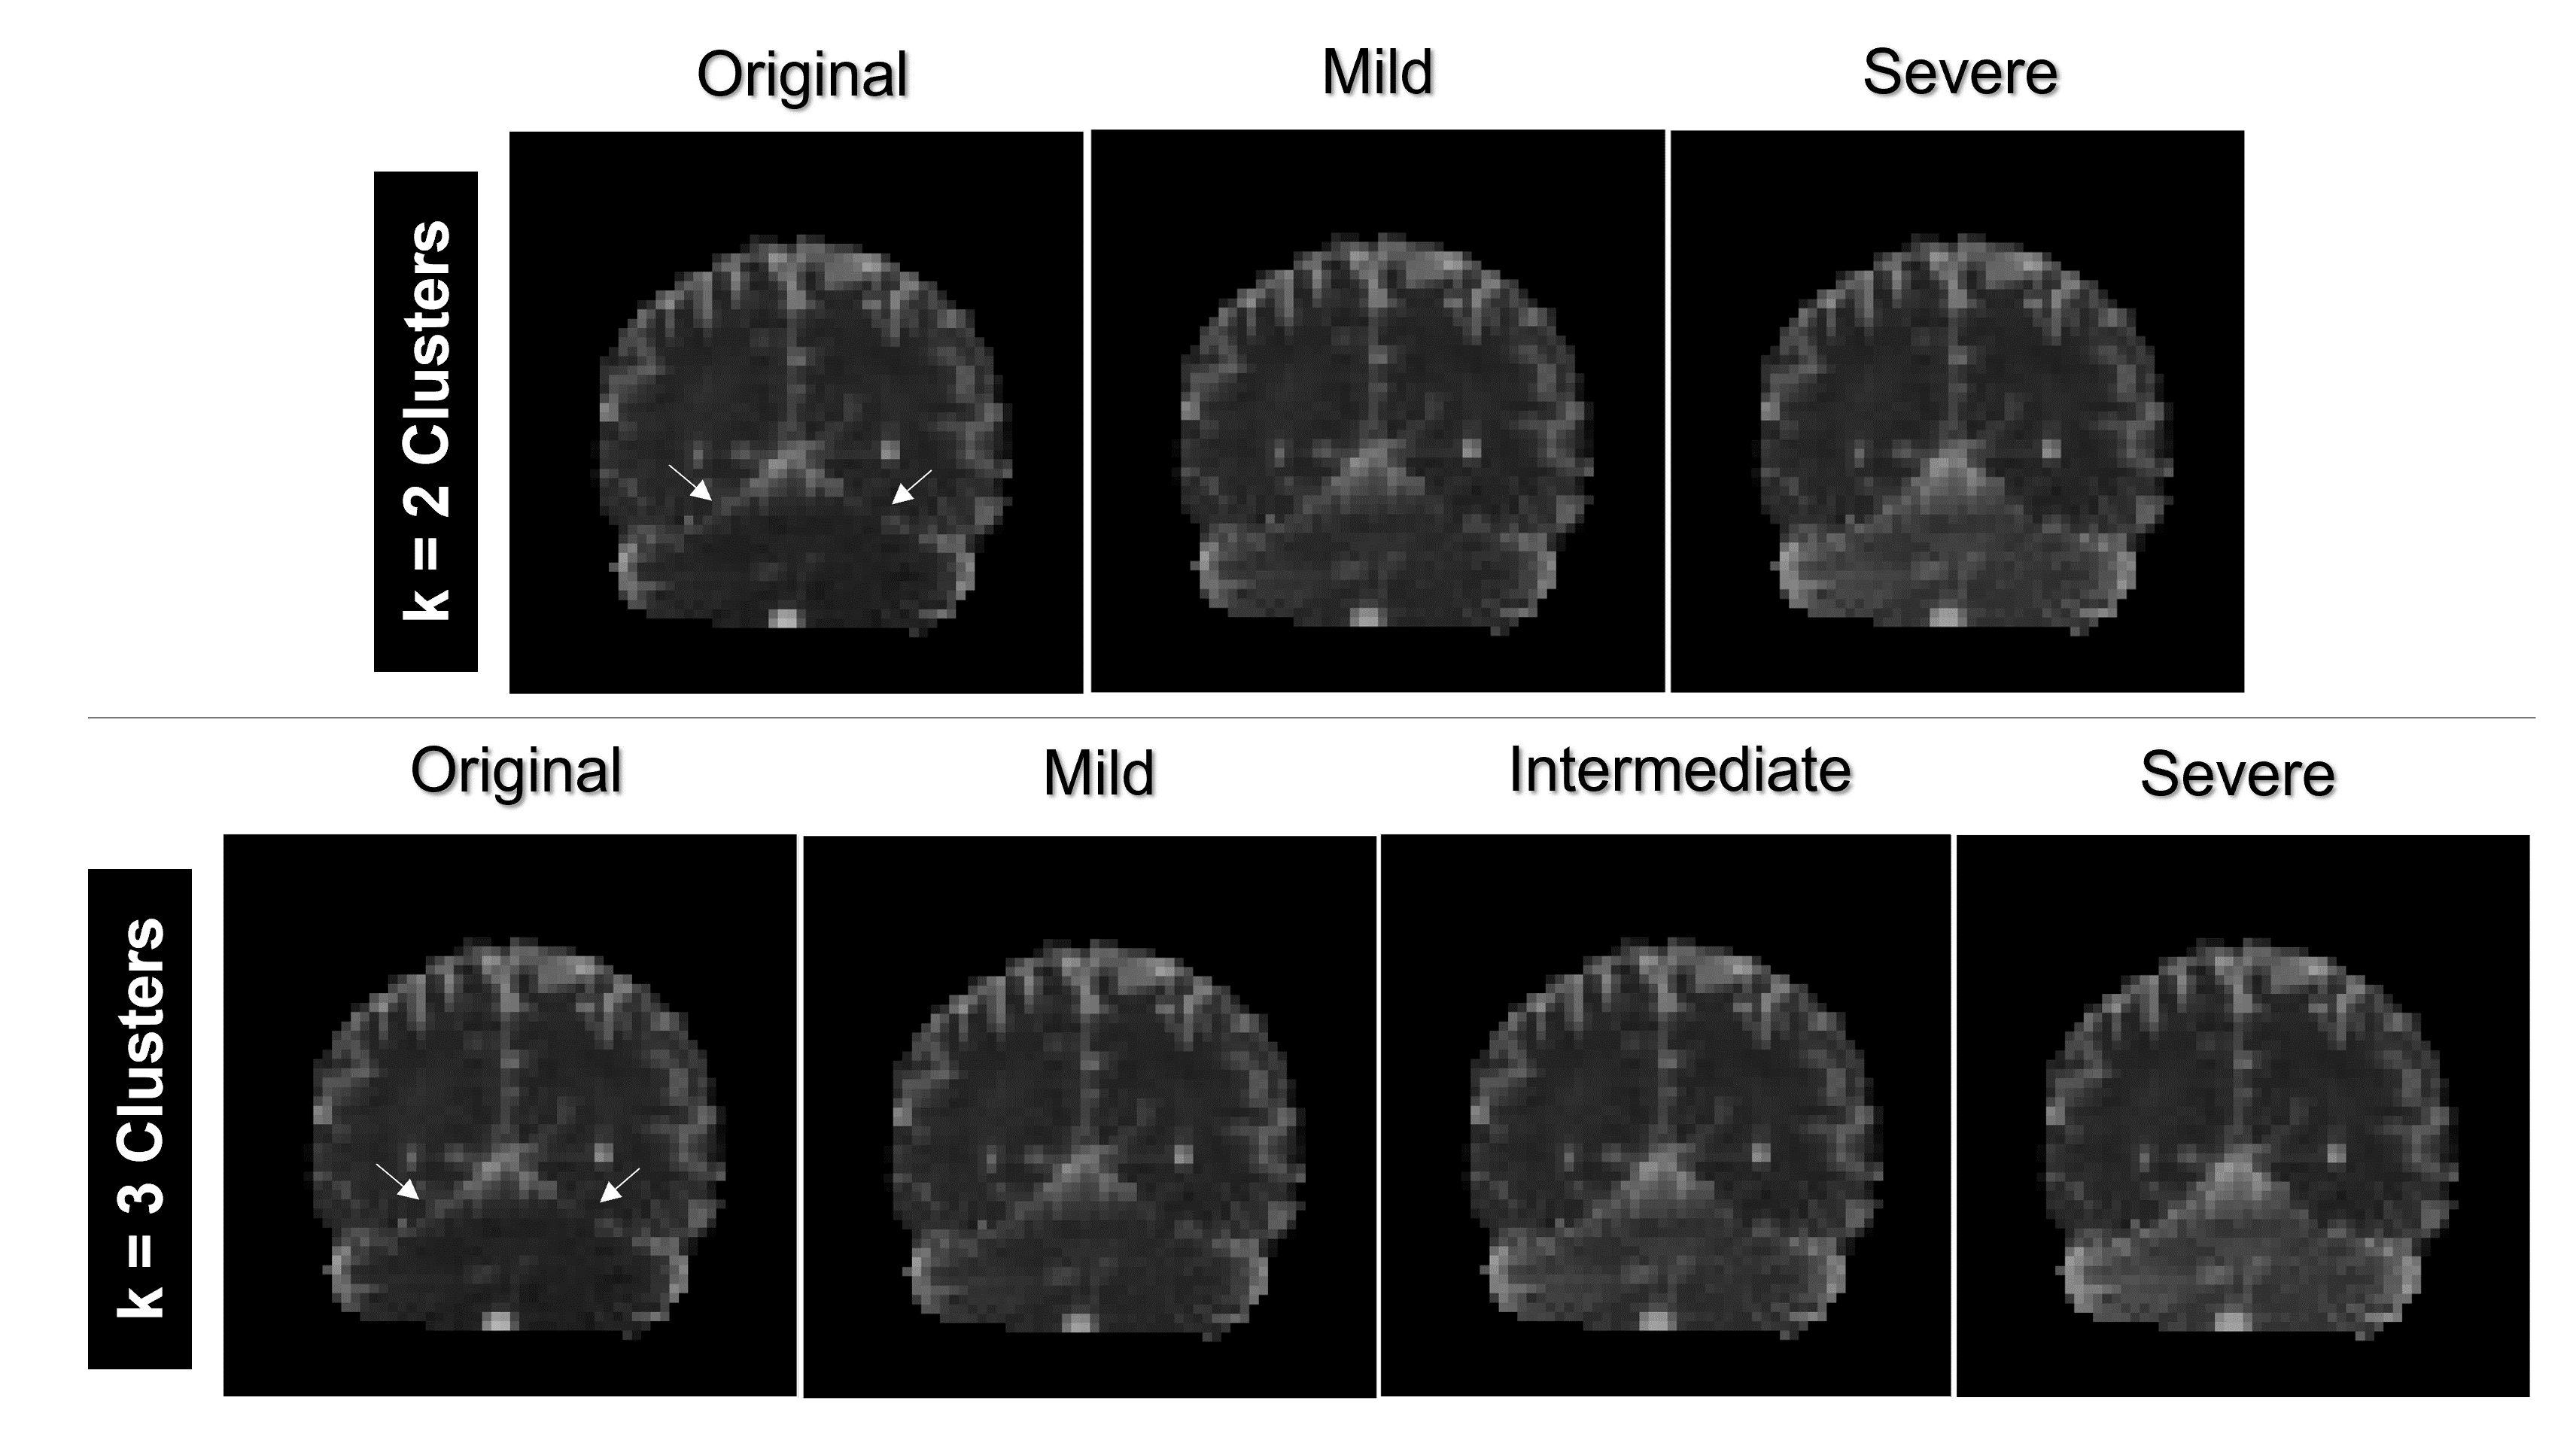
Figure 3. Examples of MSA cluster-based simulated (MSAc-Sim) mean diffusivity (MD) maps obtained from each cluster. Arrows point to the region modified to create MSAc-Sim images, i.e. the cerebellum. Notice how MD values in the cerebellum increase going from Mild to Severe clusters