2674
QSM, R2* and correlation thereof as qMRI measures of iron and myelin reflect tissue changes in Huntington’s disease1Institute of Neuroscience and Medicine INM-4, Research Centre Juelich, Juelich, Germany, 2Department of Neurology, RWTH Aachen University, Aachen, Germany, 3JARA-BRAIN Institute Molecular Neuroscience and Neuroimaging, Research Centre Juelich, Juelich, Germany, 4Faculty of Medicine, JARA, RWTH Aachen University, Aachen, Germany, 5Institute of Neuroscience and Medicine 11, INM-11, JARA, Research Centre Juelich, Juelich, Germany
Synopsis
QSM and R2* are quantitative MRI parameters sensitive to iron and myelin content, and their correlation provides further insight into the chemical form of iron. These are the tissue properties which are most affected by Huntington’s disease, besides volumetric changes. We investigate by multiparametric qMRI changes induced by HD in 18 gene-carriers by comparison to matched healthy controls. These qMRI changes are significant in several cortical and subcortical regions and correlate with clinical measures of HD, including CAG mutation length. Although the interpretation of correlations between parameters is not unambiguous, insights into tissue chemical and micro-structure are enabled.
Introduction
Huntington's disease (HD) is an incurable, autosomal dominantly inherited neurodegenerative condition caused by a Cytosine Adenine Guanine (CAG) repeat expansion in the gene encoding huntingtin. The mutant protein causes neuronal dysfunction and eventually neuronal death. Striatal atrophy is the most consistent and robust finding in HD [1], but there are clear effects involving e.g. the cerebral cortex and cerebellum in later stages of the disease. A number of intriguing aspects in the pathogenesis of HD lend themselves to investigation with quantitative MR imaging (qMRI). Neuroinflammation. Immune activation in HD is widespread and biomarkers of inflammation in the HD gene-carriers are detectable more than 15 years before the onset of neurological manifestations [2-4]. Metal homeostasis is disturbed in HD [5], as measured by MR imaging and validated in postmortem brain. The early aberrant accumulation of iron in the basal ganglia suggests that iron-induced oxidative stress, as well as altered regulation of iron-dependent enzymes, could have an important role in the early selective vulnerability of the basal ganglia during pre-HD [5]. Myelin breakdown is well documented in HD, both in vivo for subjects with manifest or premanifest HD, as well as by postmortem methods [6]. As pointed out in [6], ultrastructural electron microscopy studies demonstrate that myelin breakdown results in microvacuolations consisting of splits of myelin sheath layers that create microscopic fluid-filled spaces that increase MRI-visible water. We report here on using data from 18 HD patients and 21 healthy controls to investigate how the interplay between iron, myelin and water content changes in HD is reflected by quantitative susceptibility mapping (QSM), R2* relaxometry and their correlations.Materials and Methods
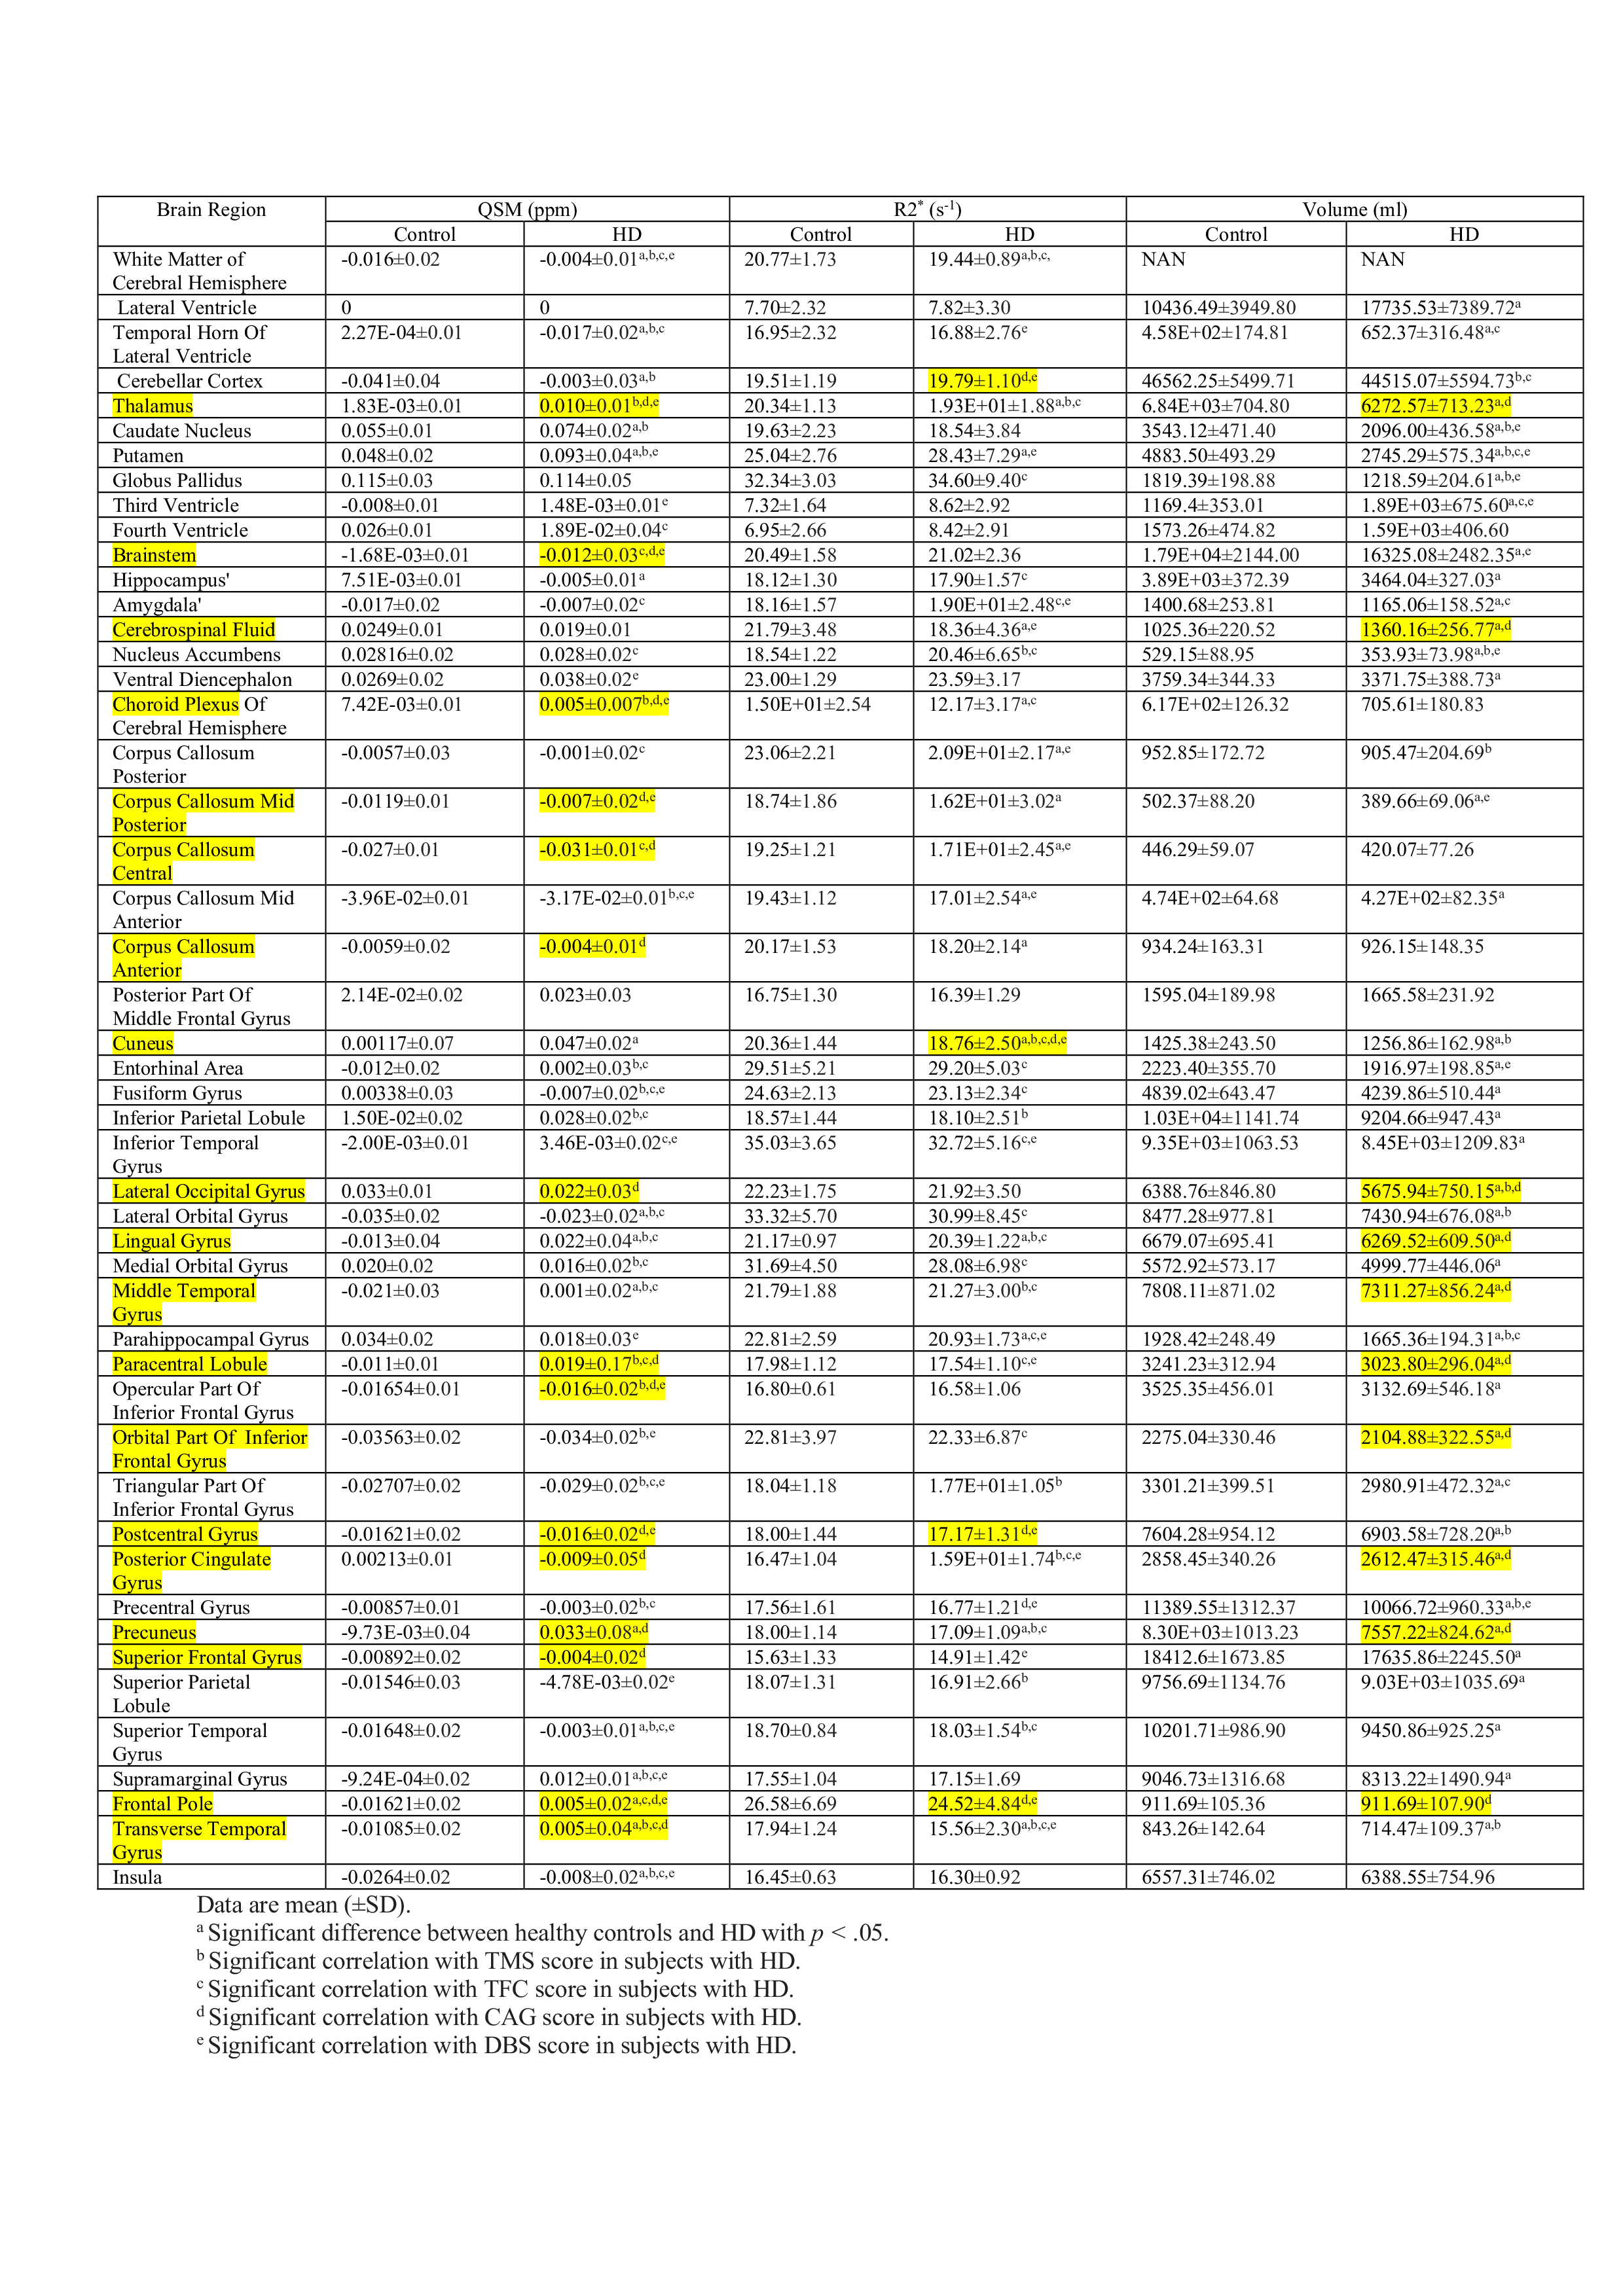
Eighteen HD subjects (3 pre-manifest, 10 female, 45±9.51y.o.) and 21 age and gender-matched controls were recruited. All subjects gave written informed consent and all experimental procedures had prior approval from the ethics committee of RWTH Aachen University. For the HD subjects, Total Motor Score (TMS), Total Functional Capacity (TFC), Disease Burden Score (DBS) and Cytosine Adenine Guanine (CAG) load were defined as clinical measures. Their (mean±SD) values were TMS 32±20, TFC 10±3, DBS 386±85, CAG 44±3. MRI at 3T (Siemens Trio, 12-channel coil) consisted of anatomical T1w MPRAGE (TR=2250ms, TE=3.82ms, TI=900ms, BW=140Hz/px, a=9o, matrix size 156x192x128, 1x1x1mm3, iPAT=2, TA=2min:36s) repeated 4 times, and multiple-echo gradient echo (TR=51ms, a=8o, TE1=2.58ms, dTE=4ms, 12 echoes, BW=260Hz/px, matrix 156x192x128, TA=7min:11s, iPAT=2) repeated 3 times. For the GRE scans, both magnitude and phase images were saved. The four MPRAGE scans were each registered to the first echo of the first GRE scan, averaged and parcellation was performed using Freesurfer6.0 [7]. The labels for all ROIs were registered to each of the subsequent GRE scans, using ANTS. Susceptibility mapping was performed using MEDI+0 [8] with default parameters [9] and R2* mapping using arlo [10]. For each ROI, the quantitative data from each GRE acquisition were pooled together for further analysis. A Spearman's rank partial correlation analysis, adjusted for age and gender, was performed to correlate quantitative parameters and tissue volume in each ROI with clinical measures (TMS, TFC, DBS and CAG) in the HD group. The differences in ROI volume and quantitative values (QSM, R2*) between healthy controls and HD subjects were tested using Analysis of Covariance (ANCOVA) with age and gender as covariates. The value of p < 0.05 was considered statistically significant and all the statistical analysis was performed with SPSS [11].Results
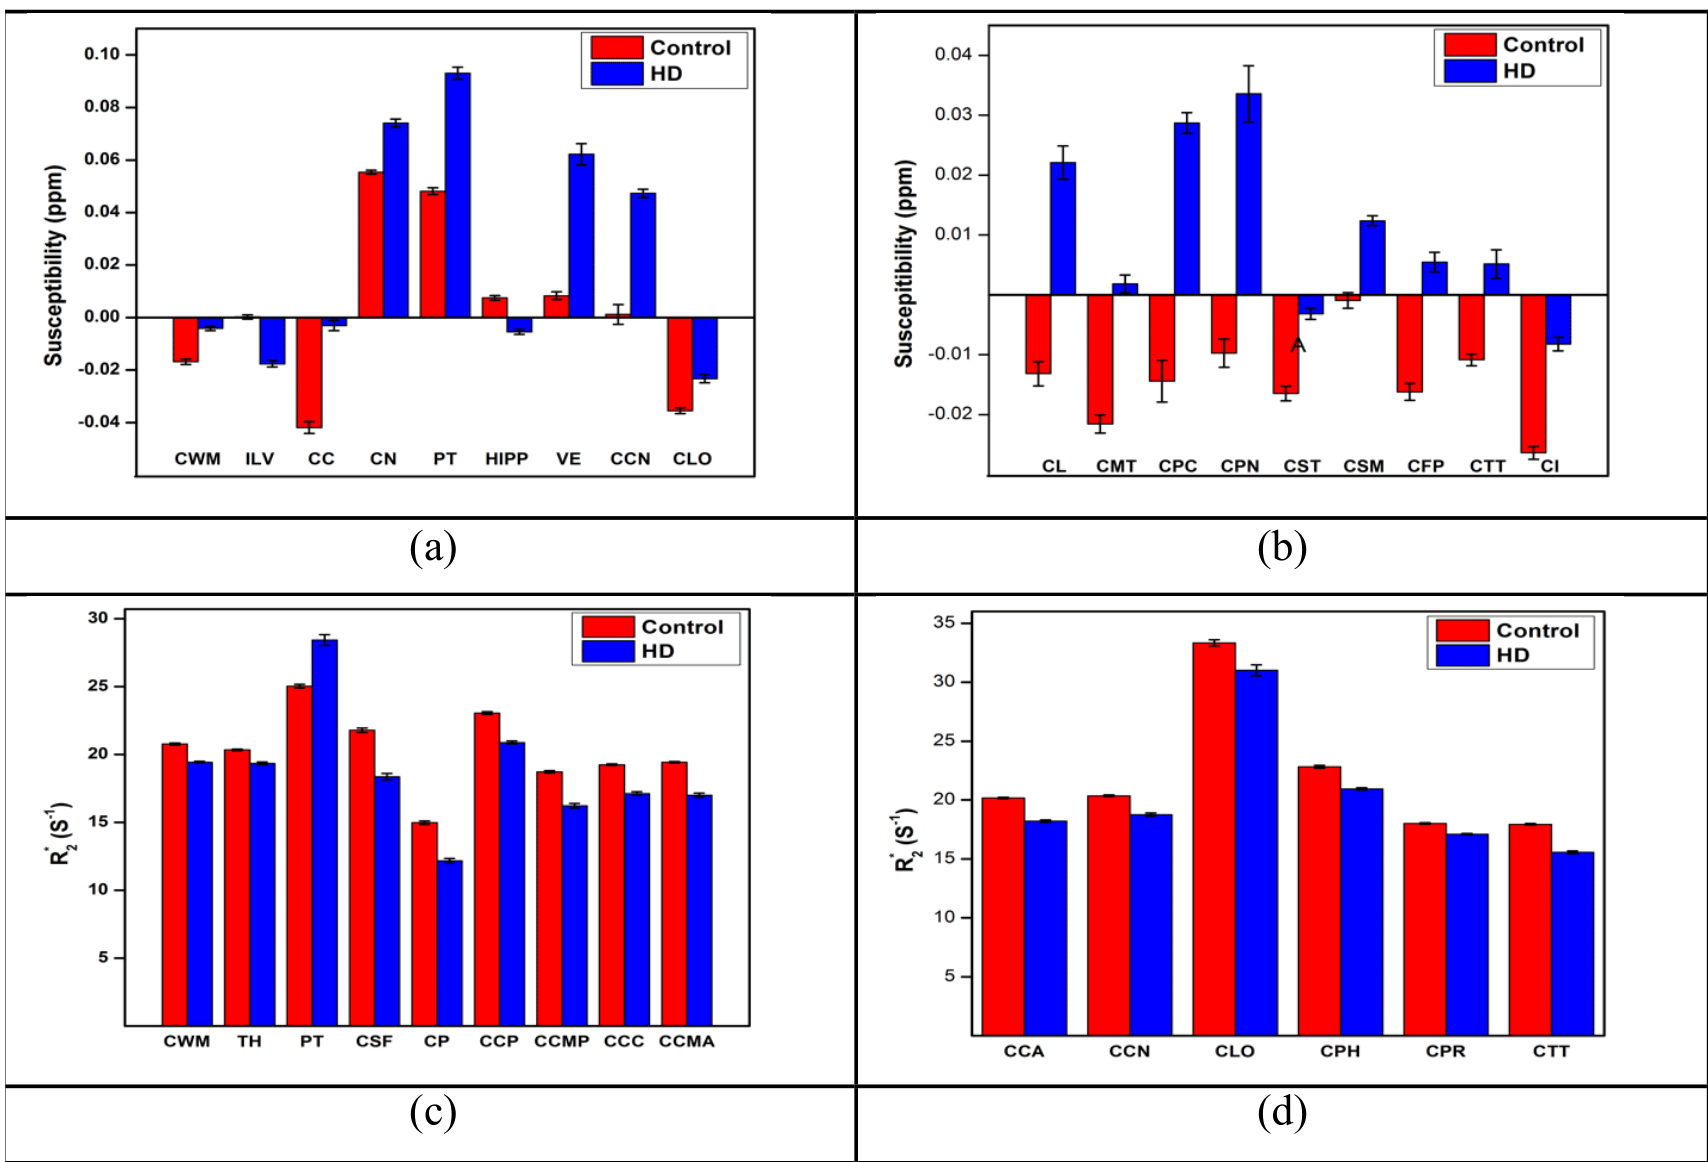
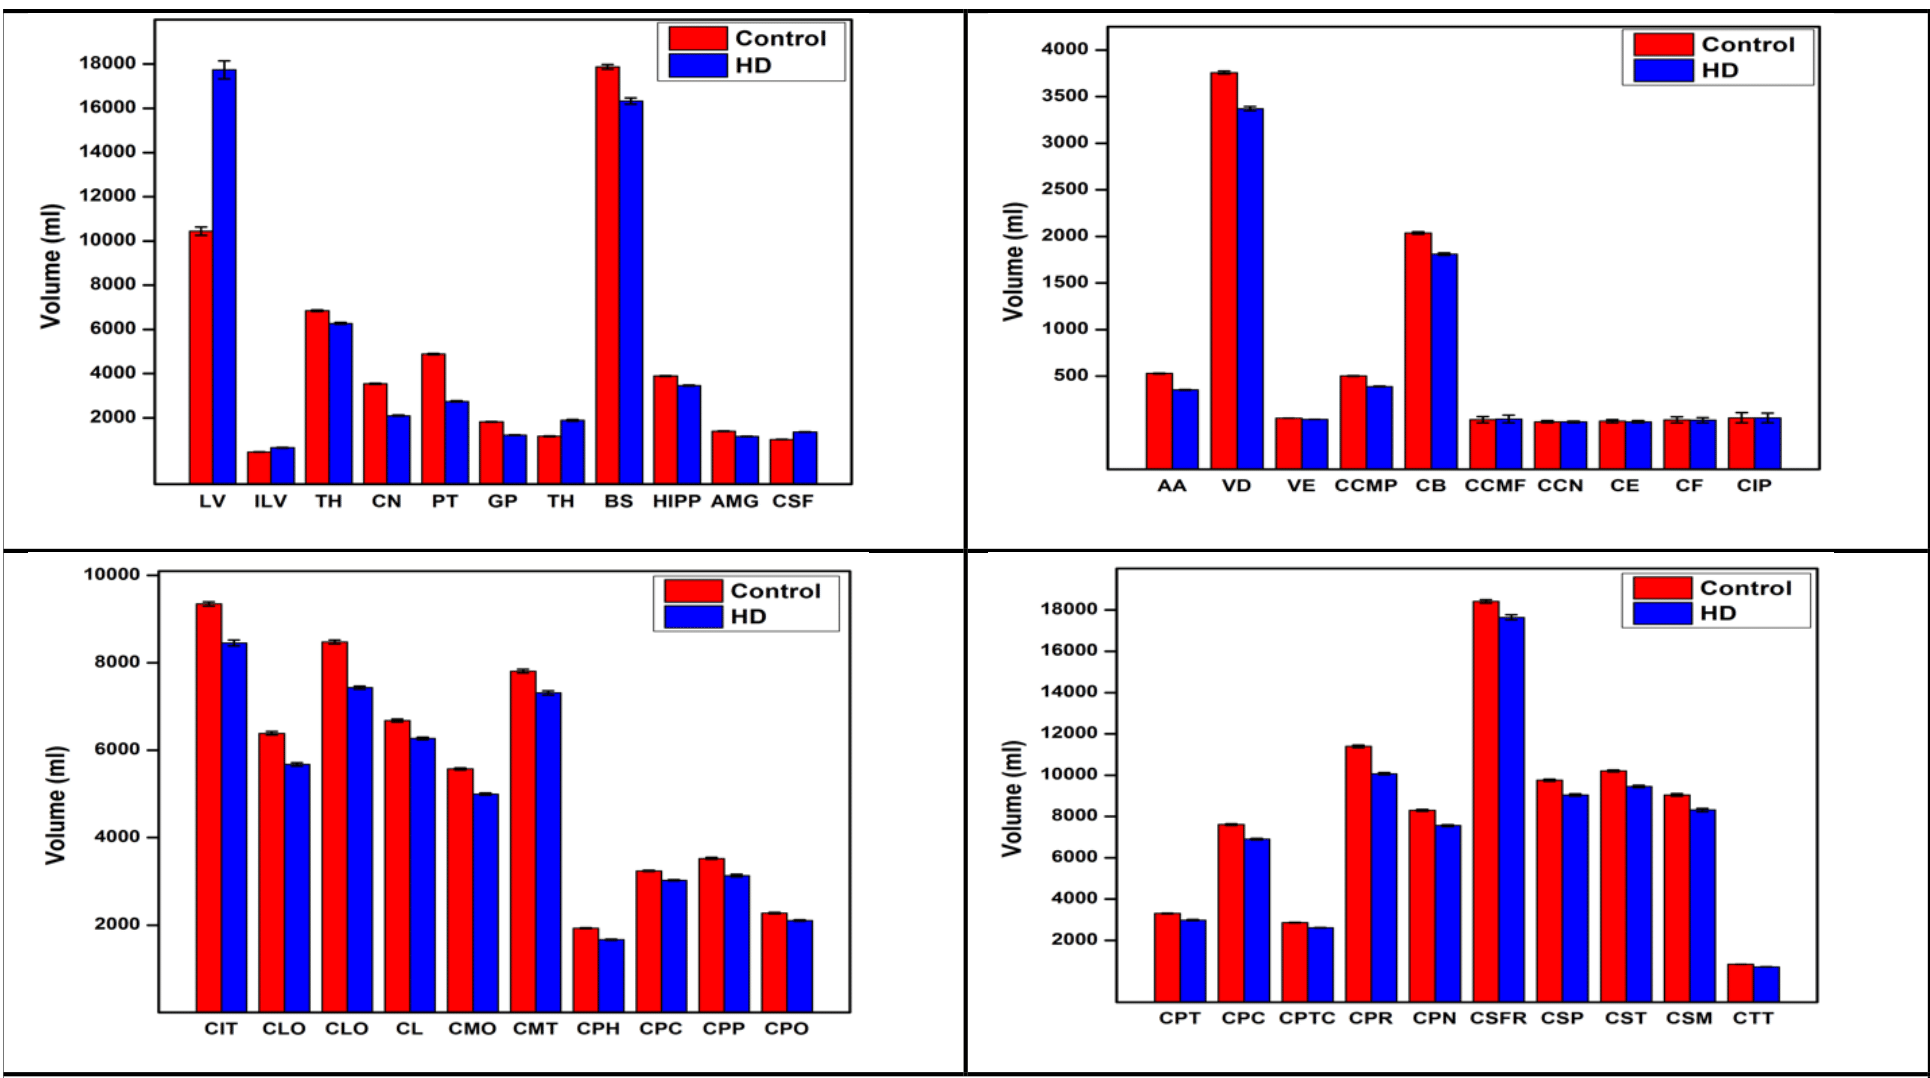
Significant differences in quantitative parameters between HD and controls are summarised in Figs. 1a,b (QSM), 1c,d(R2*) and Table 1. Widespread morphological changes were also found in cortical and subcortical regions (Fig. 2 and Table 1). Significant correlations between QSM and R2* (considering left and right hemispheric ROIs separately) were found in 17 regions in controls; in HD subjects, the number increased to 44 regions.Discussion
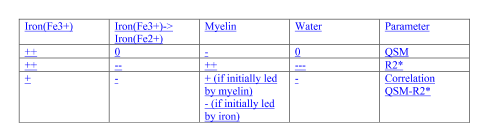
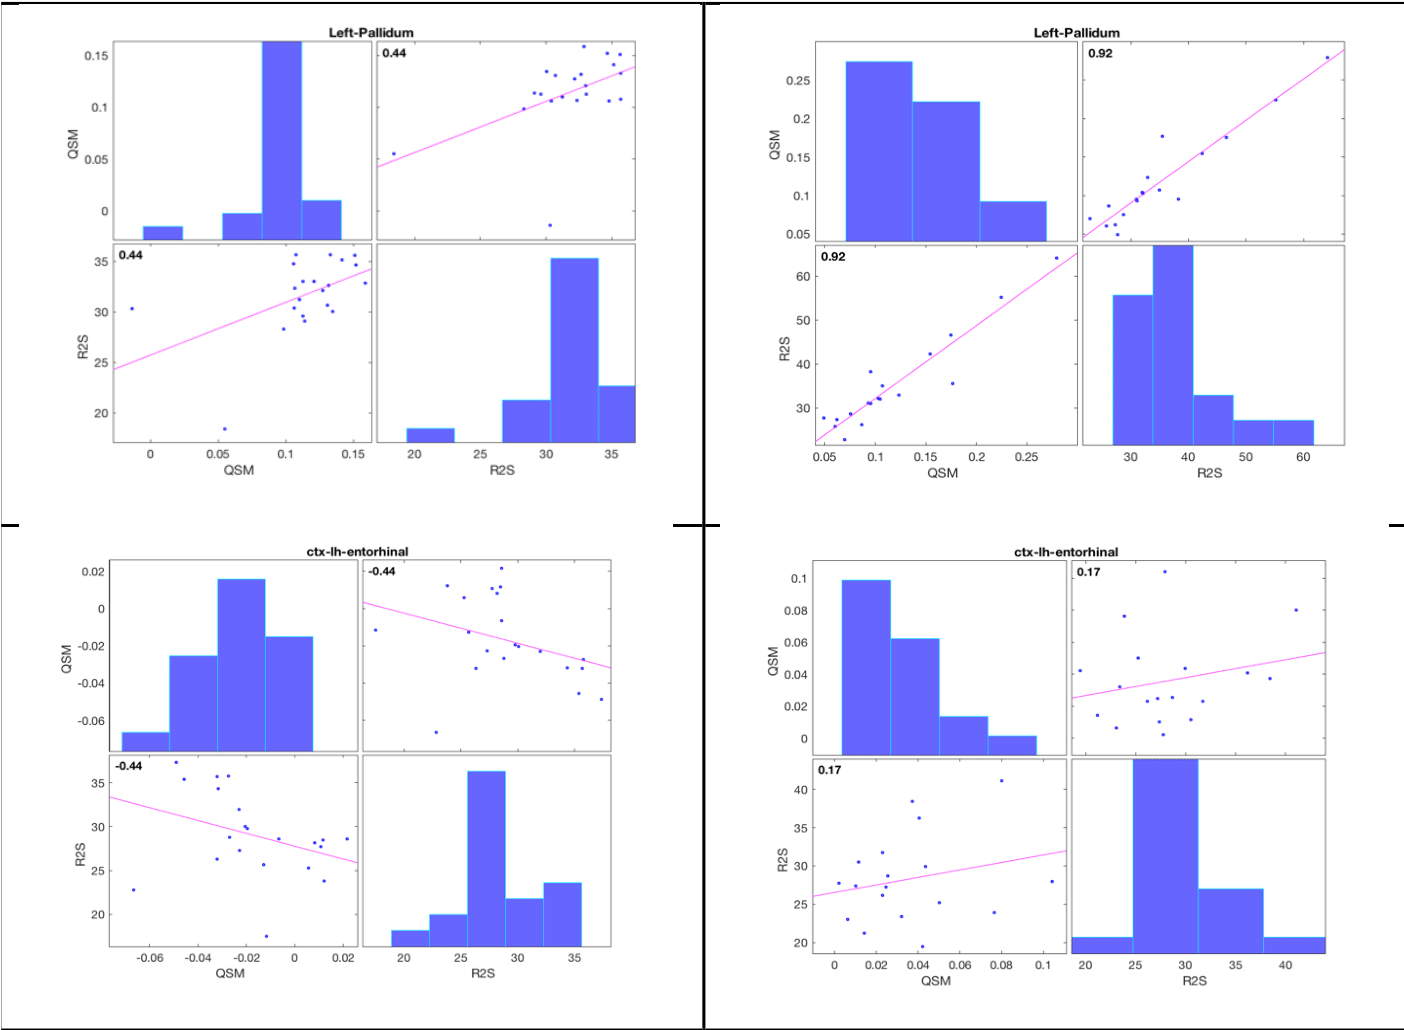
The HD “demyelination hypothesis” [6] suggests that earlier myelinated axons (e.g. in striatum), are those most susceptible to myelin breakdown, leading to an excitotoxic process, eventually leading to neuronal death. In the transient phase, an increased density of oligodendrocytes are involved in repairing the myelin damage. Oligodendroglia are the predominant storage of non-heme brain iron (mainly as ferric Fe3+ in ferritin). Oligodendrocytes-associated iron accumulates and likely adds to the neuronal excitotoxicity by promoting free radical toxicity (especially as ferrous Fe2+). Iron’s ability to change its oxidation state between ferrous (Fe2+) and ferric iron (Fe3) is critically important for maintaining the balance between iron intake and storage; the two forms have very different R2* relaxivities but similar influence on susceptibility. Expected effects [12,13] of iron content or form changes, as well as changes in myelin and water content on the two quantitative parameters measured here and their correlations are depicted schematically in Table 2. Fig. 3 shows histograms and correlations (Spearman’s rho listed) of QSM and R2* in healthy controls (left-hand side) versus HD subjects (right-hand side) in pallidum (top row) and enthorhinal cortex (bottom), with suggested interpretations. In conclusion, qMRI is a valuable tool for studying pathological changes of myelin and iron in HD, as demonstrated here using two high-SNR parameters (obtained by averaging maps from 3 GRE scans) sensitive to both aspects, and their correlations.Acknowledgements
We thank Mr. Ricardo Loucao, M.Sc., for help with implementing the data processing pipeline and valuable discussions.References
[1] Fazio et al. 2018 review https://doi.org/10.1007/s11910-018-0890-y.
[2] Björkvist et al. 2008, doi: 10.1084/jem.20080178.
[3] Yuan et al. 2021, doi: 10.3389/fnins.2021.689938
[4] Tai et al. 2007; doi: 10.1093/brain/awm044
[5] Rosas et al. 2012 doi: 10.1001/archneurol.2011.2945
[6] Bartzokis et al. 2007 https://doi.org/10.1007/s11064-007-9352-7 and refs within
[7] http://surfer.nmr.mgh.harvard.edu/fswiki/recon-all
[8] Liu et al. 2018 doi: 10.1002/mrm.26946
[9] Zhang et al. 2019 doi: 10.1016/j.mri.2019.04.003
[10] Pei et al 2014 https://doi.org/10.1002/mrm.25137
[11] SPSS v19.0, Chicago, Illinois, USA.
[12] Birkl et al. 2020 https://doi.org/10.1016/j.neuroimage.2020.117080
[13] Taege et al. 2019 doi: 10.1016/j.neuroimage.2018.11.011
Figures