2672
Probing Cerebello-Cerebral Functional Connectivity in Spinocerebellar Ataxias
Sheeba Anteraper1, Ying Zhang2, Xavier Guell3, Michal Povazan4, Guita Banan5, Romain Valabregue6, Philip Ehses7, Jennifer Faber7, James M Joers2, Chiadi U Onyike4, Peter B Barker4, Jeremy D Schmahmann3, Eva-Maria Ratai3, S H Subramony5, Thomas H Mareci5, Khalaf O Bushara2, Alexandra Durr6, Thomas Klockgether7, Tetsuo Ashizawa8, Christophe Lenglet2, and Gülin Öz2
1Carle Foundation Hospital, Champaign, IL, United States, 2University of Minnesota, Minneapolis, MN, United States, 3Massachusetts General Hospital, Boston, MA, United States, 4Johns Hopkins University, Baltimore, MD, United States, 5University of Florida, Gainesville, FL, United States, 6Sorbonne University, Paris, France, 7German Center for Neurodegenerative Diseases, Bonn, Germany, 8The Houston Methodist Research Institute, Houston, TX, United States
1Carle Foundation Hospital, Champaign, IL, United States, 2University of Minnesota, Minneapolis, MN, United States, 3Massachusetts General Hospital, Boston, MA, United States, 4Johns Hopkins University, Baltimore, MD, United States, 5University of Florida, Gainesville, FL, United States, 6Sorbonne University, Paris, France, 7German Center for Neurodegenerative Diseases, Bonn, Germany, 8The Houston Methodist Research Institute, Houston, TX, United States
Synopsis
Spinocerebellar Ataxias (SCAs) are a group of rare, autosomal dominant diseases that result in progressive degeneration of the cerebellum. Of these, SCA1 is the fastest progressing. SCA3, the most prevalent SCA worldwide, is relentlessly progressive, disabling, and eventually fatal with no efficacious treatments other than supportive therapy. There is a strong need to improve our mechanistic understanding of the changes in the cerebello-cerebral circuitry prior to disease manifestation so that novel therapeutic strategies can be developed. Analyzing high quality magnetic resonance imaging data from the NIH-funded project, “Clinical Trial Readiness for SCA1 and SCA3 (READISCA),” will guide such efforts.
INTRODUCTION
Spinocerebellar Ataxias (SCAs) 1 and 3 are relentlessly progressive, disabling, and eventually fatal neurodegenerative diseases that primarily affect the cerebellum and its connections. For the reliable implementation of disease modifying cerebellar-based therapeutics, a thorough understanding of cerebello-cerebral functional circuitry and disease causing mechanisms is imperative. However, a significant knowledge gap exists in our functional understanding of cerebellar systems1. There is a particular need to determine whether abnormalities in cerebello-cerebral resting-state functional connectivity (RsFc) precede the manifestation of symptoms in SCAs.Analyzing high quality magnetic resonance imaging (MRI) data with superior spatio-temporal resolution from the NIH-funded project initiated in 2018, “Clinical Trial Readiness for SCA1 and SCA3 (READISCA),” will guide such efforts aiding clinical translation. In contrast to most prior natural history studies, READISCA (NCT03487367), the first large US-European collaborative SCA project2, includes data from patient cohorts who are premanifest gene carriers with no ataxia (score on the Scale for the Assessment and Rating of Ataxia [SARA] <3; maximum score = 40) and patients who are at early-stage (SARA 3-9). Our goal is to leverage such unique data to improve the mechanistic understanding of the changes in cerebello-cerebral circuitry in SCAs.
Anatomical connections between cerebellar cortex and extracerebellar territories form the basis of cerebellar behavioral neurology and psychiatry. Preliminary studies have demonstrated cerebellar volume reductions that correlate with SARA scores in SCA1 and SCA33,4. Functional MRI has already shown sensitivity to pre-symptomatic changes in neurodegeneration5-7, but the utility of this modality is yet to be validated in the context of SCAs. Therefore, we will first assess cerebellar network alterations in premanifest gene carriers with no ataxia compared to Healthy Controls (HC).
METHODS
Image Pre-Processing: Resting-state functional MRI data from premanifest gene carriers of SCA3 (N=24) and matched HC (N=15) were preprocessed in SPM129 with realignment with respect to the first volume and normalization to MNI space with respect to the EPI template. Additional preprocessing steps were carried out in the CONN Toolbox10. This includes band pass filtering (0.008-0.1 Hz), physiological signal de-noising to eliminate contributions from white matter and cerebrospinal fluid (derived from structural MRI segmentation), and regressing out movement effects and their first-order derivatives along with motion outliers.Seed-based RSFC analysis: In contrast to prior investigations, we employed cerebellar regions of interest (ROIs) generated from functional gradient extremes derived from high spatio-temporal resolution resting state fMRI dataset from the Human Connectome Project (N = 1003)8. Three seed ROIs were selected based on the two principal gradients configuring the gradual organization of cerebellar functional regions: from motor to task-unfocused regions (gradient 1), and from task-focused to task-unfocused regions (gradient 2) (see figure), as described previously8. Binary masks of voxels from gradient extremes defined ROI1 (gradient 1, top 5% values) as corresponding to default mode network (DMN) processing; ROI2 (gradient 2, top 5% values) corresponding to attentional networks including frontoparietal network, dorsal attention network, ventral attention network; and ROI3 (gradient 2, bottom 5% values) corresponding to motor processing. For first-level seed-based RsFc analysis, Pearson’s correlation coefficients were computed between the seed time-series and time-series of the rest of the voxels in the brain volume. Whole-brain seed-to-voxel r-maps from the first-level were then transformed to z-maps (Fisher’s r-to-z transform) and voxelwise general linear model analysis was conducted on connectivity values at the second level for within-group (HC, premanifest) and between-group comparisons. Statistical significance thresholding for between-group effects were p < 0.005 (two-tailed) at the voxel level and p < 0.05 False Discovery Rate (FDR) correction at the cluster level.
RESULTS
Contrasting cerebellar ROIs corresponding to DMN, significant cerebello-cerebral RsFc differences were found in regions corresponding to cerebral cortical DMN such as medial pre-frontal and posterior cingulate cortices. Other two cerebellar ROIs did not reveal any results at this threshold, speaking to the alterations in DMN prior to ataxia manifestation.DISCUSSION
Over the past decade, structural and functional MRI studies have substantiated the non-motor functions of cerebellum and its involvement in cognitive and affective processing. Lesions to the cerebellar vermis and the posterior lobe frequently induce the “cerebellar cognitive affective syndrome” – a condition characterized by emotional lability, impaired social cognition, depressed mood, deficits in executive functioning and linguistic processing. Also, isolated cerebellar injury or degeneration is sufficient to produce motor, cognitive, and affective deficits4-6. The fact that we are seeing significant RsFc alterations in cerebral cortex DMN in HC versus premanifest gene carriers serve as a building ground for future longitudinal analyses and validation in independent datasets.CONCLUSION
Our results highlight the sensitivity of baseline resting-state fMRI to detect presymptomatic changes in premanifest gene carriers (no ataxia) compared to HC. Subjects were scanned annually from 2018 (within ±2 weeks of the clinical study visit), for a total of 3 scans. We will further investigate the individual differences in ataxia severity (SARA) (motor symptoms) and cerebellar cognitive affective syndrome (CCAS, non-motor symptoms) to examine brain-behavior correlations. In addition, we will test the hypotheses that baseline cerebello-cerebral connectivity, gauged by RsFc may predict motor and non-motor disease progression (as defined by SARA and CCAS respectively). Elucidating the role of cerebello-cerebral networks in premanifest versus early-state SCAs will facilitate for the development of interventions such as non-invasive cerebellar stimulation.Acknowledgements
READISCA Investigators, NIH U01 NS104326.References
- Voogd J. What we do not know about cerebellar systems neuroscience. Front Syst Neurosci. 2014;8:227.
- Lin CC, Ashizawa T, Kuo SH. Collaborative Efforts for Spinocerebellar Ataxia Research in the United States: CRC-SCA and READISCA. Front Neurol. 2020;11:902.
- Adanyeguh IM, Perlbarg V, Henry PG, Rinaldi D, Petit E, Valabregue R, Brice A, Durr A, Mochel F. Autosomal dominant cerebellar ataxias: Imaging biomarkers with high effect sizes. Neuroimage Clin. 2018;19:858-67.
- Reetz K, Costa AS, Mirzazade S, Lehmann A, Juzek A, Rakowicz M, Boguslawska R, Schols L, Linnemann C, Mariotti C, Grisoli M, Durr A, van de Warrenburg BP, Timmann D, Pandolfo M, Bauer P, Jacobi H, Hauser TK, Klockgether T, Schulz JB, axia Study Group I. Genotype-specific patterns of atrophy progression are more sensitive than clinical decline in SCA1, SCA3 and SCA6. Brain. 2013;136(Pt 3):905-17.
- Agosta F, Weiler M, Filippi M. Propagation of pathology through brain networks in neurodegenerative diseases: from molecules to clinical phenotypes. CNS Neurosci Ther. 2015;21(10):754-67.
- Sheline YI, Raichle ME. Resting state functional connectivity in preclinical Alzheimer's disease. Biol Psychiatry. 2013;74(5):340-7.
- Sorg C, Gottler J, Zimmer C. Imaging Neurodegeneration: Steps Toward Brain Network-Based Pathophysiology and Its Potential for Multi-modal Imaging Diagnostics. Clin Neuroradiol. 2015;25 Suppl 2:177-81.
- Guell X, Schmahmann JD, Gabrieli J, Ghosh SS. Functional gradients of the cerebellum. Elife. 2018;7.
- K Friston. Human brain function, 2nd Edition al. Fe, editor.
- Whitfield-Gabrieli S, Nieto-Castanon A. Conn: a functional connectivity toolbox for correlated and anticorrelated brain networks. Brain Connect. 2012;2(3):125-41.
- Guell X, Hoche F, Schmahmann JD. Metalinguistic deficits in patients with cerebellar dysfunction: empirical support for the dysmetria of thought theory. Cerebellum. 2015;14(1):50-8.
- Hoche F, Guell X, Sherman JC, Vangel MG, Schmahmann JD. Cerebellar Contribution to Social Cognition. Cerebellum. 2016;15(6):732-43.
- Schmahmann JD, Sherman JC. The cerebellar cognitive affective syndrome. Brain. 1998;121 ( Pt 4):561-79.
Figures
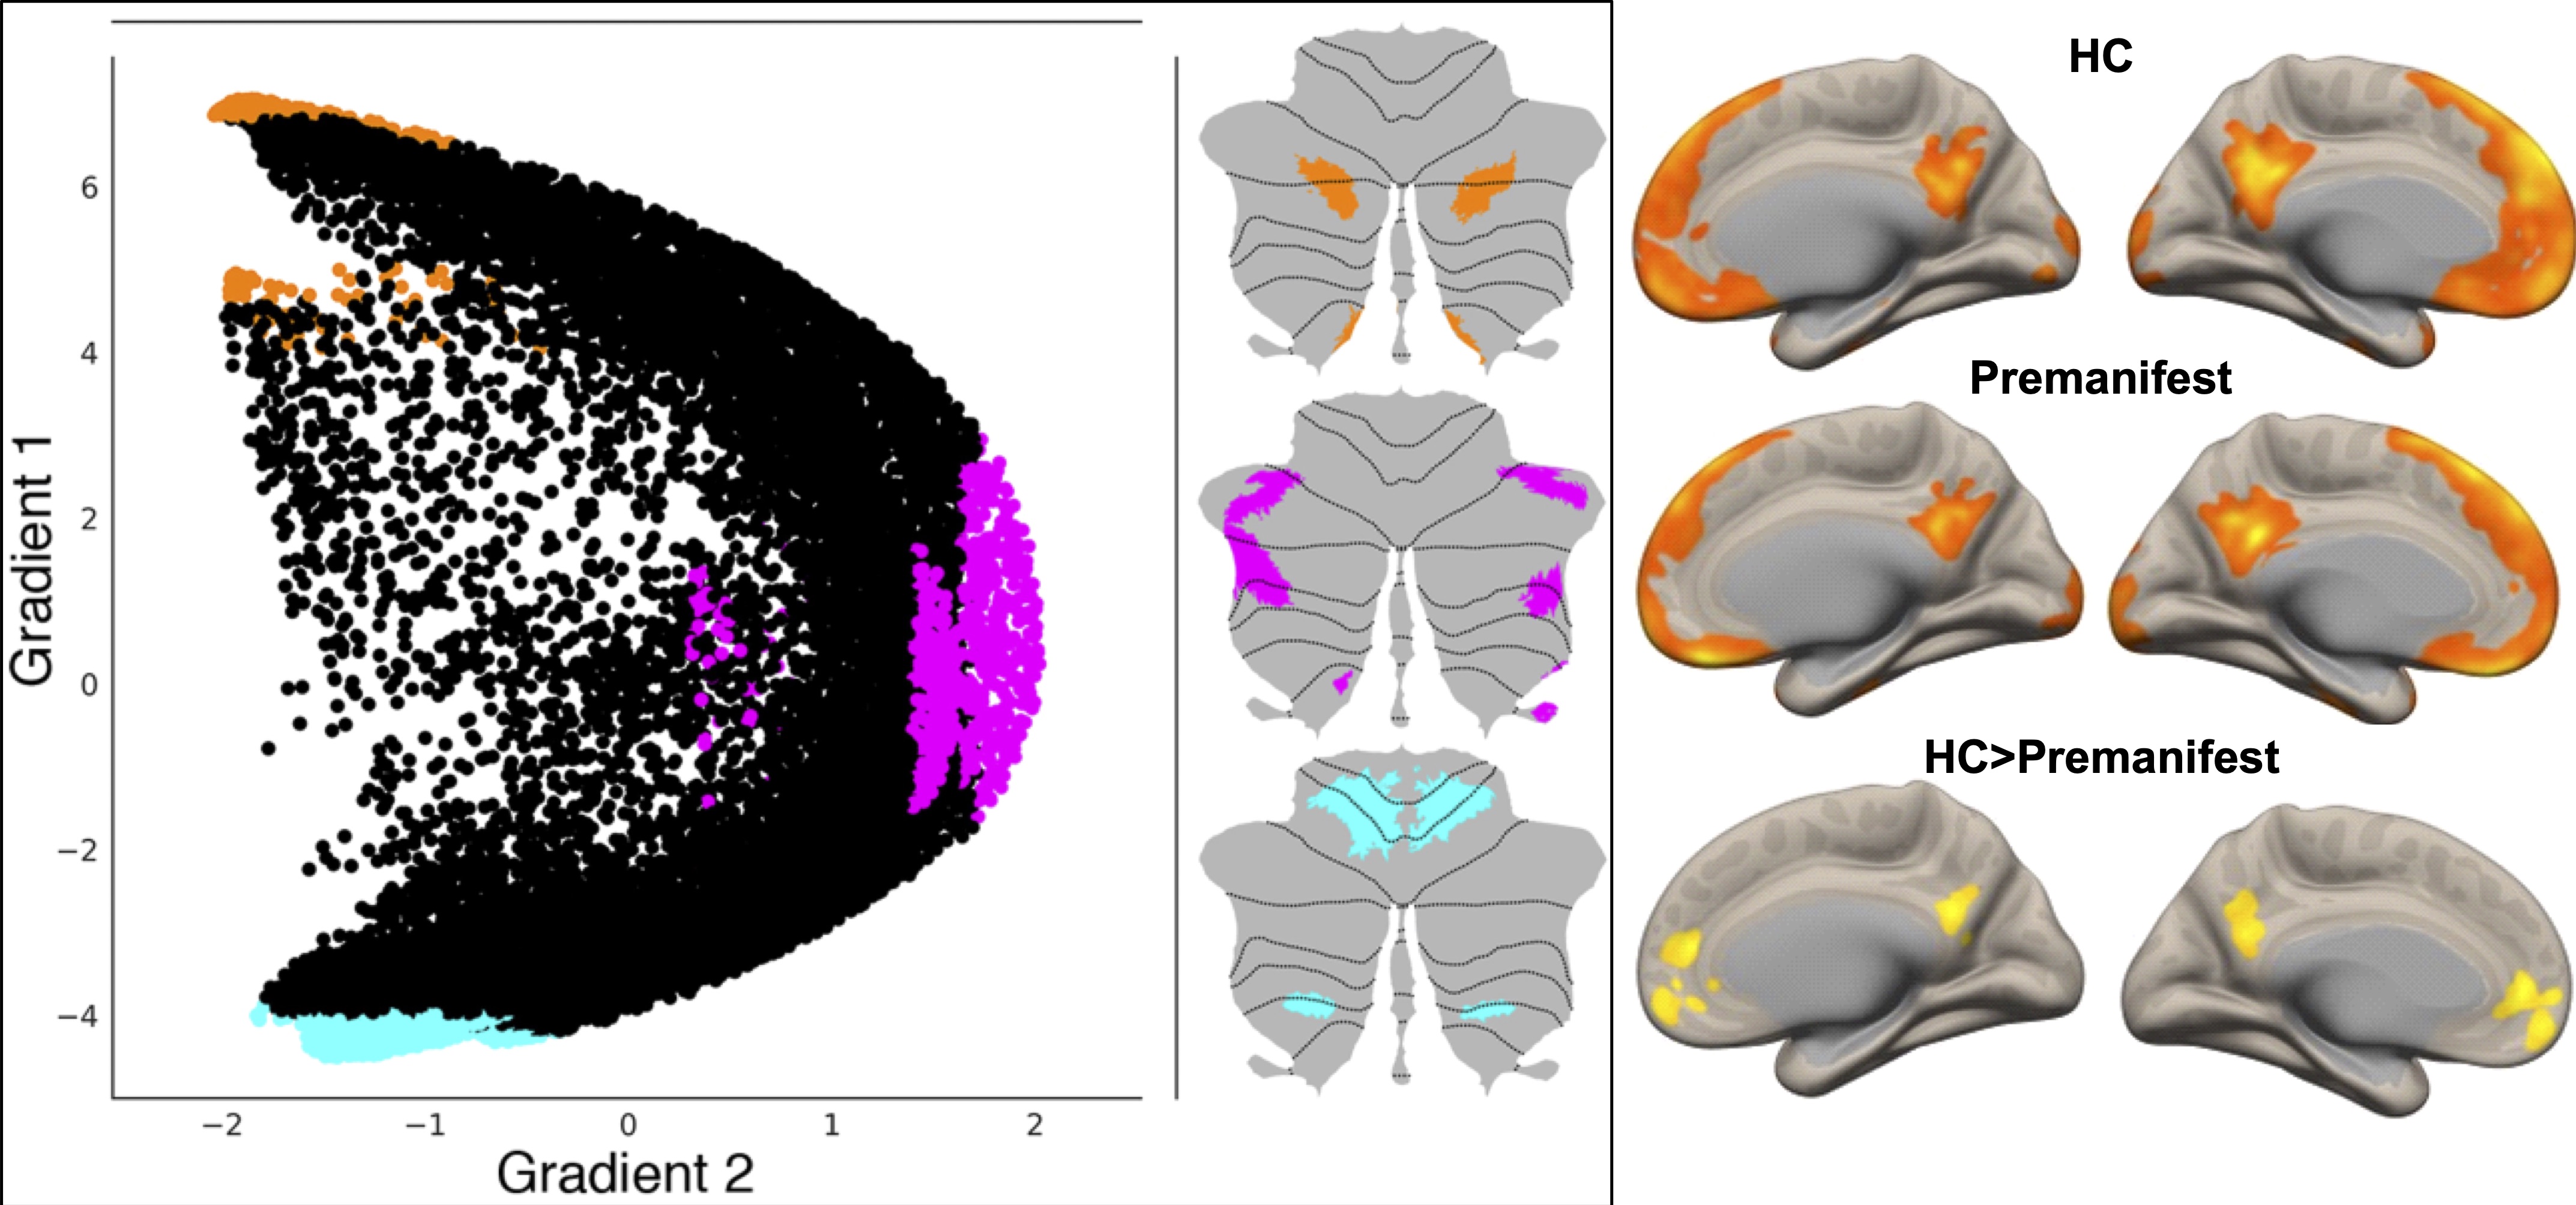
Left: Three maps are generated to locate gradient extremes at motor and nonmotor representation. Orange, pink and cyan colors depict gradient 1 top 5% values within nonmotor areas (VI/Crus I, contiguous Crus II/VIIB, and IX, X), gradient 2 top 5% values within nonmotor areas (VI/Crus I, Crus II/VIIB, and IX, X), and gradient 1 lowest 5% values within motor areas (I-VI and VIII), respectively8. Right: Direct comparison of RsFc from cerebellar DMN ROI in HC vs. premanifest SCA3 reveals cerebral-cortical RsFc alterations in the DMN (medial pre-frontal and posterior cingulate cortices).
DOI: https://doi.org/10.58530/2022/2672