2668
Intravoxel incoherent motion diffusion-weighted imaging for monitoring the anti-angiogenesis efficacy in a C6 glioma rat model1the First Affiliated Hospital of Anhui Medical University, Hefei, China, 2Anhui Medical University, Hefei, China, 3GE Healthcare, Shanghai, China
Synopsis
The purpose of this study was to investigate the feasibility of intravoxel incoherent motion (IVIM) diffusion-weighted imaging (DWI) in evaluating early effects of antiangiogenic therapy in a C6 glioma rat model. Twenty-six glioma orthotopic rat models were successfully established 14-16 days after C6 cell inoculation and randomly divided into two groups. The rats in the treated group were administered with Bev while the rats in the control group were administered with vehicle. IVIM-DWI showed significantly decreased D* values and increased ADC and D values corresponding to histological staining in Bev treated tumors.
Purpose
The purpose of this study was to investigate the feasibility of intravoxel incoherent motion (IVIM) diffusion-weighted imaging (DWI) in evaluating early effects of antiangiogenic therapy in a C6 glioma rat model.1,2Methods
Twenty-six glioma orthotopic rat models were successfully established 14-16 days after C6 cell inoculation and randomly divided into two groups. The rats in the treated group were administered with Bev while the rats in the control group were administered with vehicle (0.9% physiological saline) for 7 days. MRI scans were obtained on days 0, 1, 3, 5, and 7 after treatment, and the quantitative parameters (D,D* and f) of IVIM-DWI were dynamically observed. The tumor volume and average tumor growth rates of rat model was calculated based on T2WI. Histological assessment of HE,CD34,PCNA and Hif1-αstaining were performed on day 7 after antiangiogenic therapy of Bev and vehicle. The ANOVA test was used to compare IVIM-DWI parameters among the 5 time points in treated and control group respectively. The independent-Samples T test was used to compare IVIM-DWI parameters between treated and control groups.The Pearson correlation or Spearman correlation tests were used to analyze the correlation between parameters and histological assessment in the treated group.Results
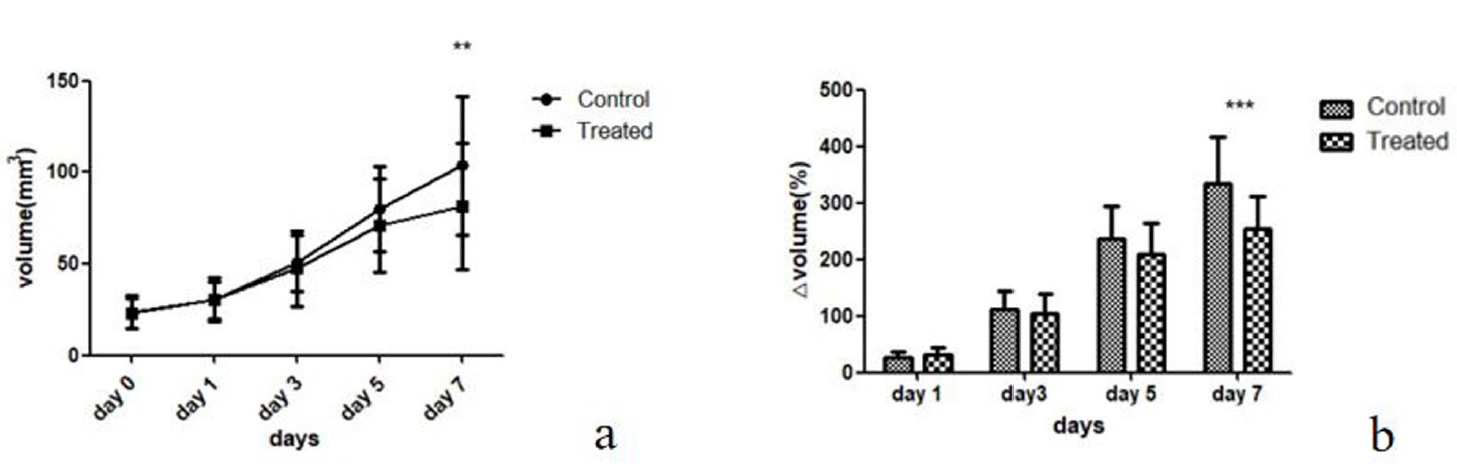
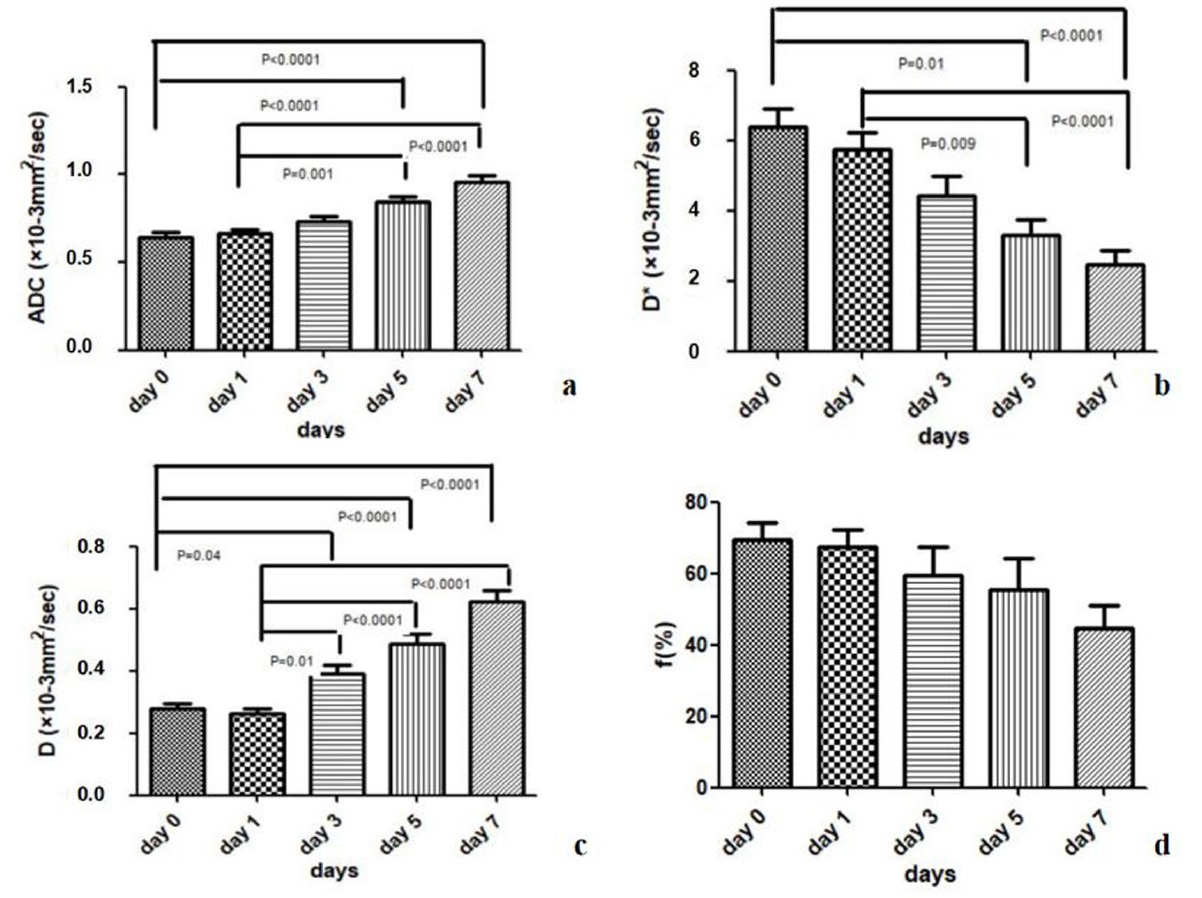
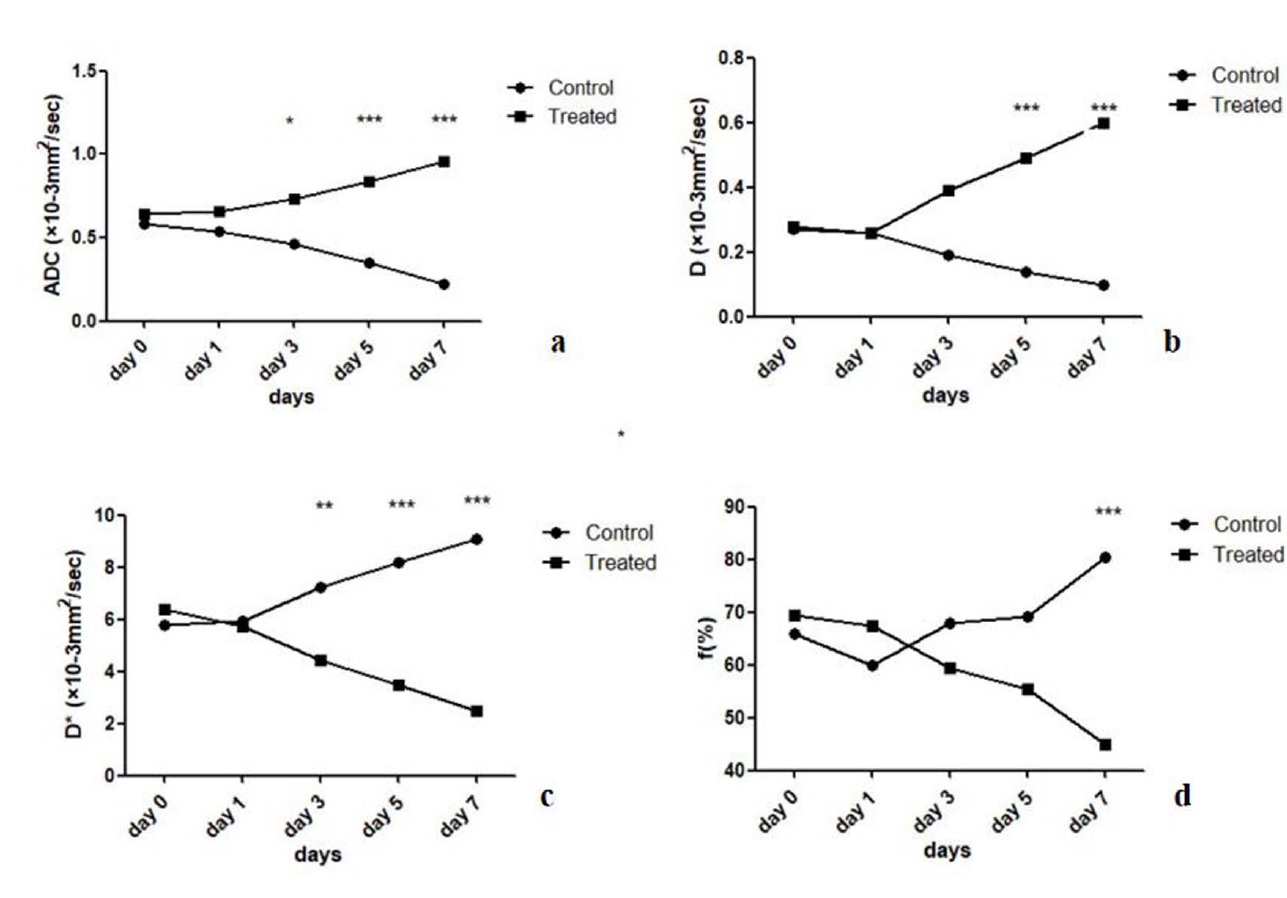
After treatment with Bev, the average tumor growth rate in the two groups also differed significantly on day 7 (P = 0.042 and P < 0.001 respectively) (Fig.1). The perfusion-related parameters D* and f decreased in the treated group and demonstrated significant difference with control group on days 3,5 and 7. The diffusion-related parameters ADC and D increased in the treated group and demonstrated significant difference with control group on days 5 and 7 (Fig.2). The ADC,D,D* values all displayed significant difference among the five time points in both both the treated and control group (all P < 0.001) . For intergroup analyses,the ADC and D values in the treated group were higher than that in the control group since day 3 (all P < 0.001),the D* values in the treated group were significantly lower than those in the control group on days 3, 5, and 7 (P = 0.005, P < 0.001, and P < 0.001, respectively) (Fig.3). D* showed positive correlations with MVD (r = 0.886, P = 0.019), while ADC and D showed negative correlation with PCNA (r = -0.848,P = 0.033;r = -0.928,P = 0.008),and D and D* showed negative correlation with PCNA (r = -0.926,P = 0.003;r = -0.879,P = 0.008).Discussion and Conclusion
IVIM-DWI showed significantly decreased D* values and increased ADC and D values corresponding to histological staining in Bev treated tumors. It was sensitive and precise in predicting the effects of early anti-angiogenesis therapy in a C6 glioma rat model.Acknowledgements
No acknowledgement found.References
1. Folkman J. Role of angiogenesis in tumor growth and metastasis. Semin Oncol. 2002;29:15–18.
2. Kim MM, Umemura Y, Leung D. Bevacizumab and glioblastoma: Past, present, and future directions. Cancer J. 2018;24:180–186.
Figures