2667
Anatomical, functional and dynamic MRI features of the G144 GBM model developed in NOD-SCID mice1Instituto de Investigaciones Biomédicas Alberto Sols (CSIC-UAM), Madrid, Spain, 2CNC - Center for Neuroscience and Cell Biology, CIBB - Centre for Innovative Biomedicine and Biotechnology, University of Coimbra, IIIUC - Institute for Interdisciplinary Research, Coimbra, Portugal, 3Department of Life Sciences, University of Coimbra, Coimbra, Portugal, 4Centro de Química de Coimbra, Faculdade de Ciências e Tecnologia, University of Coimbra, Coimbra, Portugal
Synopsis
Preclinical models are needed to study glioblastoma multiforme, the most lethal malignant brain tumor. Human G144-glioblastoma stem cells have been used in in vitro studies but there are few studies in vivo, especially using MRI approaches. We aimed to evaluate in vivo, for the first time to our knowledge, a G144 glioblastoma model by multiparametric-MRI. NOD-SCID mice were orthotopically injected with G144 cells, tumor was characterized by multiparametric-MRI and dynamic contrast enhancement studies. G144 tumors presented heterogeneous imaging pattern compared to other GBM models with higher contrast uptake areas and edema related features.
Introduction:
Glioblastoma multiforme (GBM) is the most lethal malignant brain tumor and also the most frequent1. The overall survival is around 12-15 months even when aggressive treatment is applied2. The need to improve the diagnosis, treatment and early therapy validation of GBM makes preclinical models an important in vivo tool3. Within these, models developed orthotopically are more confident because the tumor model is growing in the microenvironment most similar to the human disease. The human G144 stem cell model has been described to replicate GBM genetics and histopathology in in vitro and in vivo studies4–6 but very few MRI studies have been performed5. Because magnetic resonance imaging is a powerful tool to get structural and functional information of intracranial tumors, the objective of this study was to characterize with multiparametric MRI an orthotopic G144-GBM model developed in immunocompromised mice.Methods:
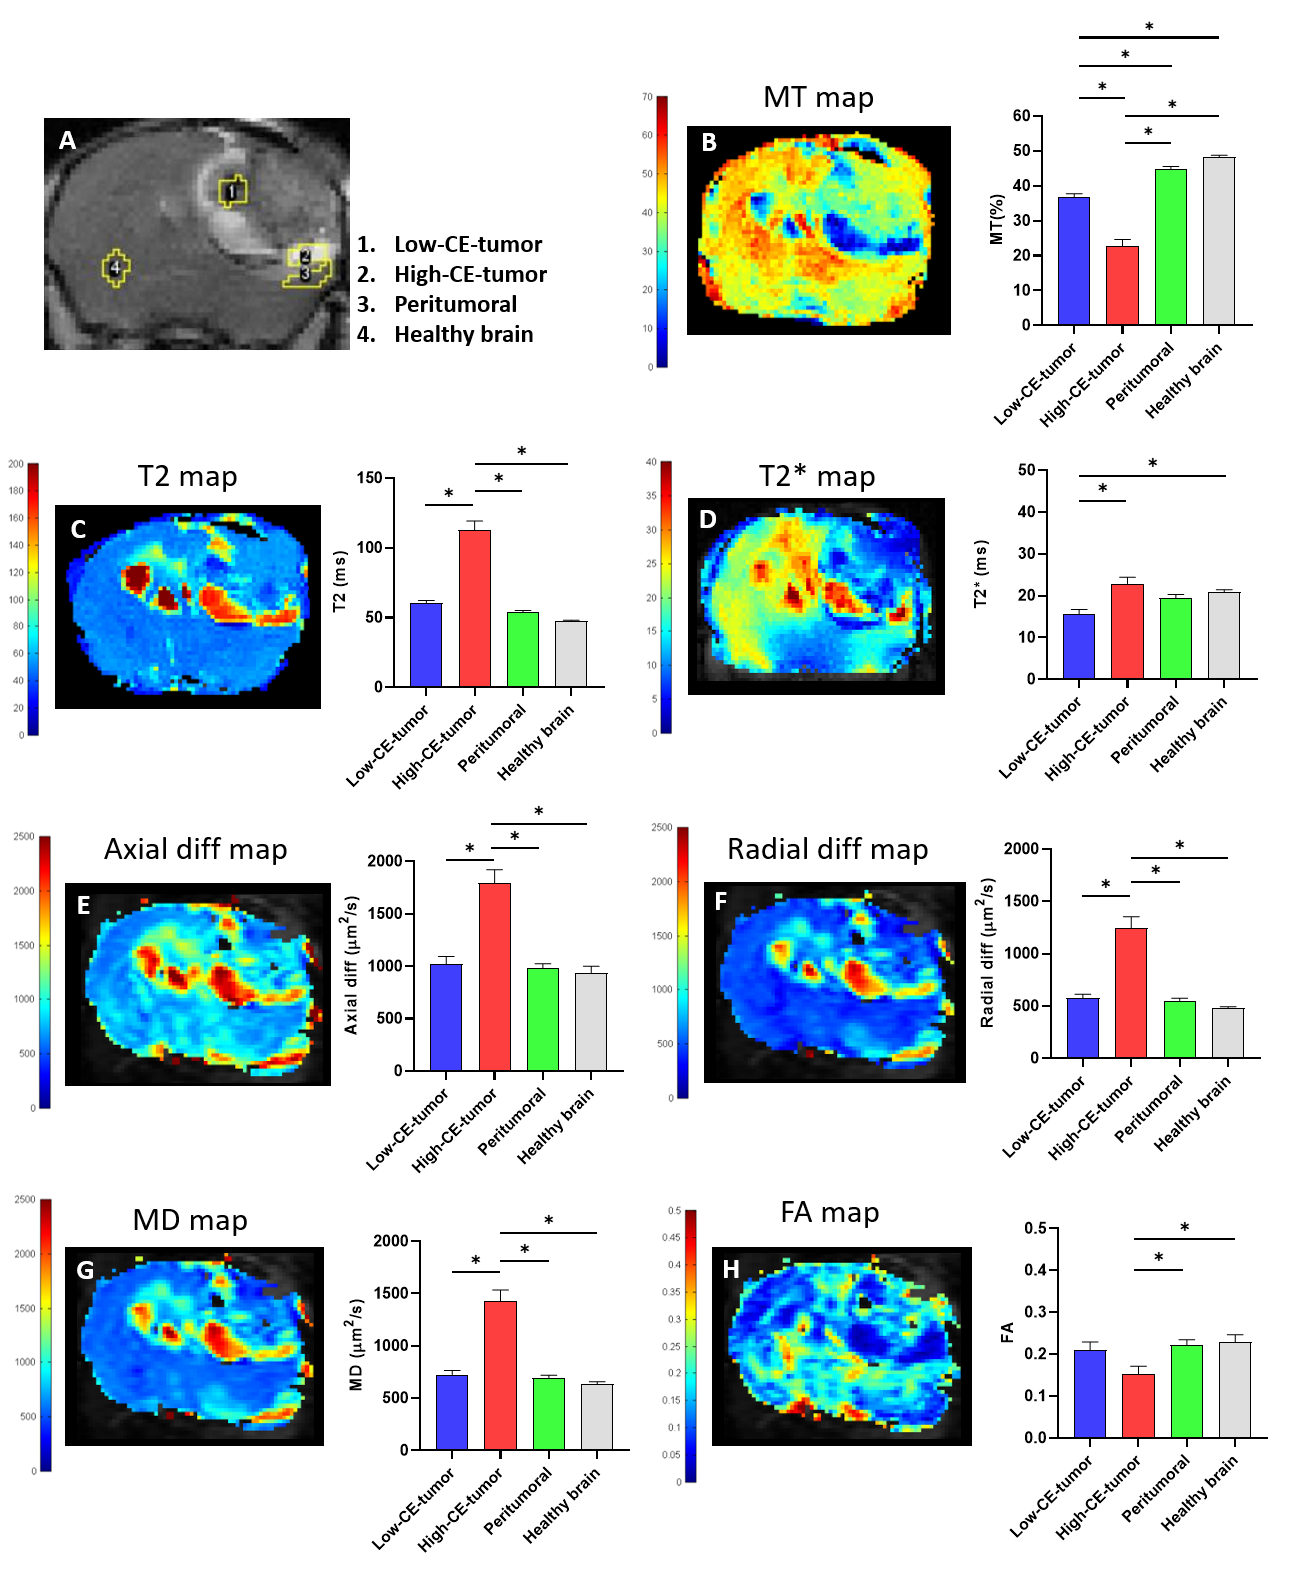
Five NOD-SCID mice were injected orthotopically with 105 G144 cells in the right caudate nucleus. MRI studies were performed in a 7T scanner equipped with a 38-mm diameter 1H selective birdcage resonator and a gradient insert of 90-mm (360 mT/m). GBM development was followed-up with T2 weighted (T2W) images, and multiparametric-MRI studies were performed when the tumor size reached ~70 mm3: Magnetization transfer (MT) images, T2 and T2* maps, diffusion weighted images and dynamic contrast enhancement (DCE) -0.25 mmol/Kg of Gadobutrol (Gadovist®, Bayer) as contrast agent (CA)- were acquired. Parametric maps were generated with My Map Analyzer, a home-made software built in Matlab. Relative contrast enhancement (RCE) and Ktrans maps were obtained using the software DCE@ourlab7. Four regions of Interest (ROIs), high contrast-enhanced tumor area (High-CE-tumor), low-contrast enhanced tumor area (Low-CE-tumor), peritumoral tissue and contralateral apparently healthy brain, were manually selected to quantify the obtained parameters. An extra ROI was also included in the muscle as a reference for DCE studies.Results:
Tumors were detected by T2W MRI around 40 days post cell-injection (p.i.) and the volume to perform the multiparametric-MRI studies was reached between 53 and 104 days p.i. GBM tumors showed heterogeneous appearance in T2W, and T1W images after CA injection (Figure 1). Hyperintensity areas were observed in T2W and in contrast-enhanced T1W (High-CE-tumor) images but not observed in pre-CA T1W in the same region located in the tumor periphery of the representative example showed in Figure 1. Hypointensity spots were also detected in T2W images and in post-CA T1W images indicating hemorrhage. DCE studies showed the progressive and faster accumulation of CA in the High-CE-tumor ROI than in the rest of the ROIs in the RCE maps (Figure 2) and also, the same region showed higher Ktrans values than other ROIs. The region corresponding to Low-CE-tumor showed lower CA accumulation and Ktrans values than High-CE-tumor area. However, Low-CE-tumor also presented higher values than peritumoral and healthy brain but similar to the muscle used as reference.Besides, High-CE-tumor showed higher T2, T2*, axial diffusivity (Axial diff), radial diffusivity (Radial diff) and mean diffusivity (MD), and lower MT and fractional anisotropy (FA) values (Figure 3). Nevertheless, Low-CE-tumor region showed similar values in all these parameters to peritumoral and healthy brain areas (Figure 3).
Discussion:
The structural MRI results point that G144 tumors are more heterogeneous regarding MRI features than other murine preclinical GBM models3. RCE and Ktrans results indicate that High-CE-tumor is a hyper-vascularized area with massive extravasation due to the extensive blood brain barrier (BBB) disruption8,9 compared with Low-CE-tumor area and the other ROIs. However, data obtained with the rest of parametric maps indicate that edema is also present in the High-CE-tumor region with lower MT and FA values and higher MD10, Axial diff, Radial diff11, T212 and T2* map values13. Thus, a combination of edema processes and increased vascularization are taking place in this tumoral region. The tumoral region of the tumor which showed lower CA uptake, suggest that the BBB disruption is less extended in it. This area also showed bleeding spots, frequent in other GBM models14.Conclusion:
As far as we know, this is the first multiparametric-MRI study of a GBM humanized orthotopic mouse model established from G144 cells. This GBM model shows a very heterogeneous imaging pattern and the results suggest the existence of inflammatory processes and angiogenesis occurring in the High-CE-tumor area. In order to improve the knowledge of this GBM model, MRI parameters comparisons with other humanized and non-humanized GBM models are needed, not only regarding on imaging characterization but also to evaluate the response to different therapeutic approaches.Acknowledgements
References
1. Alifieris, C. & Trafalis, D. T. Glioblastoma multiforme: Pathogenesis and treatment. Pharmacol. Ther. 152, 63–82 (2015).
2. Stupp, R. et al. Radiotherapy plus concomitant and adjuvant temozolomide for glioblastoma. N. Engl. J. Med. 352, 987–96 (2005).
3. Borges, A. R., Lopez-Larrubia, P., Marques, J. B. & Cerdan, S. G. MR imaging features of high-grade gliomas in murine models: How they compare with human disease, reflect tumor biology, and play a role in preclinical trials. American Journal of Neuroradiology vol. 33 24–36 (2012).
4. Pollard, S. M. et al. Glioma Stem Cell Lines Expanded in Adherent Culture Have Tumor-Specific Phenotypes and Are Suitable for Chemical and Genetic Screens. Cell Stem Cell 4, 568–580 (2009). 5. Haynes, H. R. et al. shRNA‐mediated PPARα knockdown in human glioma stem cells reduces in vitro proliferation and inhibits orthotopic xenograft tumour growth. J. Pathol. 247, 422–434 (2019).
6. Sadahiro, H. et al. Pathological features of highly invasive glioma stem cells in a mouse xenograft model. Brain Tumor Pathol. 31, 77–84 (2014).
7. Ortuño, J. E. et al. DCE@urLAB: a dynamic contrast-enhanced MRI pharmacokinetic analysis tool for preclinical data. BMC Bioinformatics 14, 316 (2013).
8. Dubois, L. G. et al. Gliomas and the vascular fragility of the blood brain barrier. Front. Cell. Neurosci.8, 418 (2014).
9. Gordon, Y. et al. Dynamic contrast-enhanced magnetic resonance imaging: fundamentals and application to the evaluation of the peripheral perfusion. Cardiovasc. Diagn. Ther. 4, 147–14764 (2014).
10. Pérez-Carro, R., Cauli, O. & López-Larrubia, P. Multiparametric magnetic resonance in the assessment of the gender differences in a high-grade glioma rat model. EJNMMI Res. 4, 44 (2014).
11. Winklewski, P. J. et al. Understanding the physiopathology behind axial and radial diffusivity changes-what do we Know? Frontiers in Neurology vol. 9 92 (2018).
12. Radbruch, A. et al. Relevance of T2 signal changes in the assessment of progression of glioblastoma according to the Response Assessment in Neurooncology criteria. Neuro. Oncol. 14, 222–229 (2012).
13. Ding, G. et al. Angiogenesis detected after embolic stroke in rat brain using magnetic resonance T2*WI. Stroke 39, 1563–1568 (2008).
14. Haddad, A. F. et al. Mouse models of glioblastoma for the evaluation of novel therapeutic strategies. Neuro-Oncology Adv. 3, (2021).
Figures
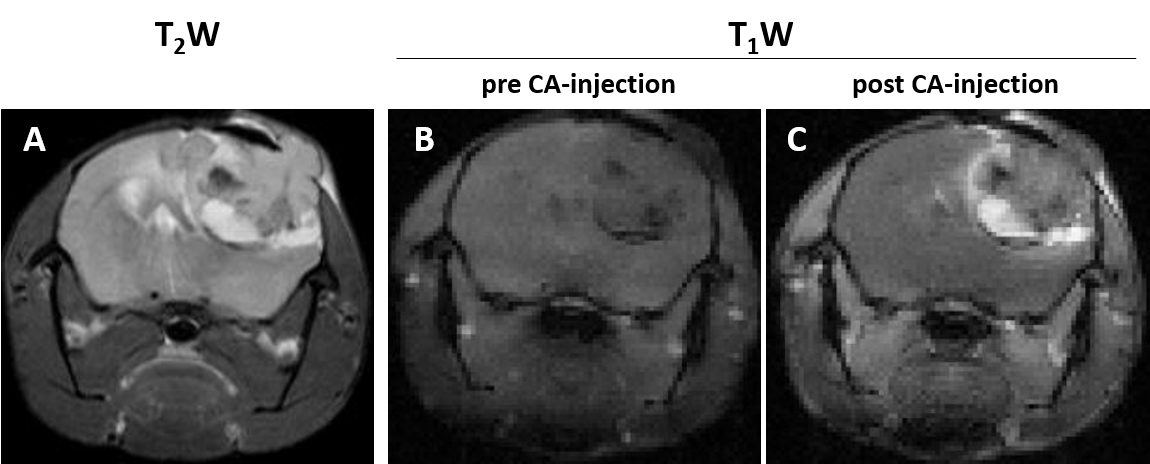
MRI in axial orientation of a representative mouse injected with G144 cells. A. T2W image. B. T1W image before CA injection. C. T1W image after CA injection.
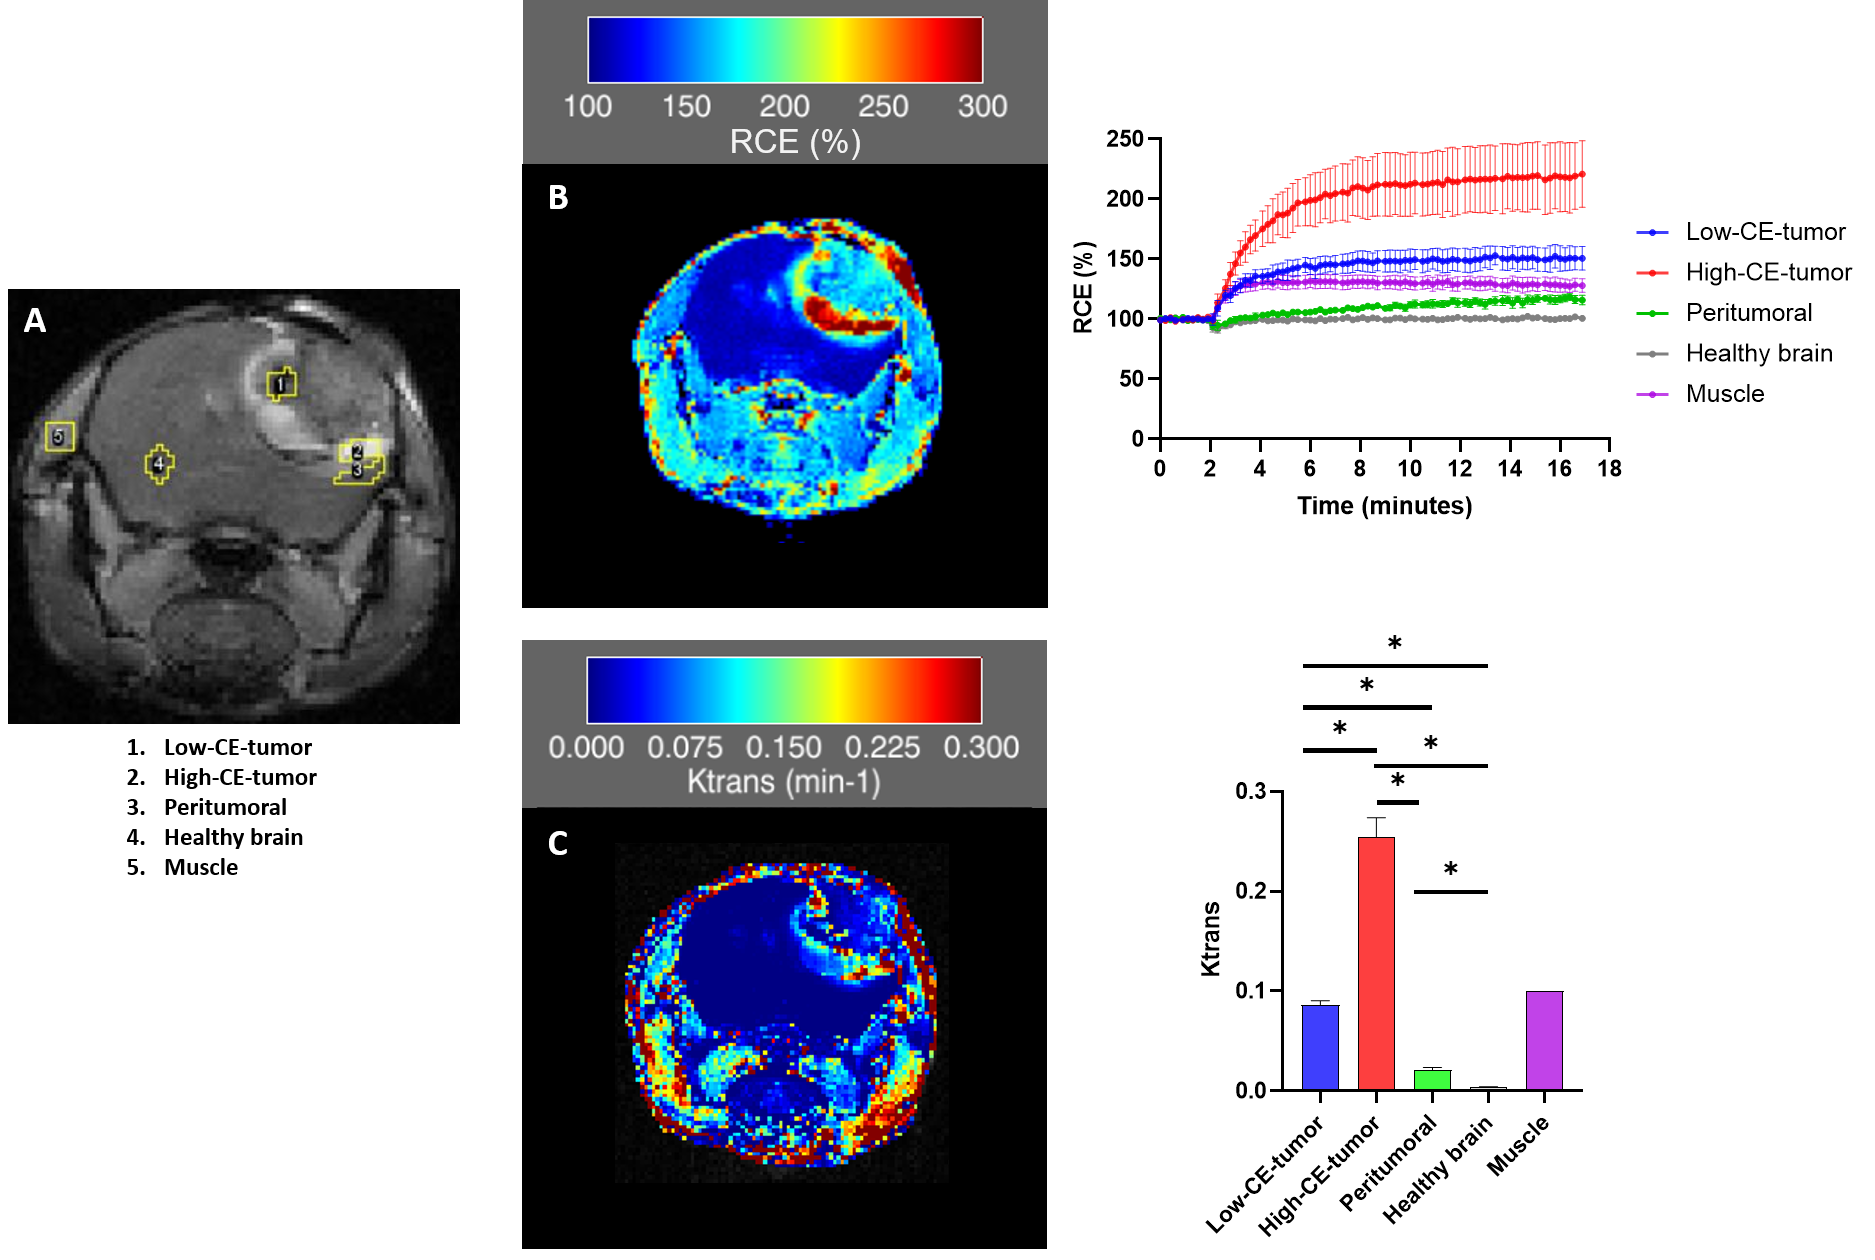
A. T1W axial image after CA injection of a representative mouse injected with G144 cells. RCE was calculated from the ROIs depicted in yellow. B. An example of a RCE map generated from a representative DCE study and the percentage of RCE (Mean ± SEM) obtained from the different ROIs of the studied mice (n=5). C. An example of a Ktrans map generated from the same representative case and Ktrans values (Mean ± SEM) obtained from the different ROIs of the studied mice (n=5). Muscle is the reference ROI (Ktrans= 0.1). * p< 0.05.