2666
Tumor microvasculature and microenvironment characterization in mouse models of pancreatic ductal adenocarcinoma using multiparametric MRI1Medical Physics, Memorial Sloan Kettering Cancer Center, New York, NY, United States, 2Radiology, Memorial Sloan Kettering Cancer Center, New York, NY, United States
Synopsis
Pancreatic ductal adenocarcinoma (PDAC) is expected to be the second cause of cancer-related deaths worldwide. Quantitative multiparametric magnetic resonance imaging (mpMRI) provides the complementary physiological properties of tumors tissue. The aim of this study was to characterize microvasculature and microenvironment in mouse models of PDAC using mpMRI. The functional status of mpMRI quantitative imaging metrics were validated with in vivo histology markers of tumor perfusion (Hoechst 33342) and tissue morphology (Hematoxylin and eosin staining).
Purpose
Pancreatic ductal adenocarcinoma (PDAC) is the second leading cause of cancer-related death in the United States [1]. PDAC consists of an abundant extracellular matrix (ECM) and desmoplastic stroma [2] . The stroma, a hallmark of PDAC, forms a major barrier for effective drug delivery. Recently, multiparametric (mp) magnetic resonance imaging (MRI) was used to assess changes in tumor microenvironment in a mouse model of PDAC [3]. Quantitative diffusion-weighted (DW)- and dynamic contrast-enhanced (DCE)-MRI have shown promise for differentiation and monitoring responses to therapy in mouse models of PDAC [4,5]. PDAC studies in clinical settings exhibited similar results [6,7]. To extract robust quantitative imaging biomarkers (QIBs) in heterogeneous tumor tissue, the optimal model selection approach is needed for DW and DCE data analysis [8,9]. This study aimed to characterize the tumor microvasculature and microenvironment using mpMRI in a mouse model of PDAC.Methods
Animals and Tumor Models: All procedures involving animals were approved by the Institutional Animal Care and Use Committee of Memorial Sloan Kettering Cancer Center. Tumors were established by injecting 2×10⁵ KPC 4662 subcutaneously into the right shoulder region of athymic mice (n=5). The cells were originally derived from a murine pancreatic tumor, genotype Pdx1-Cre;LSL KRASG12D;Trp53R172H/wt. The mpMRI of was performed 10-12 days after tumor inoculation.MRI Data Acquisition: MRI was performed on a 9.4 T (Bruker BioSpin MRI GmbH) with ParaVision 360.1 operating software. T2-weighted images were acquired (Bruker RARE sequence) with TR/TE= 2092.34/33 ms, FOV=30×30 mm2, NA=2, NS=20, slice thickness=0.7 mm, slice gap=0.7 mm, and acquisition matrix size (MS)=256×256. These images were used to locate the tumor for the selection of DW and DCE-MRI slices. Diffusion-weighted images were acquired with 7 different b-values (0, 20, 80, 100, 200, 400, 700 s/mm2), TR/TE = 1500/ 20.12 ms, NS = 8-10; MS = 192x96, NA =1, slice thickness=0.8 mm and gap=1.05 mm. The DCE-MRI series were acquired using a FLASH sequence with TR/TE=54.63/1.29 ms, NA=1, NS=6, flip angle (FA)=15°, MS=132×106, and temporal resolution 5.79 s, resulting in a total acquisition time of 14 min 38 s. After acquisition of 20 precontrast images, 0.1 mL of contrast agent was injected at a constant rate via tail vein catheter. The precontrast T1w images for T10 mapping were acquired using four different TR values, i.e. 100 ms, 200 ms, 800 ms, and 2000 ms. Other scanning parameters were the same as mentioned above.
Histology: Tumor-bearing mice were injected i.v. with 0.1 ml Hoechst 33342 (10 mg/ml in saline) and euthanized by CO2 inhalation after 1 minute. Tumors were removed, frozen in OCT, and sectioned at 10 um thickness. Fluorescent images of unfixed sections were acquired using an Olympus microscope, where blue fluorescence indicates the presence of perfused vessels. Sections were subsequently stained with hematoxylin and eosin (H&E), according to the manufacturer’s instructions, and reimaged on brightfield.
Image Analysis: Regions of interest (ROIs) were drawn on DW- and DCE-MRI images using ITK-SNAP. The DW data was fitted to a monoexponential model which yields the apparent diffusion coefficient (ADC) (mm2/s) [10] and intravoxel incoherent motion (IVIM) modeling method which provides estimates of true and pseudo diffusion coefficients (D and D* [mm2/s]) and perfusion fraction (f) [11]. For DCE, the arterial input function (neck carotid artery), dynamic images, and T10 values were incorporated into the standard Tofts and extended Tofts model (TM: Ktrans [min-1] and ve) and ETM: Ktrans [min-1], ve, and vp), and fast exchange regime (FXR: Ktrans (min-1, ve, and mean lifetime of intracellular water protons, τi [s]). The corrected Akaike information criterion (AICc) [12] was used to examine the fitting performance of each pharmacokinetic model [13].
Results
Tables 1 and 2 show the metric value from DW and DCE-MRI data modeling (Figure 1). FXR model yielded the smallest AICc, 63.89% of the total voxels (i.e., 22246) in comparison to ETM (25.66%) and TM (8.45 %) (Table 2), respectively. Parametric maps of Ktrans, ADC, and D, ve, and ti exhibited the functional status of tumor microvasculature, microenvironment, and cellular metabolic activity (Figure 2). The in vivo histology markers Hoechst 33342 and H&E stained images showed that the tumors have an immature vasculature with heterogeneous perfusion (Figure 3a) and tissue morphologies (Figure 3b). Representative DCE model fit plot and the corresponding models percentage of pixel value with the smallest AICc are shown in Figure 4.The QIBs of tumor cellularity, ADC (D) and the leakage space (ve) were positively correlated (r= 0.42 for ADC and 0.53 for D) (Figure 5) and D and τi were negatively correlated (r=-0.42).Discussion
The intratumoral differences in the tumor microenvironment are associated with the amount of tumor cells and stroma. A positive correlation between ADC (D) and ve indicated accumulation of cystic areas within the tumor. The model selection approach is implemented to identify the most-robust optimal model QIBs to underpin tumor characteristics. Tumor functional status and heterogeneity exhibited by the parametric maps is validated by in vivo histology markers of tumor vasculature (Hoechst 33342) and tissue morphology (H&E staining).Conclusion
The present study suggests that QIBs derived from mpMRI may be pivotal to evaluate the physiological changes associated with response to therapy in PDAC.Acknowledgements
We acknowledge funding support from NCI R01 CA194321.References
1. Siegel, R.L.; Miller, K.D.; Fuchs, H.E.; Jemal, A. Cancer statistics, 2021. CA: a cancer journal for clinicians 2021, 71, 7-33. 2. Provenzano, P.P.; Hingorani, S.R. Hyaluronan, fluid pressure, and stromal resistance in pancreas cancer. British journal of cancer 2013, 108, 1-8, doi:10.1038/bjc.2012.569. 3. Vohra, R.; Park, J.; Wang, Y.N.; Gravelle, K.; Whang, S.; Hwang, J.H.; Lee, D. Evaluation of pancreatic tumor development in KPC mice using multi-parametric MRI. Cancer Imaging 2018, 18, 41, doi:10.1186/s40644-018-0172-6. 4. Trajkovic-Arsic, M.; Heid, I.; Steiger, K.; Gupta, A.; Fingerle, A.; Worner, C.; Teichmann, N.; Sengkwawoh-Lueong, S.; Wenzel, P.; Beer, A.J.; et al. Apparent Diffusion Coefficient (ADC) predicts therapy response in pancreatic ductal adenocarcinoma. Sci Rep 2017, 7, 17038, doi:10.1038/s41598-017-16826-z. 5. Cao, J.; Pickup, S.; Clendenin, C.; Blouw, B.; Choi, H.; Kang, D.; Rosen, M.; O'Dwyer, P.J.; Zhou, R. Dynamic Contrast-enhanced MRI Detects Responses to Stroma-directed Therapy in Mouse Models of Pancreatic Ductal Adenocarcinoma. Clin Cancer Res 2019, 25, 2314-2322, doi:10.1158/1078-0432.CCR-18-2276. 6. Choi, S.Y.; Kim, S.H.; Kang, T.W.; Song, K.D.; Park, H.J.; Choi, Y.H. Differentiating Mass-Forming Autoimmune Pancreatitis From Pancreatic Ductal Adenocarcinoma on the Basis of Contrast-Enhanced MRI and DWI Findings. Am J Roentgenol 2016, 206, 291-300, doi:10.2214/Ajr.15.14974. 7. Kinh Do, R.; Reyngold, M.; Paudyal, R.; Oh, J.H.; Konar, A.S.; LoCastro, E.; Goodman, K.A.; Shukla-Dave, A. Diffusion-Weighted and Dynamic Contrast-Enhanced MRI Derived Imaging Metrics for Stereotactic Body Radiotherapy of Pancreatic Ductal Adenocarcinoma: Preliminary Findings. Tomography 2020, 6, 261-271, doi:10.18383/j.tom.2020.00015. 8. Merisaari, H.; Laakso, H.; Liljenback, H.; Virtanen, H.; Aronen, H.J.; Minn, H.; Poutanen, M.; Roivainen, A.; Liimatainen, T.; Jambor, I. Statistical Evaluation of Different Mathematical Models for Diffusion Weighted Imaging of Prostate Cancer Xenografts in Mice. Front Oncol 2021, 11, 583921, doi:10.3389/fonc.2021.583921. 9. Ewing, J.R.; Bagher‐Ebadian, H. Model selection in measures of vascular parameters using dynamic contrast‐enhanced MRI: experimental and clinical applications. NMR in Biomedicine 2013, 26, 1028-1041. 10. Chenevert, T.L.; Stegman, L.D.; Taylor, J.M.; Robertson, P.L.; Greenberg, H.S.; Rehemtulla, A.; Ross, B.D. Diffusion magnetic resonance imaging: an early surrogate marker of therapeutic efficacy in brain tumors. JNCI: Journal of the National Cancer Institute 2000, 92, 2029-2036. 11. Le Bihan, D.; Breton, E.; Lallemand, D.; Grenier, P.; Cabanis, E.; Laval-Jeantet, M. MR imaging of intravoxel incoherent motions: application to diffusion and perfusion in neurologic disorders. Radiology 1986, 161, 401-407, doi:10.1148/radiology.161.2.3763909. 12. Akaike, H. New Look at Statistical-Model Identification. Ieee T Automat Contr 1974, Ac19, 716-723, doi:Doi 10.1109/Tac.1974.1100705. 13. Paudyal, R.; Lu, Y.; Hatzoglou, V.; Moreira, A.; Stambuk, H.E.; Oh, J.H.; Cunanan, K.M.; Aramburu Nunez, D.; Mazaheri, Y.; Gonen, M.; et al. Dynamic contrast-enhanced MRI model selection for predicting tumor aggressiveness in papillary thyroid cancers. NMR Biomed 2020, 33, e4166, doi:10.1002/nbm.4166.
Figures
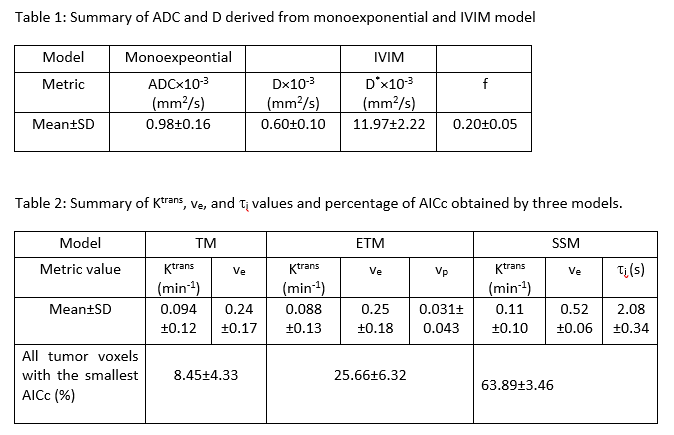
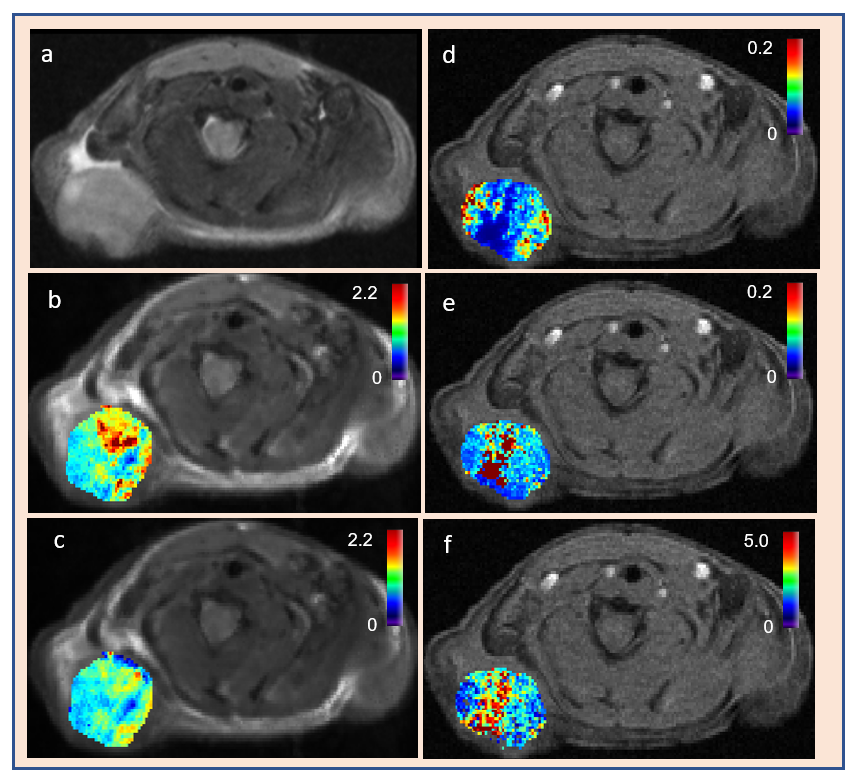
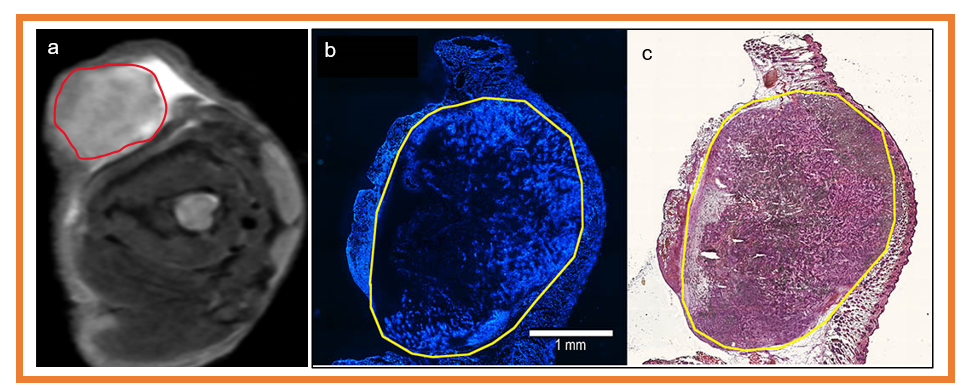
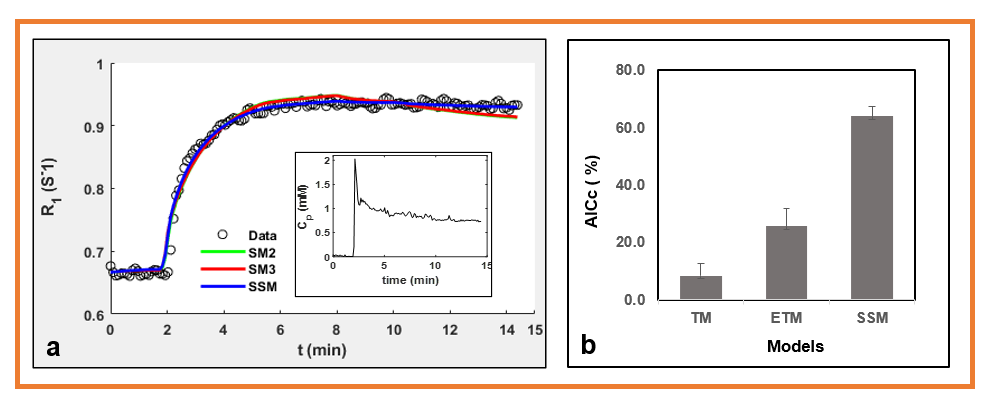
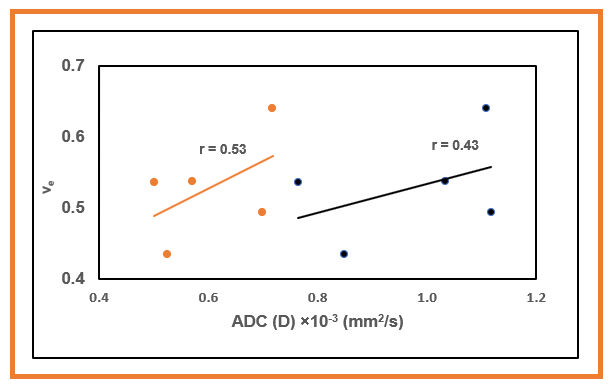
Figure 5. Graphs showing the relationship between apparent and true tissue diffusion coefficients (ADC and D) with volume fraction of the extravascular extracellular space (ve). ADC and D were derived from monoexponential and intravoxel incoherent motion modeling of diffusion weighted imaging data. ve was obtained from fast exchange regime model (ve) in mouse model of pancreatic ductal adenocarcinoma.