2664
Development of noninvasive DCE based method to estimate tumor interstitial Fluid Pressure in Mouse Models for Pancreatic Ductal Adenocarcinoma
Ramesh Paudyal1, Eve LoCastro1, James Russell1, Ivan Wolansky1, Carl C. Lekaye1, Joseph O. Deasy1, John L. Humm1, and Amita Shukla-Dave1,2
1Medical Physics, Memorial Sloan Kettering Cancer Center, New York, NY, United States, 2Radiology, Memorial Sloan Kettering Cancer Center, New York, NY, United States
1Medical Physics, Memorial Sloan Kettering Cancer Center, New York, NY, United States, 2Radiology, Memorial Sloan Kettering Cancer Center, New York, NY, United States
Synopsis
Pancreatic cancer accounts for about 3% of all cancer-related deaths in the US. An elevation of interstitial fluid pressure (IFP) is a major barrier to drug delivery in solid tumors. Noninvasive estimation of IFP as a biomarker in typically inaccessible tumors is a significant step toward assessing tumor response to therapy. We applied well-recognized fluid flow in porous media to mouse models of pancreatic ductal adenocarcinoma DCE-MRI data using extended Tofts' model-derived permeability maps with tumor-appropriate tumor geometry. Initial results suggest that after validation, IFP can be imaging biomarkers of early response to therapy.
Purpose
Elevated interstitial fluid pressure (IFP) in solid tumors can cause a substantial barrier to the fluid and macromolecules delivery [1].The pancreatic ductal adenocarcinoma (PDAC) microenvironment comprises stromal cells and an extracellular matrix [2]. The wick-in-needle technique is the gold-standard, but it is an invasive method of measuring tumors IFP [3]. Dynamic contrast-enhanced magnetic resonance imaging (DCE-MRI) has been explored as a potential method for the noninvasive measurement of IFP in preclinical and clinical settings [4-7]. Recently, computational fluid modeling (CFM) method [8] using DCE data has taken special attention for the estimation of IFP [9-12]. This study aims to use DCE MRI-based CFM for estimation of IFP in mouse models of PDAC.Methods
Animals and Tumor Models: All procedures involving animals were approved by the Institutional Animal Care and Use Committee of Memorial Sloan Kettering Cancer Center. Tumors were established by injecting 2×10⁵ KPC 4662 subcutaneously into the right shoulder region of athymic mice (n=4). The cells were originally derived from a murine pancreatic tumor, genotype Pdx1-Cre; LSL KRASG12D; Trp53R172H/wt. The MRI’s were performed 10-12 days after tumor inoculation.MRI Data Acquisition: MRI was performed on a 9.4 T (Bruker BioSpin MRI GmbH). T2-weighted images with TR/ TE= 2092.34/33 ms, FOV=30 ×30 mm2, NA=2, NS=20, slice thickness= 0.7 mm, slice gap=0.7 mm, and acquisition matrix size (MS)=256×256 were used to locate the tumor slices for DCE-MRI slices. The DCE-MRI series were acquired using a FLASH sequence with TR/TE = 54.63/1.29 ms, NA=1, NS=6, flip angle (FA=15°), MS=132×106, and temporal resolution 5.79 s, resulting in a total acquisition time of 14 min 38 s. For precontrast T10, T1w images were acquired using four different TR values, i.e. 100 ms, 200 ms, 800 ms, and 2000 ms. Other scanning parameters were the same as mentioned above. DCE Data Analysis: Tumor regions of interest (ROI’s) were contoured using ITK-SNAP on dynamic images. For estimation of IFP, the volume transfer constant for CA, Ktrans [min-1], derived from the extended Tofts model (ETM) and arterial input function value (obtained from neck artery) were incorporated into the CFM simulation [9, 12].
Computational Theory for IFP: The CFM method is based on transport of CA in porous media providing estimates of IFP [9]. Starling equation of the vascular system consisting of source and sink terms [13] is incorporated into Equation [1] (Figure1), i.e., Darcy velocity, u , and IFP relationship [8 ]. The resulting equation modulated by Ktrans is applied for CFM simulation (Equation [2]) is shown in Figure 1. CFM simulation was performed for Equation [2] using the following model parameters: vessel permeability Lp= 2 × 10⁻¹¹ mPa−1s−1 (in tumor, t) and 3 × 10⁻¹² mPa−1s−1 (in normal tissue, n); lymphatic filtration coefficient LpLSL/V=1 × 10−7 Pa−1 s−1; tissue hydraulic conductivity KH = 1.9 × 10⁻¹² (t), 3.8 × 10⁻¹³ (n) m2 Pa−1 s−1; microvascular surface area-to-volume S/V= 2 × 10⁴ (t), 7 × 10³ (n) m−1; microvascular pressure pv= 2300 Pa; osmotic pressure in microvasculature πv= 2670 Pa; osmatic pressure in interstitial space πi= 3230 (t), 1330 (n) Pa; and osmotic reflection coefficient for plasma σ= 0.82 (t), 0.91 (n) (Unitless).
CFM Simulation: Tumor ROI’s obtained were grayscale-dilated by 20 pixels, forming an extended domain ROI to incorporate normal tissue around tumor. ROI’s for tumor and extended domain were resliced 1mm3-isotropic, converted to STL format, and imported as boundary meshes for the model. The computations use finite element method in COMSOL Multiphysics software (COMSOL Inc., Stockholm, Sweden).
Results
We developed a noninvasive DCE method to estimate IFP for PDAC. ETM derived mean Ktrans and CFM-estimated IFP values from four mice were 0.038±.004 (min -1) and 1.17±0.27 (kPa) respectively. A representative DCE data fitting with ETM is displayed in Figure 2. Representative T2 weighted image, ETM derived Ktrans map, and CFM generated IFP map are shown in Figure 3. Figure 4a shows a scatter plot of total tumor ROI volume vs. IFP. Tumor heterogeneity leading to the subtle differences in IFP values within the tumor are visualized in these maps. A weak positive linear relationship is observed between these metrics (r= 0.31). CFM-estimated IFP exhibited a strong linear relationship with Ktrans (r= 0.90) (Figure 4b). The leakage space, ve, and IFP exhibited weak positive correlation (r= 0.28).Discussion
Ktrans and IFP maps depict heterogeneity within the tumor. IFP is maximum at tumor core and monotonically decreases outwards to the tumor periphery towards the normal tissue. We observed a positive correlation between total tumor volume and IFP, and Ktrans and ve. Elevation of IFP in tumors are thought to be associated with the high vessel permeability and impaired lymphatic drainage from the interstitium. A linear relationship may be highly influenced by the tumor cellularity and stroma, depending on the tumor types [14].Conclusion
After appropriate validation, non-invasive IFP from DCE MRI-based CFM estimate can have promising application in the clinics.Acknowledgements
We acknowledge funding support from NCI R01 CA194321.References
1. Baxter, L.T. and R.K. Jain, Transport of fluid and macromolecules in tumors. I. Role of interstitial pressure and convection. Microvasc Res, 1989. 37(1): p. 77-104. 2.Truong, L.H. and S. Pauklin, Pancreatic Cancer Microenvironment and Cellular Composition: Current Understandings and Therapeutic Approaches. Cancers (Basel), 2021. 13(19). 3. DuFort, C.C., et al., Interstitial pressure in pancreatic ductal adenocarcinoma is dominated by a gel-fluid phase. Biophysical journal, 2016. 110(9): p. 2106-2119. 4. Ellingsen, C., et al., DCE-MRI of the hypoxic fraction, radioresponsiveness, and metastatic propensity of cervical carcinoma xenografts. Radiother Oncol, 2014. 110(2): p. 335-41. 5. Hompland, T., et al., Interstitial fluid pressure and associated lymph node metastasis revealed in tumors by dynamic contrast-enhanced MRI. Cancer research, 2012. 72(19): p. 4899-4908. 6. Elmghirbi, R., et al., Toward a noninvasive estimate of interstitial fluid pressure by dynamic contrast‐enhanced MRI in a rat model of cerebral tumor. Magnetic resonance in medicine, 2018. 80(5): p. 2040-2052. 7. Haider, M.A., et al., Correlations between dynamic contrast-enhanced magnetic resonance imaging-derived measures of tumor microvasculature and interstitial fluid pressure in patients with cervical cancer. Journal of Magnetic Resonance Imaging, 2007. 25(1): p. 153-159. 8. Nield, D.A. and A. Bejan, Convection in porous media. Vol. 3. 2006: Springer. 9. Pishko, G.L., et al., Sensitivity analysis of an image-based solid tumor computational model with heterogeneous vasculature and porosity. Ann Biomed Eng, 2011. 39(9): p. 2360-73. 10. Steuperaert, M., et al., A 3D CFD model of the interstitial fluid pressure and drug distribution in heterogeneous tumor nodules during intraperitoneal chemotherapy. Drug Deliv, 2019. 26(1): p. 404-415. 11. Bhandari, A., et al., Perfusion kinetics in human brain tumor with DCE-MRI derived model and CFD analysis. Journal of Biomechanics, 2017. 59: p. 80-89. 12.Paudyal, R., et al., Longitudinal Monitoring of Simulated Interstitial Fluid Pressure for Pancreatic Ductal Adenocarcinoma Patients Treated with Stereotactic Body Radiotherapy. Cancers, 2021. 13(17): p. 4319. 13. Starling, E.H., On the absorption of fluids from the connective tissue spaces. The Journal of physiology, 1896. 19(4): p. 312-326. 14. Hompland, T., et al., Assessment of the interstitial fluid pressure of tumors by dynamic contrast-enhanced magnetic resonance imaging with contrast agents of different molecular weights. Acta Oncol, 2013. 52(3): p. 627-35.Figures
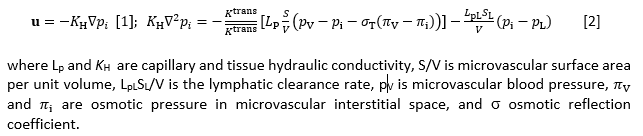
Figure 1. Representative equations for computational fluid modeling method
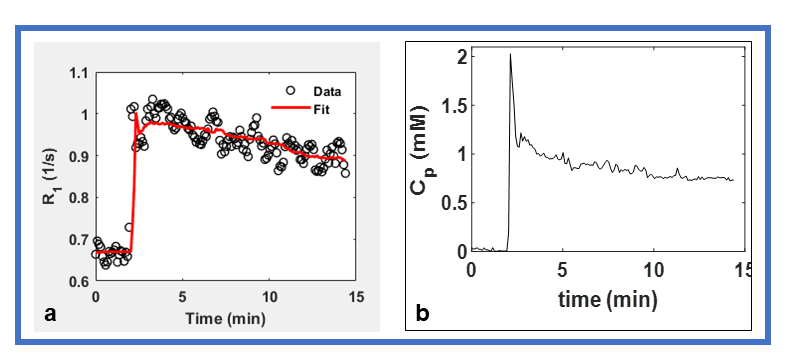
Figure
2. Plot of the time course of (a)
longitudinal relaxation rate, R1 (1/s) for one enhancing pixel
obtained from a region of interest (ROI) within tumor (Figure 3) (b) arterial input function obtained from neck artery.
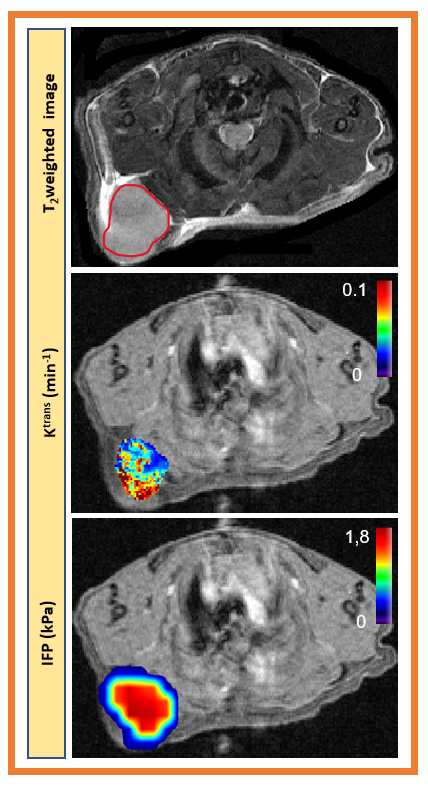
Figure 3.
a). Representative T2 weighted image outlined with tumor
region. Parametric maps of b). volume transfer constant, Ktrans,
(min-1) derived from extended Tofts model and c). CFM estimated
interstial fluid pressure (IFP). Ktrans
and CFM maps are overlaid on precontrast T1w images. For CFM simulation the tumor lesion was extend
to normal region. Both maps depicted tumor heterogeneity.
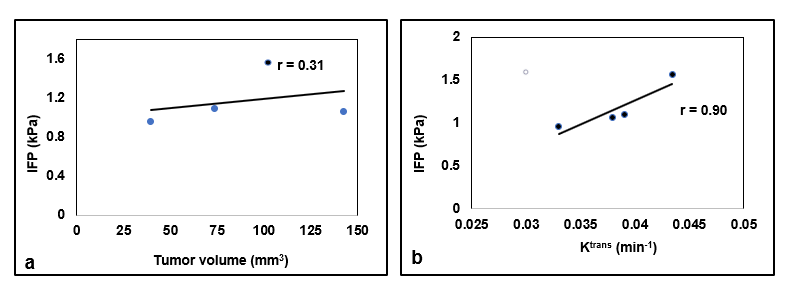
Figure 4. Graphs show a scatter plot
between CFM estimated interstial fluid pressure (IFP [kPa]) and tumor volume (a)
and IFP and volume transfer constant for a contrast agent, Ktrans
(b).
DOI: https://doi.org/10.58530/2022/2664