2663
Contrast Enhanced Imaging of Apelin Effects on Vascularization of Orthotopic Glioblastoma in Mice1Nuclear Medicine, School of Medicine, Klinikum rechts der Isar, Technical University of Munich, Munich, Germany, 2Neurosurgical Research, University Hospital, LMU Munich, Munich, Germany
Synopsis
Mice with orthotopically implanted glioblastoma were imaged during contrast injection, with the goals of establishing semi-quantitative DCE in this model and to investigate the impact of apelin-controlled tumour angiogenesis. Wild-type mice with control U87 tumours showed higher initial contrast accumulation but also faster washout compared to apelin knockout mice implanted with apelin knockdown tumour cells, consistent with apelin contributing to tumour vascularization. Control and apelin knockout mice had low contrast accumulation with genetically engineered human glioma-initiating cells.
Introduction
Vascular density and function are important factors affecting the treatment response in glioblastoma (GBM). DCE MRI is used to characterize GBM clinically, based mainly on contrast enhancing or non-enhancing regions, the molecular causes of which are poorly understood(1).Expression of the secretory peptide apelin is upregulated in tumor vessels and radially oriented neoplastic cells in GBM(2). Knockdown of apelin (AKD) expression in tumor cells decreases tumor vessel density in GBM mouse models. The combination of apelin-depleted AKD tumor cells with loss-of-vascular apelin expression in apelin-knockout mice (APLNKO) leads to synergistic anti-angiogenic effects and blocked pathological vascularization(3,4).
U87 is a patient-derived GBM cell line that demonstrates high vascular density and compact tumour growth, but does not fully reproduce clinical pathology. Control (U87NSC) and apelin knockdown (U87AKD) lines are available(4). Genetically-engineered human glioma-initiating cells (hGICs) produce less angiogenic but invasive GBM(3).
The goals of this study are to establish preclinical semi-quantitative DCE MRI biomarkers for vascularity and vessel leakiness in orthotopic GBM models in mice, to characterize the difference between U87 and hGIC tumours, and to investigate how apelin deficient models differ from high apelin-expressing models.
Methods
Tumor Models: Immune-deficient wild-type (WT) mice were injected with 105 U87NSC (N=4) or hGIC cells (N=2), and APLNKO mice were injected with 1x10⁵ U87AKD (N=3) or hGIC cells (N=3), targeting the right caudate putamen of the right brain hemisphere.Hardware: Small animal 7T preclinical scanner (Agilent/GE magnet, Bruker AVANCE III HD electronics), with RF coils (RAPID Biomedical): either a volume resonator (72 mm ID) for RF transmission (Tx) and a rigid surface receiver (Rx) coil array (20 mm diameter), or a volume resonator (31 mm ID) for Rx/Tx.
Screening: T2w MRI to follow tumour development. Well-defined tumours, observed as bright regions at the target location, were selected for DCE MRI. DCE MRI: T1w 3D FLASH images (TR 18.5 ms, FA 20°, 0.25x0.25x1 mm3 voxels, FOV 16x16 mm2, 1 s/frame, 360 frames) were acquired for 10 seconds before, during, and after injection of 1 μmol/g body weight gadopentetate dimeglumine via tail vein catheter.
DCE Analysis: Voxel timecourses were first normalized to their pre-contrast signal averages. Starting from onset of contrast signal changes, T0, semi-quantitative parameters were calculated:
1. AUC120: Area Under the Curve from T0 to T0 + 120 s.
2. Late slope: Linear slope after the trend generally became linear and rapid changes had ceased. Data were fit with an exponential + linear slope model: $$N(t)-1=A\left(1-e^{-Ct}\right)+St$$ where N(t) is the normalized signal at time t after T0, and A, C, and S are fit parameters, with the A and C term (equalling 0 at t=0) fitting rapid changes after contrast administration, and S being the late slope after those rapid changes stabilize.
3. Initial slope: Linear slope fit to data from T0 to T0 + 5 s.
Per-voxel maps of these parameters were averaged with ROIs drawn on tumours, tumour periphery, and contralateral brain.
Results
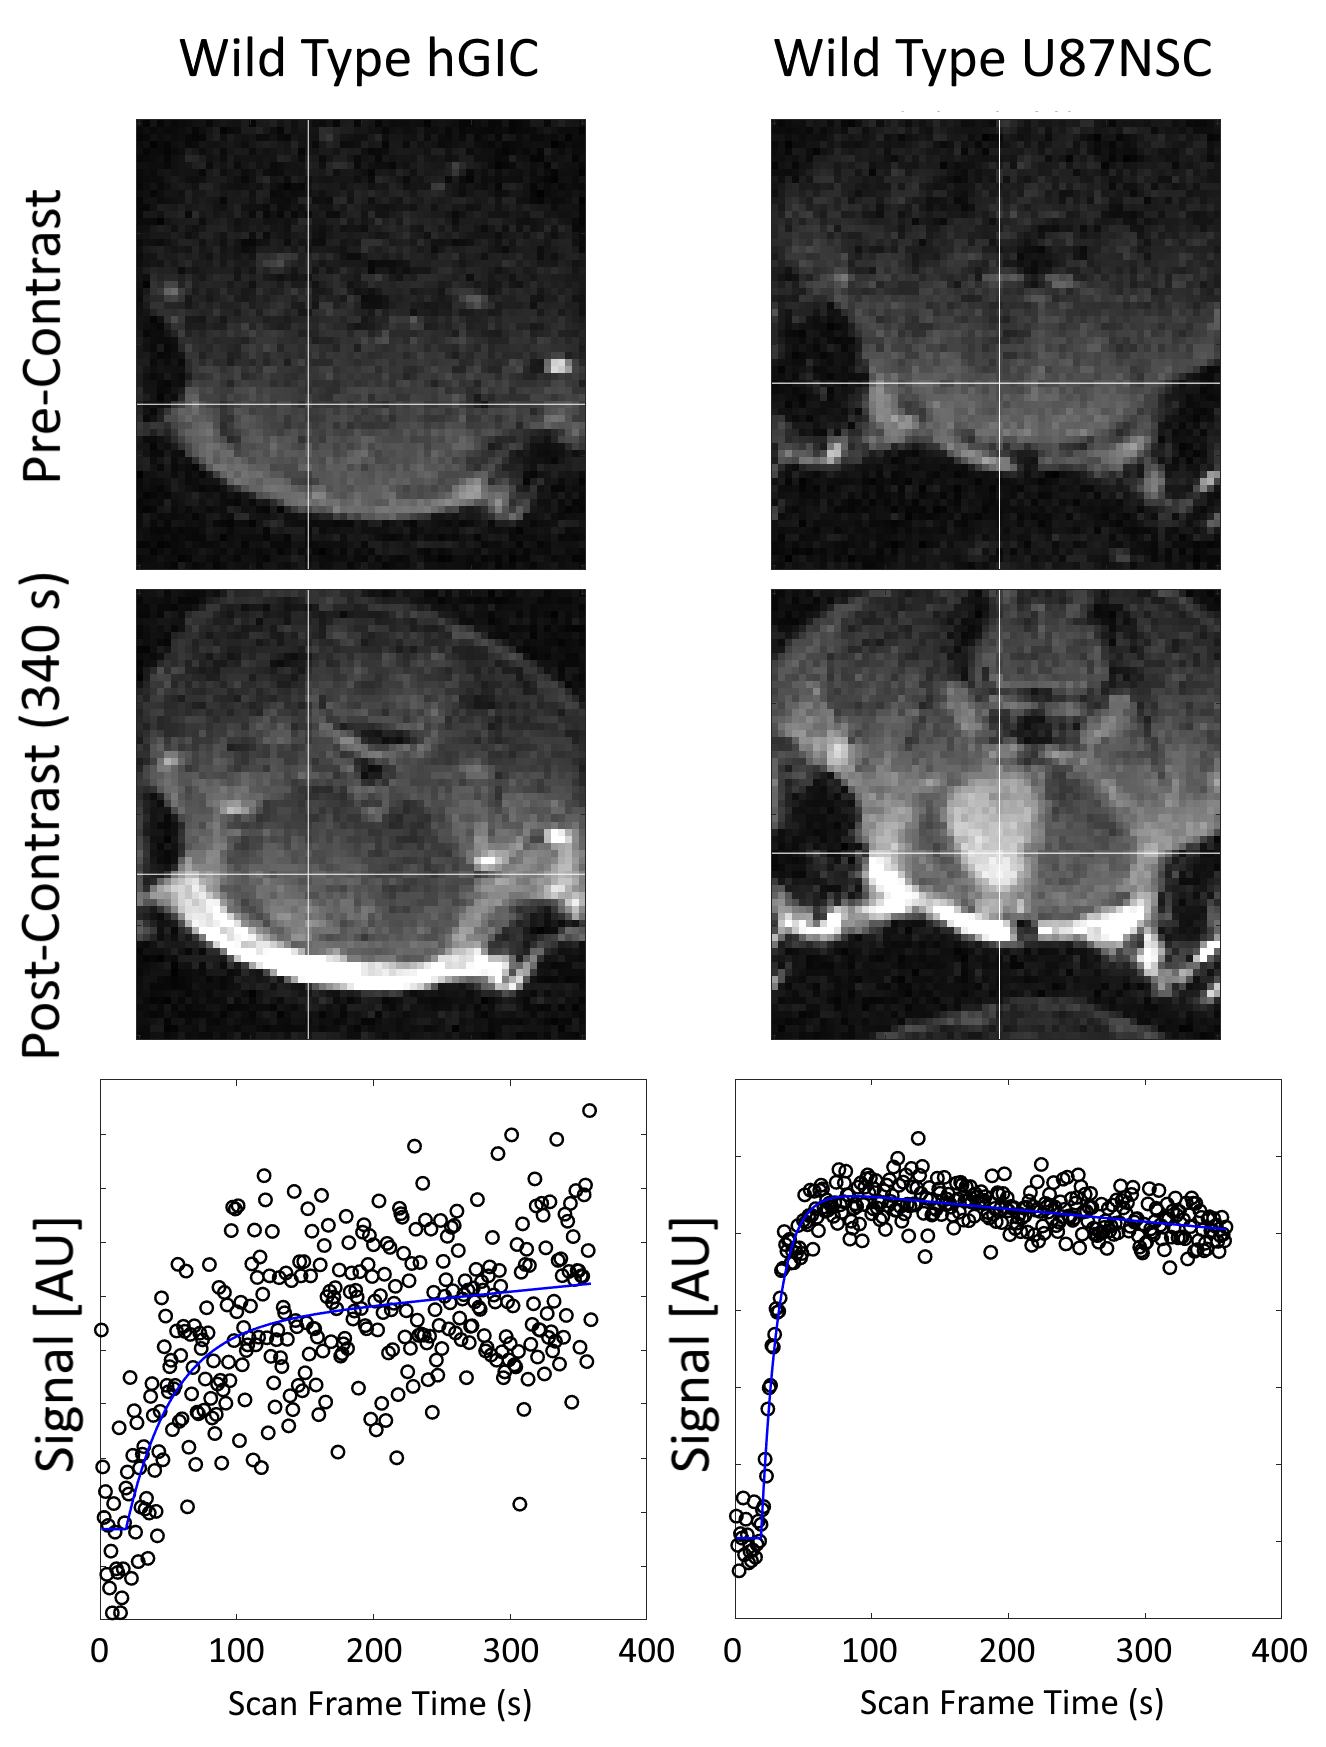
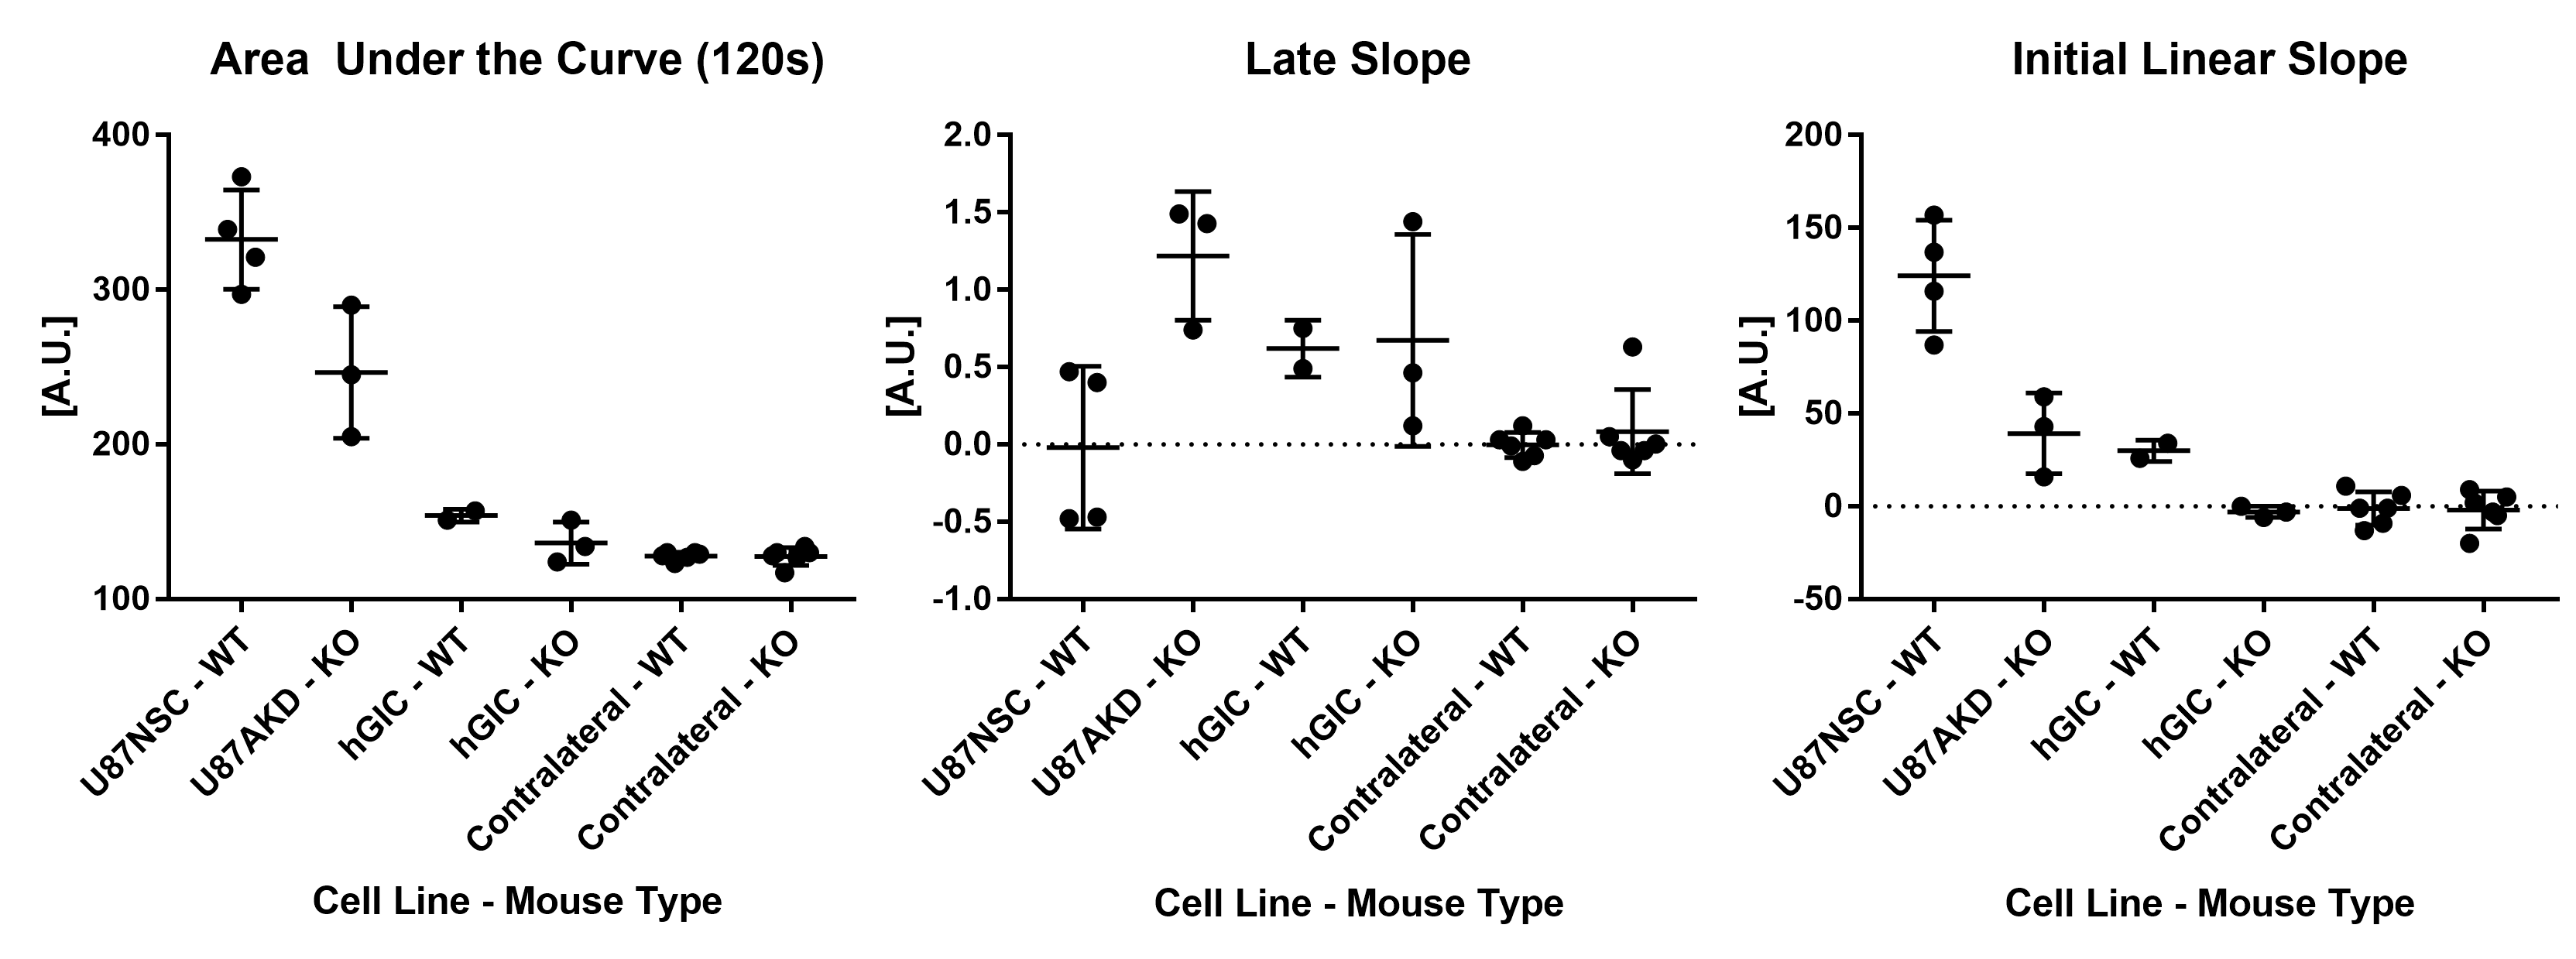
In T1w FLASH images in Figure 1, U87 tumours showed strong contrast changes against surrounding brain tissue after contrast agent administration, whereas hGIC tumours showed very little contrast change.Example parametric maps are shown in Figure 2. Scatter plots of ROI average parameter values are shown in Figure 3.
In AUC120 maps, U87NSC tumours in WT mice had higher contrast uptake than U87AKD in APLNKO mice. Both U87 tumour types had higher uptake than hGIC tumours in initial post-contrast minutes. Uptake in hGIC tumours was slightly elevated compared to contralateral brain, which was itself similar between mouse types.
In late slope maps, U87NSC tumours, excluding a single small (~1 mm diameter) tumour, had a distinct peripheral region with positive late slope with lower values in the tumour centre, while most U87AKD tumours had a central region with further elevated late slope. hGIC had no clear intra-tumoural heterogeneity.
In initial linear slope maps, U87 tumours had similar patterns as in AUC120, while hGIC tumours have low values. Initial slopes of hGIC in WT mice are slightly higher than APLNKO mice, however.
Discussion
Higher uptake of contrast over 0-2 min in U87NSC/WT than U87AKD/APLNKO tumours and mice is consistent with apelin deficient tumours having less developed vasculature. Lower or negative late slope in U87NSC/WT tumours suggests washout is faster because of high vessel density and more-functional vessels. A central positive late slope in U87AKD/APLNKO tumours suggests lower vessel density of lower functionality, allowing contrast to accumulate over longer periods i.e. outside of vessels. The peripheral higher late slope in U87NSC/WT tumours might indicate ongoing angiogenesis in the tumour rim.Initial linear slope is less reliable than other fits due to its sensitivity to manually determined contrast arrival time T0. For high contrast uptake tumours, the transition is usually clear, but for lower contrast uptake tumours, the scale of signal change can be comparable to noise and thus unclear.
Conclusions
Dynamic contrast enhanced MRI showed higher accumulation of contrast agent between apelin rich (U87NSC/WT) than apelin deficient (U87AKD/APLNKO) tumour models, in line with apelin-controlled tumour vascularization. Contrast accumulation was also heterogeneous within and different between the models. Area-under-the-curve may capture the overall vascularization of the tumours, whereas late slope may reveal the level of functional vessels.Acknowledgements
We acknowledge support from the Deutsche Forschungsgemeinschaft (DFG, German Research Foundation – 391523415, SFB 824).References
1. Michael Weller et al. (2021) EANO guidelines on the diagnosis and treatment of diffuse gliomas of adulthood. Nat. Rev. Clin. Oncol. 18: 170-186.
2. Kälin RE et al. (2007) Paracrine and autocrine mechanisms of apelin signaling govern embryonic and tumor angiogenesis. Dev Biol. 305(2): 599-614
3. Giorgia Mastrella et al. (2019) Targeting APLN/APLNR Improves Antiangiogenic Efficiency and Blunts Proinvasive Side Effects of VEGFA/VEGFR2 Blockade in Glioblastoma. Cancer Research 79(9): 2298-2313
4. Anne Frisch et al. (2020) Apelin Controls Angiogenesis-Dependent Glioblastoma Growth. Int J Mol Sci 21(11): 4179
Figures