2662
Utility of T1WI and T2 FLAIR for Diagnosis of Parkinson’s Disease Using Radiomics1Beijing Hospital, National Center of Gerontology; Institute of Geriatric Medicine, Chinese Academy of Medical Sciences, P.R. China, Beijing, China, 2Beijing Hospital, Beijing, China, 3GE Healthcare, Beijing, China, Beijing, China
Synopsis
Radiomic features of bilateral RN and SN based on T1WI and T2 FLAIR from 100 PD patients and 100 healthy controls showed good performance in differentiation of PD, the radiomic model of combine T1WI and T2 FLAIR had best performance than individual T1WI and T2 FLAIR. Radiomics may provide MR imaging biomarkers for PD, and the routine MR sequence may help to diagnose PD using radiomics.
Introduction
Parkinson’s disease (PD) is the second-most common neurodegenerative diseases. The clinical diagnosis of PD mainly relies on a series of clinical presentations and cannot fully meet the clinical requirements. Therefore, the identification of biomarkers of PD is essential. Radiomics features derived from MRI images, including quantitative susceptibility mapping [1], functional MRI [2], and multimodal MRI [3], have been used for PD diagnosis with good diagnostic efficacy. However, for the PD diagnosis, few studies investigated the performance of radiomics features from routine MRI sequences, such as T1-weighted imaging (T1WI), T2-weighted imaging (T2WI), and T2 fluid-attenuated inversion recovery (T2 FLAIR). In this study, we focus on specific brain regions, bilateral red nucleus (RN) and substantia nigra (SN), and aim to discriminate PD patients from healthy controls through radiomics features derived from the routine T1WI and T2 FLAIR images.Methods
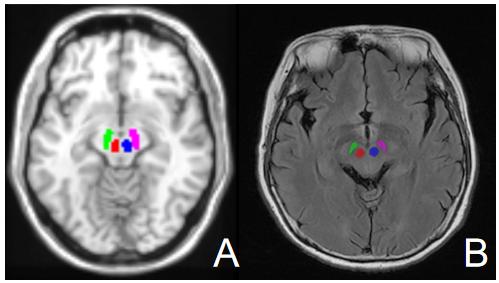
100 PD patients and 100 healthy controls were enrolled in this study. We randomly divided all datasets into training set and test set in a ratio of 7:3. All MRI data for both datasets were obtained from three 3.0 Tesla MRI scanners: (1) MAGNETOM Prisma (Siemens Healthcare,Erlangen, Germany); (2) SIGNA Pioneer (GE Healthcare, Milwaukee, WI, USA); (3) Achieva TX (Philips HealthCare, Best, Netherlands). Sagittal high-resolution three-dimensional T1WI and T2 FLAIR were all scanned for the PD patients and healthy controls. The left and right RN and SN were chosen as the ROIs. The bilateral RNs and SNs masks of T1WI were extracted from the MNI templates through a normalization procedure (Figure 1A). On T2 FLAIR images, all ROIs were identified and manually drawn according to the anatomic structures using ITK-SNAP software (version 3.6.0; www.itksnap.org) (Figure 1B). Feature extraction was performed by Artificial Intelligence Kit software (A.K. software; GE Healthcare, China). A three-step feature selection technique was used to reduce the feature dimensions. First, the Kolmogorov-Smirnov test was applied to examine the normality of the variable distribution. Second, a T-test was used to determine whether the feature was significantly different between the PD patients and normal controls for normally distributed features; otherwise, the Mann-Whitney test was used. P values less than 0.05 were considered statistically significant. Third, univariate logistic regression analysis was used to determine the significant features with P values less than 0.05. Last, least absolute shrinkage selection operator (LASSO) regression was performed to reduce over-fitting and selection bias in the radiomics model.Three different models based on features from individual T1WI, T2 FLAIR and their combination of the four ROIs including left RN, right RN, left SN, and right SN were constructed. Multivariate logistic regression was performed via a linear combination of selected features weighted by their respective coefficients. A 10-fold cross-validation with a repetition of 10 times was used, resulting in the radiomic score (Rad-score) in T1WI and T2 FLAIR models. We then combined the rad-scores of individual T1WI and T2 FLAIR models to calculate the rad-score of the combination model. The diagnostic performance was assessed by the sensitivity, specificity, accuracy, and area under the receiver operating characteristic (ROC) curve (AUC).Results
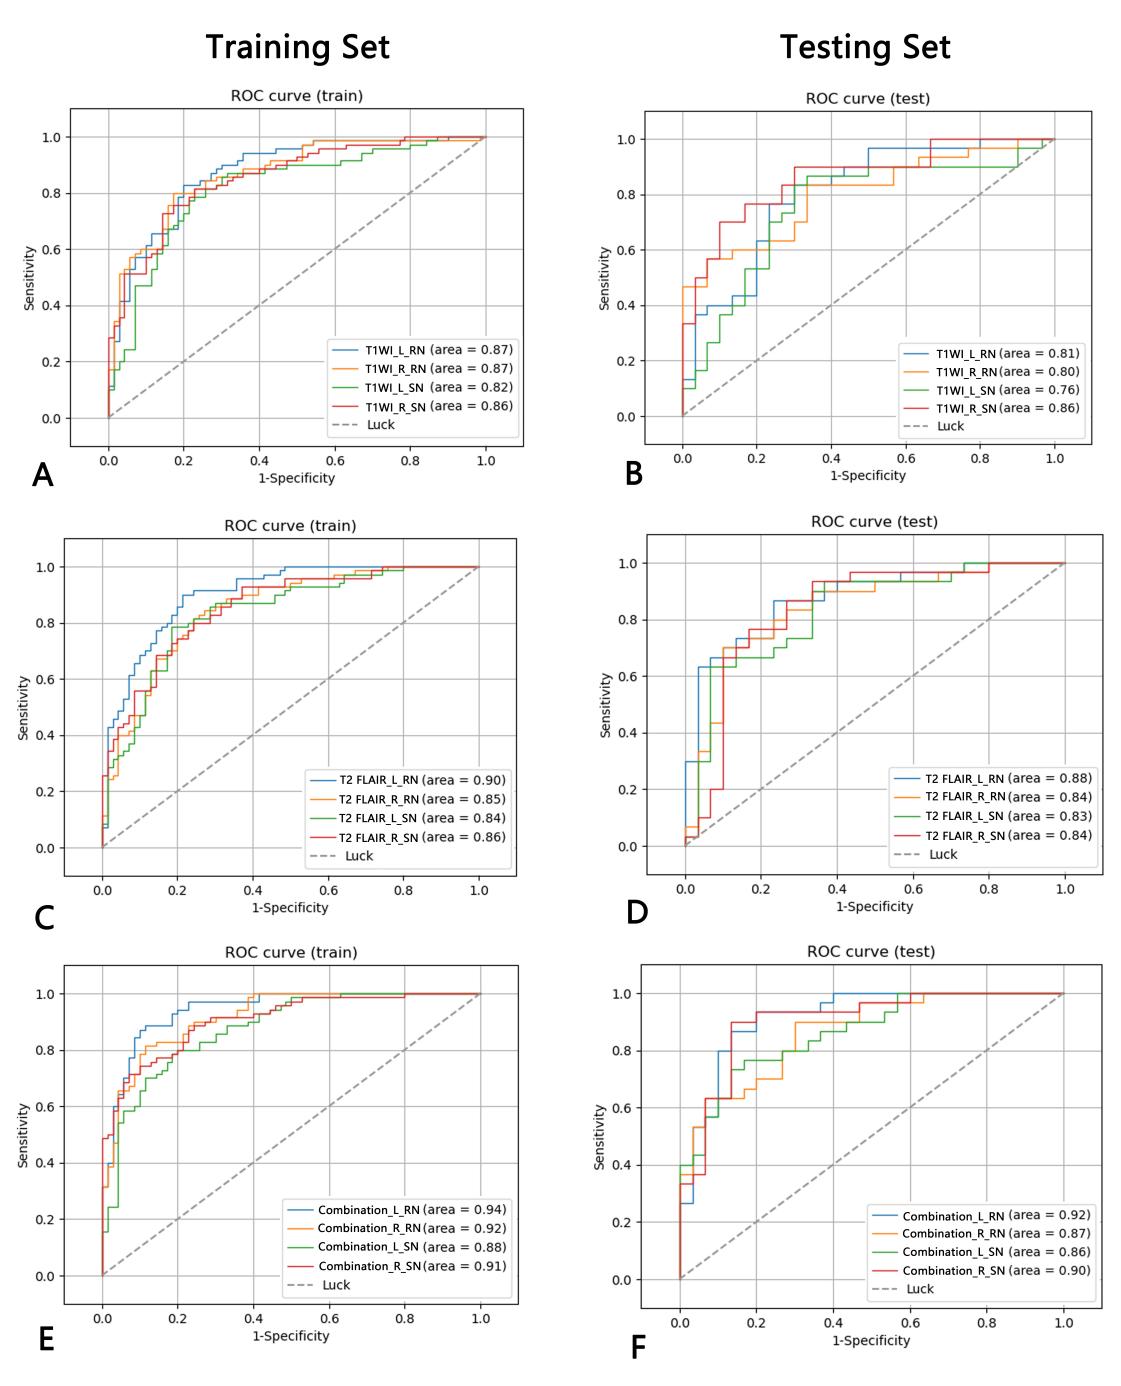
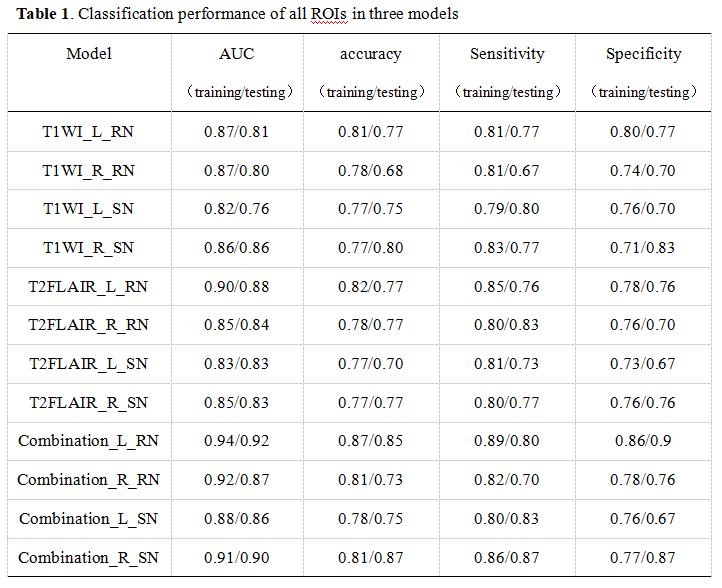
A total of 1316 texture features were extracted from the left and right RN and SN on T1WI and T2 FLAIR images, separately. Three radiomics models performed well in differentiating PD and healthy controls with the AUC ranged from 0.82-0.94 in training set and 0.76-0.92 in testing set. The combination model of left RN had the best performance with an AUC of 0.92 in testing set. Table 1 shows the AUC, accuracy, sensitivity, and specificity of three models from all ROIs. Figure 2 shows the ROC curves of three models from all ROIs.Discussion and Conclusion
This study illustrated that radiomic features extracted from bilateral RN and SN on T1WI and T2 FLAIR images had a good diagnostic performance in differentiating PD patients and healthy controls. These results were consistent with other radiomics studies based on QSM[1,4-5] and functional MRI[2]. We also demonstrated that the combination model of T1WI and T2 FLAIR performed better than the individual model. Furthermore, we highlighted the role of RN in PD diagnosis by showing that radiomic features of RN performed well and even better than SN in differentiating PD and healthy controls. In conclusion, radiomics features from routine MR images may have good potential as the diagnostic MR imaging biomarkers for PD.Acknowledgements
We sincerely thank the participants in this study.References
1. Cheng Z, Zhang J, He N, et al. Radiomic Features of the Nigrosome-1 Region of the Substantia Nigra: Using Quantitative Susceptibility Mapping to Assist the Diagnosis of Idiopathic Parkinson's Disease. Front Aging Neurosci 2019;11:167.
2. Cao X, Wang X, Xue C, Zhang S, Huang Q, Liu W. A Radiomics Approach to Predicting Parkinson's Disease by Incorporating Whole-Brain Functional Activity and Gray Matter Structure. Front Neurosci 2020;14:751.
3. Talai AS, Sedlacik J, Boelmans K, Forkert ND. Utility of Multi-Modal MRI for Differentiating of Parkinson's Disease and Progressive Supranuclear Palsy Using Machine Learning. Front Neurol 2021;12:648548.
4. Xiao B, He N, Wang Q, et al. Quantitative susceptibility mapping based hybrid feature extraction for diagnosis of Parkinson's disease. Neuroimage Clin 2019;24:102070.
5. Ren Q, Wang Y, Leng S, et al. Substantia Nigra Radiomics Feature Extraction of Parkinson's Disease Based on Magnitude Images of Susceptibility-Weighted Imaging. Front Neurosci 2021;15:646617.
Figures