2661
Tissue Sodium Concentration Quantifies Cell Response after Radiation Therapy with Stereotactic Radiosurgery1Computer Assisted Clinical Medicine, Medical Faculty Mannheim, Heidelberg University, Mannheim, Germany, 2Department of Neuroradiology, Medical Faculty Mannheim, Heidelberg University, Mannheim, Germany, 3Department of Diagnostic and Interventional Radiology, University Hospital Heidelberg, Heidelberg, Germany, 4Department of Radiation Oncology, Medical Faculty Mannheim, Heidelberg University, Mannheim, Germany, 5Department of Radiation Oncology, University Hospital Bonn, Bonn, Germany, 6Department of Radiation Oncology, University Hospital Heidelberg, Heidelberg, Germany
Synopsis
We investigated TSC within Gross Tumor Volume (GTV), and surrounding tissue and healthy tissue (HR). 12 patients with a total of 14 GTV was included. 23Na MRI were acquired at three different time-points (2days pre-, 5days post-, 40days post-SRS). TSC was measured within GTV, HR and isodose-areas between 2 and 18Gy at all time-points. Results show changes in TSC within GTV shortly after SRS and subsequent TSC recovery. TSC was higher within higher isodose-areas showing a correlation of radiation exposure and TSC. Findings suggest that TSC might be able to quantify cell response to radiation of tumorous and healthy tissue.
Introduction
Changes in absolute Tissue Sodium Concentration (TSC) – measured with 23Na MRI [1]- have previously been associated with a variety of pathologies affecting cell vitality or viability, e.g. ischemic stroke, various tumor diseases, or Multiple Sclerosis [2,3,4]. Stereotactic radiosurgery (SRS) is a common and efficient treatment method for brain metastases (BM) [5,6]. We conducted a prospective study, investigating the TSC within BM and their surrounding tissue as well as healthy brain tissue (HR) pre- and post SRS.Methods
A total of 12 patients with 14 BM was included. All patients had one or more BM of at least 64 mm3 in size from various primary tumors that were scheduled to be treated with the Leksell Gamma Knife (Elekta) SRS with a single ablative dose (D > 18 Gy). 23Na MRI were acquired at:I. 2 days before radiation therapy (baseline, t = SRS-2 days)
II. 5 days after radiation therapy (t = SRS+5 days)
III. 40 days after radiation therapy (t = SRS+40 days)
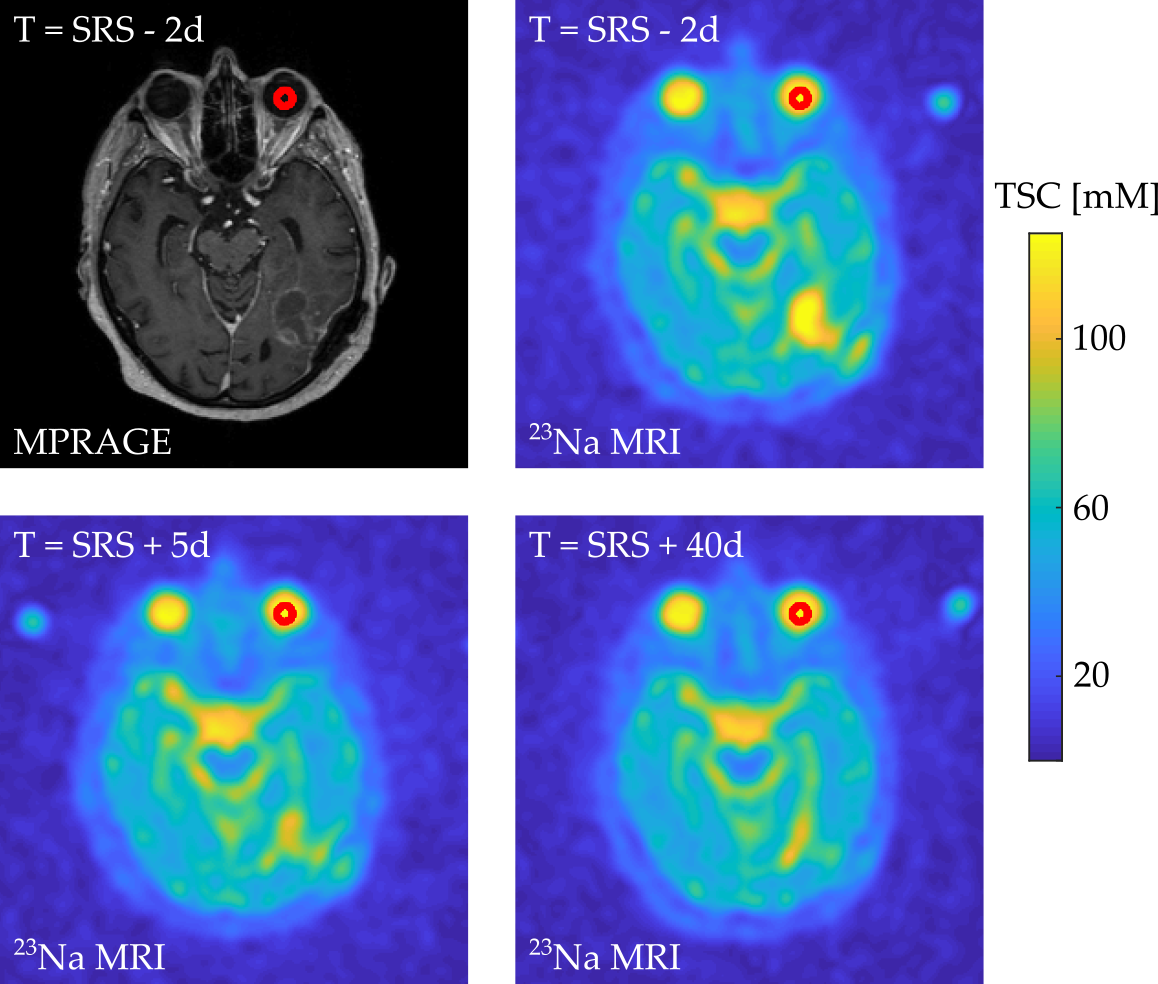
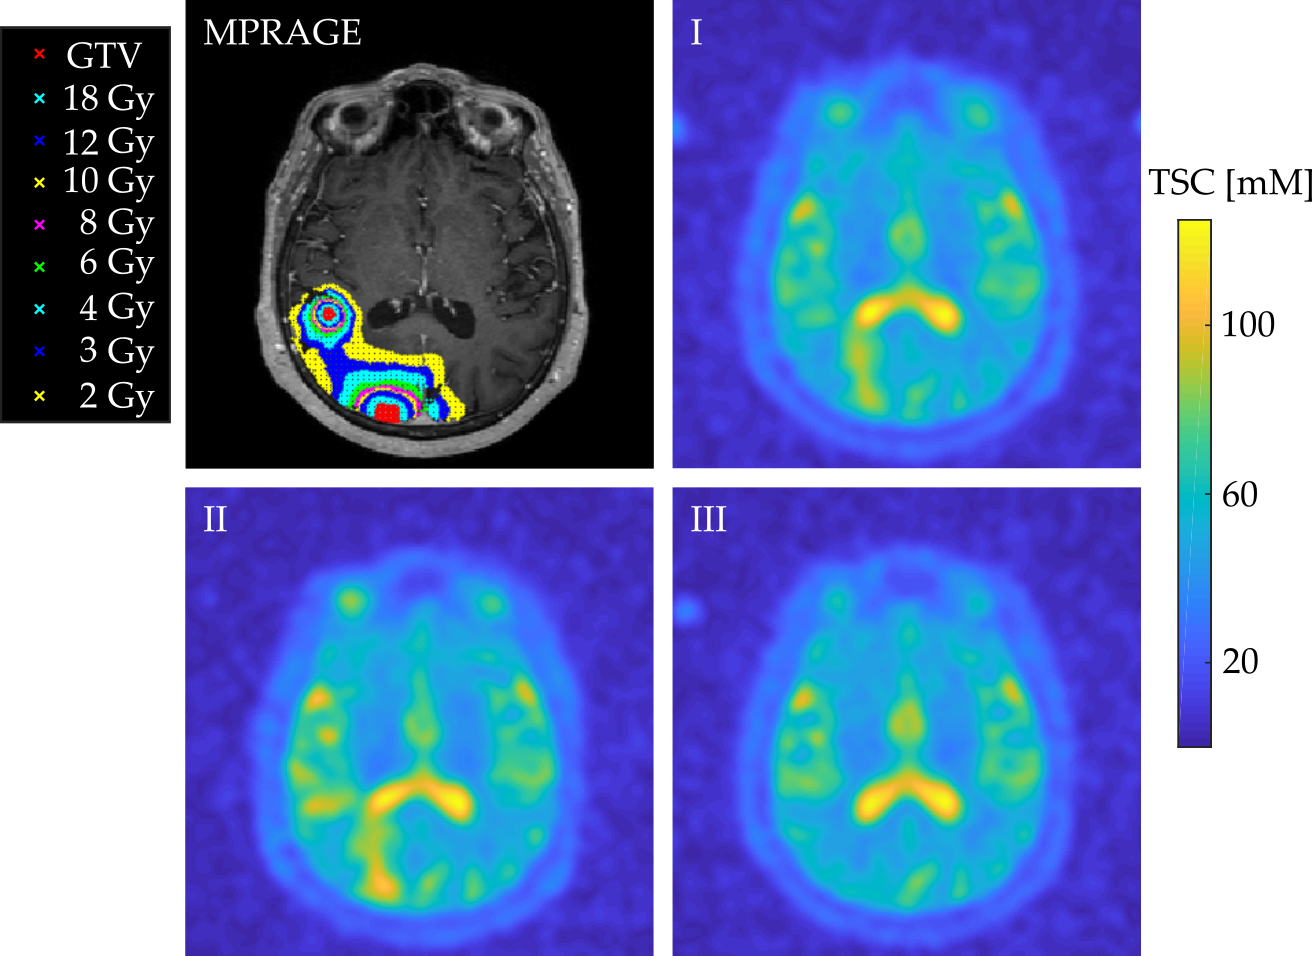
Data acquisition was performed at 3T (Magnetom Trio, Siemens Healthineers). The measurements included a 3D radial density-adapted 23Na sequence [7] which was acquired with a dual-tuned 1H/23Na birdcage head coil (Rapid Biomedical) and a contrast enhanced T1w 3D MPRAGE that was acquired with a 12 channel head coil. Radiation therapy planning and segmentation of the BM was performed on the MPRAGE by one radio-oncologist. The radiotherapy treatment plan was calculated with Leksell GammaPlan, defining Gross Tumor Volume (GTV) and isodose lines. Additionally, a radio-oncologist defined two regions within the healthy-appearing white matter (Healthy ROI, HR) of each patient as reference. All ROIs were exported from Leksell GammaPlan as DICOM RT files. All three 23Na MRI of one patient were co-registered to the MPRAGE from their first MRI scan with the statistical parametric mapping software SPM12 (Wellcome Centre, UCL ), enabling the transfer of the ROIs to the 23Na MRI. Quantification was performed based on the signal intensity within the patients’ left vitreous humor (VH) which was corrected for T1 inhomogeneities assuming T1(VH)=50 ms. The ROIs were manually segmented within the MPRAGE image which was then transferable to all three 23Na MRI. The transfer of the reference ROI is depicted in one representative transverse slice of one patient, Figure 1. The DICOM RT structure files were imported into MATLAB 2018a with CERR. The TSC was measured within GTV, HR and the isodose areas of D = 2,3,4,6,8,10,12, and 18 Gy on all 23Na MRI of each patient. Isodose areas were defined as being enclosed by the corresponding isodose line with subtraction of closest preceding isodose area, Figure 2. Mean TSC within GTV, HR, and all isodose areas was compared between measurement points I, II, and III and differences were tested for statistical significance using the student t-test and p<0.5 was considered significant. The Pearson correlation test was used to evaluate a potential correlation between the radiation dose D and the mean TSC within the corresponding isodose area.
Results
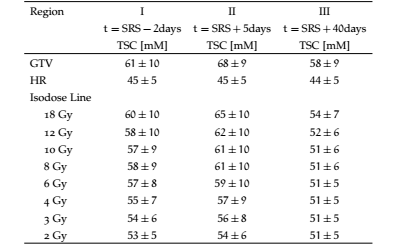
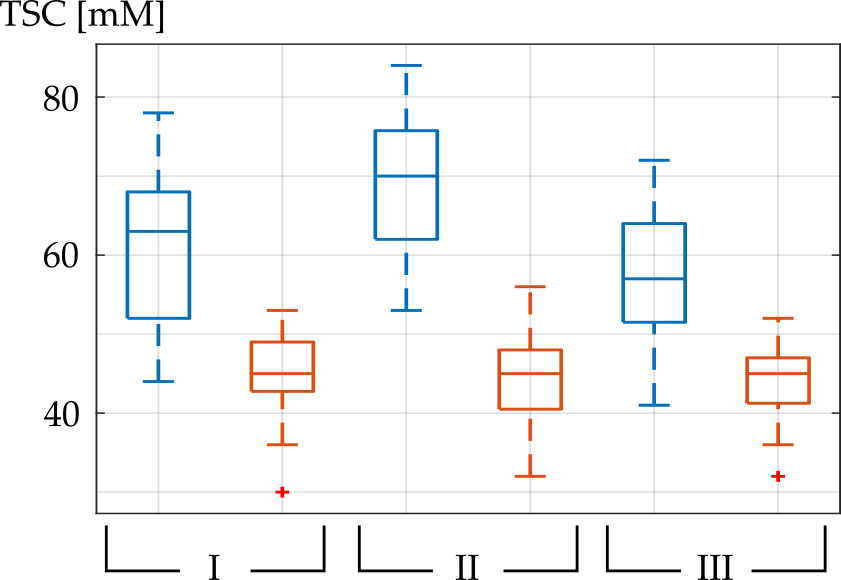
9 patients (11 BM) underwent all three scheduled MRI measurements, 2 patients (2 BM) only underwent the first 2 MRI measurements and one patient (1 BM) only underwent the first MRI measurement session successfully. Figure 2 shows a representative transverse slice of the MPRAGE and of the three 23Na MRI of one patient with GTV, and the isodose areas being visualized within the MPRAGE.Mean TSC within all GTV, HR, and isodose areas at all three measurements are listed in Table 1. Mean TSC in GTV was significantly lower at baseline compared to II (p=0.0076) and it was not significantly different compared to III (p=0.27). Mean TSC in GTV was significantly higher at II compared to III (p=0.0214). TSC in HR was not significantly different at baseline, II or III (p=0.81, p=0.74, p=0.99). TSC in GTV was significantly higher compared to HR, within all three measurements (p<0.001), Figure 3.
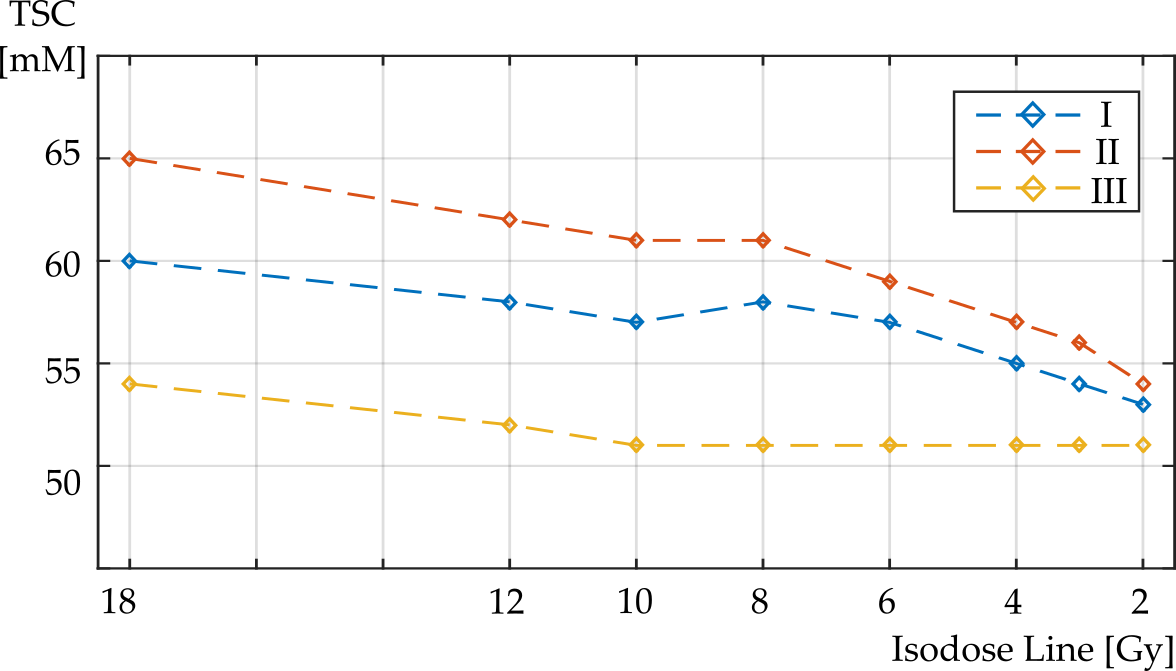
Mean TSC within all isodose areas was lower at baseline compared to measurement point II and differences were significant for isodose areas 18 to 8 Gy but not for isodose areas 6 to 2 Gy, Figure 4. Mean TSC was higher at measurement point II compared to III for all isodose areas. Differences were significant for all isodose areas but 2 Gy.
The Pearson correlation test showed a significant, positive correlation between the radiation dose D and the mean TSC within the corresponding isodose area at all three measurement points (I: r=0.92, p=0.0011, II: r=0.96, p=0.0001, III: r=0.86, p=0.0061).
Discussion and Conclusion
TSC in GTV was higher than in HR which is in alignment with previous findings of increased TSC in tumorous tissues [4]. TSC in HR was around 45 mM which also corresponds to literature values [8]. Results show significant changes in TSC within GTV shortly after SRS and subsequent TSC recovery whereas no significant changes occurred within the patients’ HR. Furthermore, TSC was significantly higher within higher isodose areas showing a correlation of radiation exposure and TSC. As an increased TSC might indicate cell damage [9], results suggest that TSC might be able to quantify cell response to (cell damage caused by) radiation of tumorous tissue and its surrounding healthy areas.Acknowledgements
No acknowledgement found.References
[1] Hilal, Sadek K., et al. "In vivo NMR imaging of sodium-23 in the human head." Journal of computer assisted tomography 9.1 (1985):1-7.
[2] Neumaier-Probst, Eva, et al. "A double-tuned 1H/23Na resonator allows 1H-guided 23Na-MRI in ischemic stroke patients in one session." International Journal of Stroke 10.SA100 (2015): 56-61.
[3] Haneder, Stefan, et al. "23 Na-MRI of recurrent glioblastoma multiforme after intraoperative radiotherapy." Neuroradiology 57.3(2015): 321-326.
[4] Ouwerkerk R et al (2003) Tissue sodium concentration in human brain tumors as measured with 23Na MR imaging. Radiology 227(2): 529–537.
[5] Fukuoka, S., et al. "Radiosurgery of brain metastases with the gamma knife." Stereotactic and functional neurosurgery 66.Suppl. 1 (1996): 193-200.
[6] Patel, T. R., et al. "A comprehensive review of MR imaging changes following radiosurgery to 500 brain metastases." AmericanJournal of Neuroradiology 32.10 (2011): 1885-1892.
[7] Nagel, Armin M., et al. "Sodium MRI using a density‐adapted 3D radial acquisition technique." Magnetic Resonance in Medicine(2009): 1565-1573.
[8] Madelin, Guillaume, and Ravinder R. Regatte. "Biomedical applications of sodium MRI in vivo." Journal of Magnetic Resonance Imaging 38.3 (2013): 511-529.
[9] Nagy I et al (1983) Correlation of malignancy with the intracellular Na+:K+ ratio in human thyroid tumors. Cancer Res 43(11):5395–5402
Figures