2660
ITSS vasculature volume and Radiomics Features from MR SWI: Performance in Glioma Grading1Center for Biomedical Engineering, Indian Institute of Technology (IIT), Delhi, New Delhi, India, 2Department of Radiology & Biomedical Engineering, University of California, San Francisco (UCSF), San Francisco, CA, United States, 3Department of Radiology and Imaging, Fortis Memorial Research Institute, Gururam, India, 4Department of Neurosurgery, Fortis Memorial Research Institute, Gurugram, India, 5SRL Diagnostics, Fortis Memorial Research Institute, Gurugram, India, 6Department of Biomedical Engineering, All India Institute of Medical Sciences, New Delhi, India
Synopsis
Majority of the glioma studies rely on using radiomic-features extracted only from conventional MRI and noticeably limited in SWI. Main objective of the current study is to evaluate the role of SWI in glioma grading aided by machine-learning (ML) methods, in terms of ITSS-vasculature-volume(IVV), radiomic features and by combining both. We conclude SWI to be the one of the useful sequences in the glioma-analysis as it contributes to calculate the IVV, which can singlehandedly improve the glioma grading. When IVV is combined with radiomic-analysis used in combination with PCA feature reduction and RF ML classifier, the performance is marginally improved.
Introduction
Glioma is the most common primary brain tumor [1][2] classified into grades I-IV as per WHO classification[3]. MRI is considered the modality of choice for pre-operative glioma-grading[4] using conventional and advanced imaging techniques[5][6]. Park et. al. have shown semi-quantitative intra-tumoral-susceptibility-signal (ITSS) assessment from susceptibility-weighted-imaging (SWI) correlates well with perfusion in glioma-grading[7]. Quantitative assessment of ITSS, reported previously[8], proposes ITSS-vasculature-volume(IVV) as a better reliable biomarker in differentiating grades of glioma, than semi-quantitative methods[8]. Preliminary results of this study on limited number of datasets show potential application of quantitative ITSS. However, this approach should further be evaluated on larger number of subjects. Apart from ITSS, SWI can also be explored further to find various other biomarkers which might have utility in glioma grading. Analyzing radiomics based properties from SWI could be one such possibility. The research gap observed here is that majority of the studies rely on using radiomic features extracted only from conventional MRI, reported literature is noticeably limited in SWI[9][10]. Main objective of the current study is to evaluate the role of SWI in glioma grading aided by machine-learning (ML) methods, in terms of IVV, radiomic features and by combining both.Methods
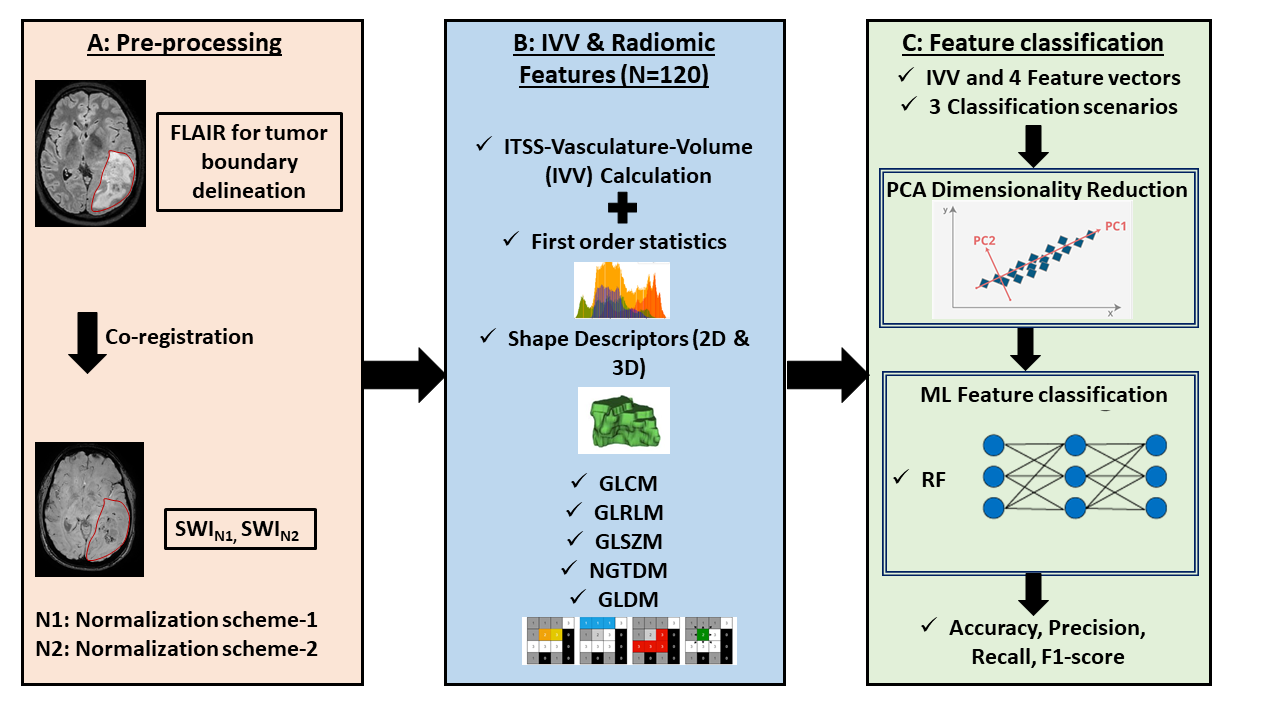
This retrospective study, approved by IRB, included a total of 255 treatment-naïve glioma patients(85 of each grade: grade-IV, grade-III, and grade-II) (age ranging from 18 to 79 years) having visible-ITSS on SWI, who underwent MRI on a 3.0T scanner (Ingenia, Philips Healthcare, The Netherlands). SWI data were acquired with 4 echoes at 5.6, 11.8, 18, 24.2ms (TR=31ms; flip-angle=17°, slice-thickness=1.0mm, acquisition-matrix=768×768, FOV=240×240mm2). The methodology was implemented in-house using a combination of MATLAB (Version R2020a, Mathworks Inc, Natick, MA), PyRadiomics-2.2.0 library[32] and Scikit-learn-module in Python(version-3.0)[33]. The stepwise flowchart is shown in figure 1. IVV values were calculated from SWI images using previously reported method[8]. In normalization-scheme-1(N1), SWI images were normalized within a range of [µ ± 3σ] [35], µ and σ are the mean and standard-deviation of intensity values present in the polygonal-tumor-ROI. In normalization-scheme-2(N2), intensity value of each pixel in the target-ROI is divided by the mean intensity value (ρ) of the contralateral-ROI of same size placed in the opposite hemisphere of the tumor, in normal-appearing-parenchyma. Two 3D volumetric-ROI-segments were denoted as SWIN1 and SWIN2. For both volumetric-ROI-segment, a total of 120 radiomic features were extracted using PyRadiomics-2.2.0 library[32]. Radiomic feature-combinations were created from each volumetric-segment as given in Table 1. Principal-component-analysis (PCA) was applied to each feature-combination keeping 99% variability present in the original features intact(PC=20). Random-Forest (RF)classifier [38], with 500 decision-trees, was implemented and optimized for three classification scenarios (Table 1). A 70%:30%(60 and 25) ratio was maintained for assigning training and testing datasets. Risks of overfitting [42] were avoided using 10-fold cross validation on the training datasets [43]. Firstly, calculated IVV values are summarized. One-way analysis-of-variance (ANOVA) was performed to measure classification accuracy, precision, recall and F1-scores of IVV as a standalone variable for classification scenarios CS1-3. Secondly, the performance of the RF classifiers using FVs (for CS1-3) were assessed respectively. ML classification accuracy, precision, recall and F1-scores were computed based on the testing datasets held out separately. All the statistical analysis have been performed using MedCalc statistical software [11]. The ML classifier performance assessment were done using scikit-learn module in Python [12].Results and Discussion
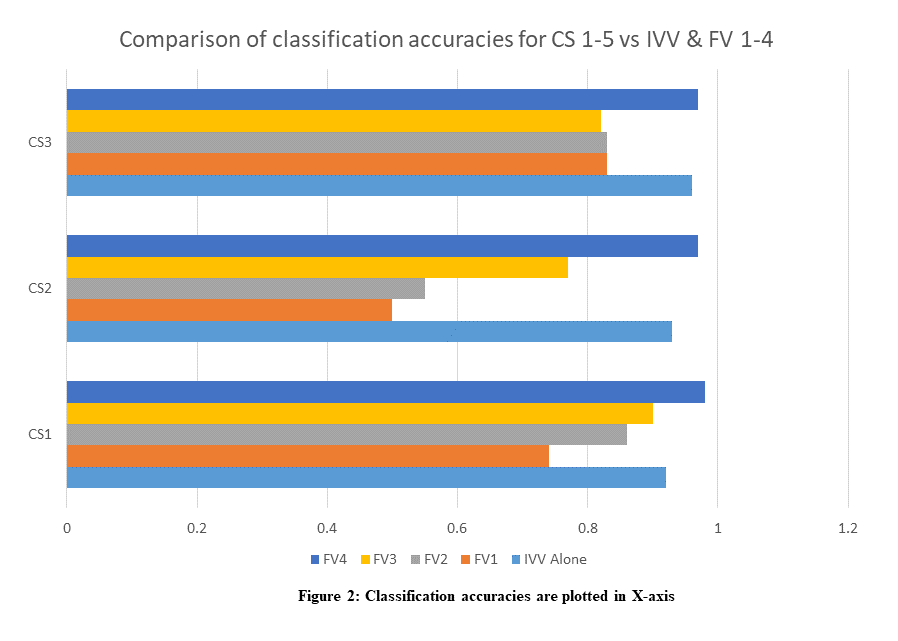
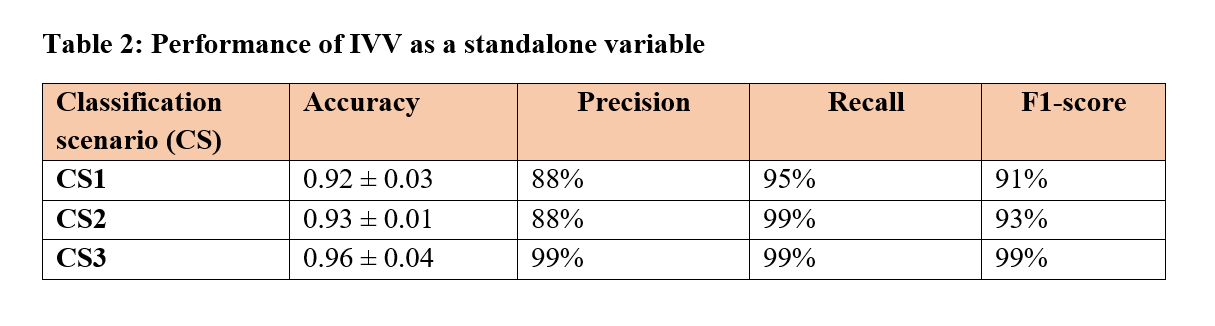
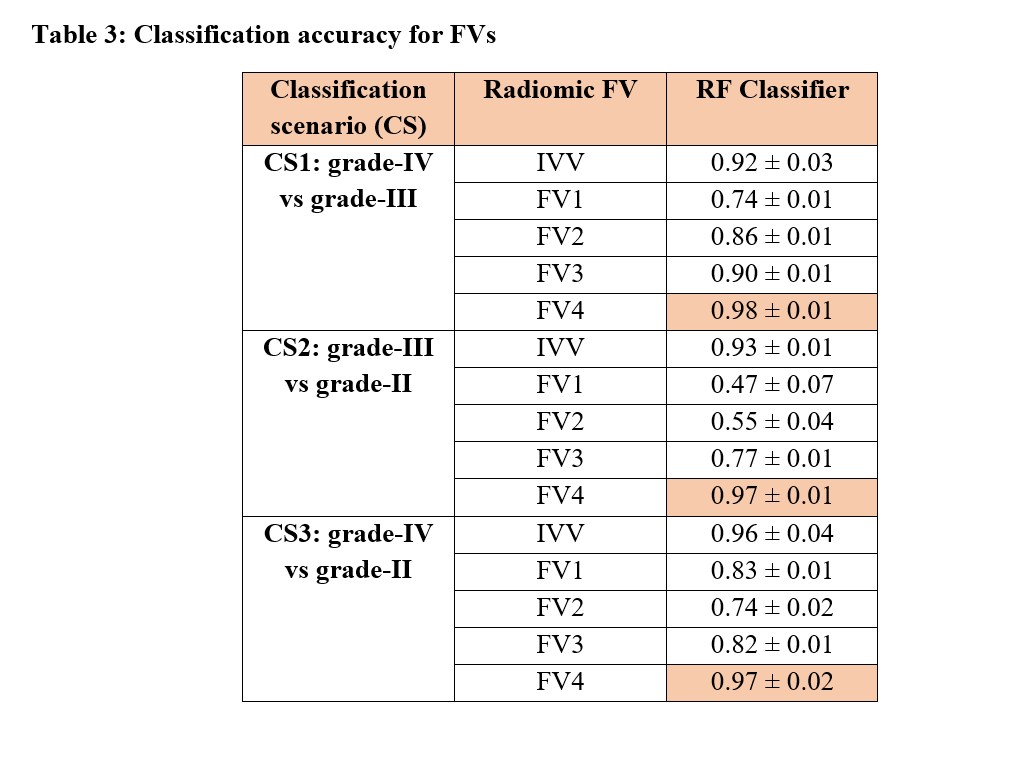
The performance evaluation of IVV as a standalone variable is summarized in Table 2. In Table 3, the performance of the RF classifier using FVs (for CS1-3) were assessed, are summarized. With only SWI radiomic analysis, the grading accuracies(CS1-3) are poor. It is visible that combining IVV with the radiomics mix, improves the grading performance (Improvement: 12% in CS1, 42% in CS2, 14% in CS3). IVV, derived from SWI using quantitative ITSS analysis, is more reliable a metric as it removes the hemorrhage component from SWI ITSS and quantifies the volume of microvasculature. The improvement verifies the importance of IVV in glioma grading claimed in studies previously [8][13]. IVV alone grades gliomas with good accuracies; adding radiomics FVs improve the performance slightly. In the scope of the study, we have consciously used PCA dimensionality reduction instead of feature reduction/selection methods to prevent the overfitting. Normalization-scheme-2 shows 7-12% improvement of grading accuracies over normalization-scheme-1 for FV1-4. In our findings, PCA in conjunction with RF-classifier provides the best possible results over the patient population. The study findings are limited to glioma patients having visible-ITSS.Conclusion
We conclude SWI to be the one of the useful sequences in the glioma-analysis as it contributes to calculate the IVV metric, which can singlehandedly improve the glioma grading. When IVV is combined with radiomic analysis used in combination with PCA feature reduction and RF ML classifier, the performance is marginally improved.Acknowledgements
The authors thank Dr. Suhail P Parvaze for his valuable suggestions on this abstract.References
[1] M. Korja et al., “Glioblastoma survival is improving despite increasing incidence rates: A nationwide study between 2000 and 2013 in Finland,” Neuro. Oncol., vol. 21, no. 3, pp. 370–379, 2019, doi: 10.1093/neuonc/noy164.
[2] C. H. Lee, K. W. Jung, H. Yoo, S. Park, and S. H. Lee, “Epidemiology of primary brain and central nervous system tumors in Korea,” J. Korean Neurosurg. Soc., vol. 48, no. 2, pp. 145–152, 2010, doi: 10.3340/jkns.2010.48.2.145.
[3] D. N. Louis et al., “The 2016 World Health Organization Classification of Tumors of the Central Nervous System: a summary,” Acta Neuropathol., vol. 131, no. 6, pp. 803–820, 2016, doi: 10.1007/s00401-016-1545-1.
[4] X. Wang, X. Z. Chen, L. Shi, and J. P. Dai, “Glioma grading and IDH1 mutational status: assessment by intravoxel incoherent motion MRI,” Clin. Radiol., vol. 74, no. 8, pp. 651.e7-651.e14, 2019, doi: 10.1016/j.crad.2019.03.020.
[5] D. Sasi S et al., “Evaluating feasibility of high resolution T1-perfusion MRI with whole brain coverage using compressed SENSE: Application to glioma grading,” Eur. J. Radiol., vol. 129, no. April, 2020, doi: 10.1016/j.ejrad.2020.109049.
[6] J. Saini et al., “Comparative evaluation of cerebral gliomas using rCBV measurements during sequential acquisition of T1-perfusion and T2-perfusion MRI,” PLoS One, vol. 14, no. 4, pp. 1–14, 2019, doi: 10.1371/journal.pone.0215400.
[7] M. J. Park, H. S. Kim, G. H. Jahng, C. W. Ryu, S. M. Park, and S. Y. Kim, “Semiquantitative assessment of intratumoral susceptibility signals using non-contrast-enhanced high-field high-resolution susceptibility-weighted imaging in patients with gliomas: Comparison with MR perfusion imaging,” Am. J. Neuroradiol., vol. 30, no. 7, pp. 1402–1408, 2009, doi: 10.3174/ajnr.A1593.
[8] R. Bhattacharjee, R. K. Gupta, R. Patir, S. Vaishya, S. Ahlawat, and A. Singh, “Quantitative vs. semiquantitative assessment of intratumoral susceptibility signals in patients with different grades of glioma,” J. Magn. Reson. Imaging, vol. 51, no. 1, pp. 225–233, 2020, doi: 10.1002/jmri.26786.
[9] I. Shiri et al., “Repeatability of radiomic features in magnetic resonance imaging of glioblastoma: Test–retest and image registration analyses,” Med. Phys., vol. 47, no. 9, pp. 4265–4280, 2020, doi: 10.1002/mp.14368.
[10] A. Vamvakas et al., “Imaging biomarker analysis of advanced multiparametric MRI for glioma grading,” Phys. Medica, vol. 60, no. December 2018, pp. 188–198, 2019, doi: 10.1016/j.ejmp.2019.03.014.
[11] O. MedCalc Software Bvba, “MedCalc Statistical Software Version 14.8.1.” 2014.
[12] F. Pedregosa FABIANPEDREGOSA et al., “Scikit-learn: Machine Learning in Python Gaël Varoquaux Bertrand Thirion Vincent Dubourg Alexandre Passos PEDREGOSA, VAROQUAUX, GRAMFORT ET AL. Matthieu Perrot,” 2011. Accessed: Apr. 24, 2021. [Online]. Available: http://scikit-learn.sourceforge.net.
[13] J. Xu, H. Xu, W. Zhang, and J. Zheng, “Contribution of susceptibility- and diffusion-weighted magnetic resonance imaging for grading gliomas,” Exp. Ther. Med., vol. 15, no. 6, pp. 5113–5118, Jun. 2018, doi: 10.3892/etm.2018.6017.
Figures