2658
Using combined DSC and pcASL perfusion imaging to assess treatment response of high-grade glioma.1Diagnostic department, Capital medical center universal clinic Oberig, Kyiv, Ukraine
Synopsis
To determine the efficacy and feasibility of using combined DSC and ASL perfusion imaging in a routine protocol to assess the response to treatment of high-grade gliomas in adults. Perfusion imaging is performed for perform differentiation of tumor recurrence from radiation necrosis, since it provides information about angiogenesis at the microscopic level. The data obtained show that the combined use of ASL and DSC perfusion in a routine protocol can be considered as possible additional methods in differentiating recurrent tumor from pseudoprogression.
Purpose
Glioma is a common type of tumor originating in the brain1. Differentiation of tumor recurrence from radiation necrosis is very important, as it can provide an answer to the question of whether to continue standard adjuvant chemotherapy or switch to second-line therapy in case of recurrence2. In this work, we explore a variety of magnetic resonance perfusion approaches that attempt to distinguish posttreatment areas of true tumor progression from pseudoprogression.Methods and Materials
Dynamic susceptibility contrast (DSC) MR perfusion is a technique in which the first pass of a bolus of gadolinium-based contrast agent (GBCA) through brain tissue is monitored by a series of T2- or T2*-weighted MR images. The susceptibility effect of the paramagnetic contrast agent leads to a signal loss in the signal intensity– time curve. The progression over time of the first pass as well as the associated signal reduction are displayed for the entire brain as a time-density curve, the global bolus plot (GBP). The GBP provides only a general description with respect to the course of perfusion over time. Individual voxels have to be evaluated first to provide precise data with respect to cerebral blood volume and blood flow. Individual cards and maps are generated for each slice to be included in the evaluation. From these data, parametric maps of cerebral blood volume (CBV) and flow (CBF) can be derived3.ASL perfusion imaging was performed with pseudo-continuous labeling, background suppression, and a stack of spirals of 3D fast spin echo imaging sequences. Selective inversion and saturation pulses were applied to a slab containing the imaged region and ending at the labeling plane. The duration of the pulse train is defined by the Labeling Duration parameter. Postlabeling Delay parameter is a delay between the end of the labeling pulse, train and the start of image acquisition4.
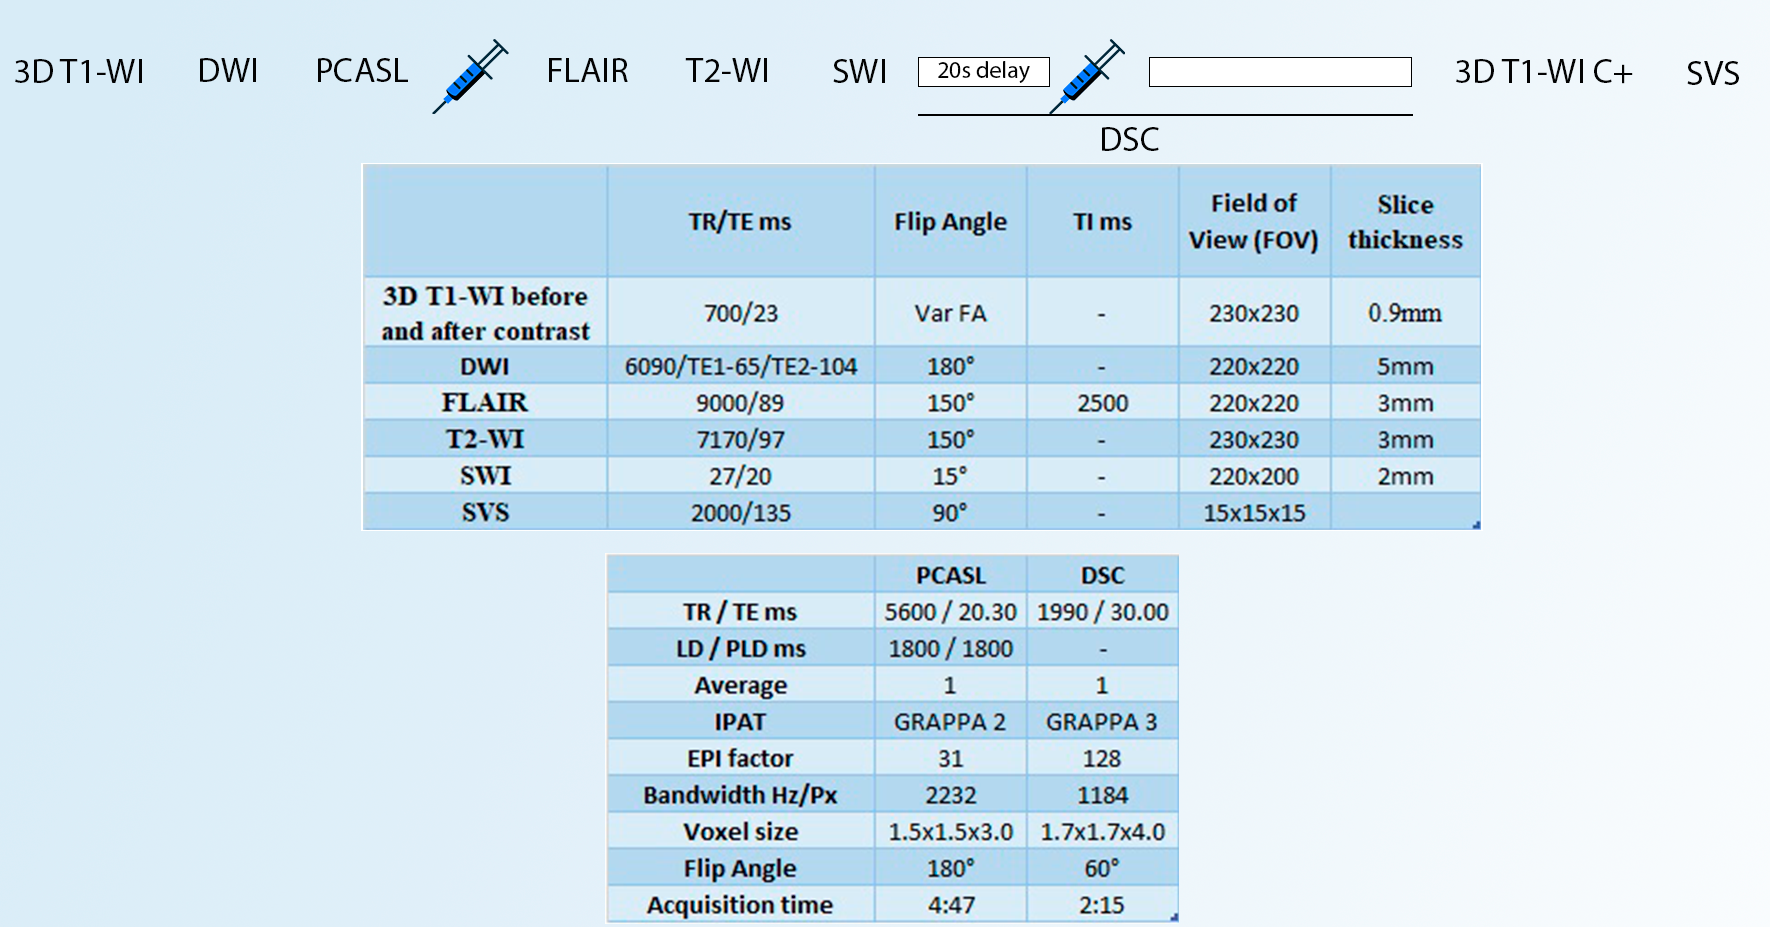
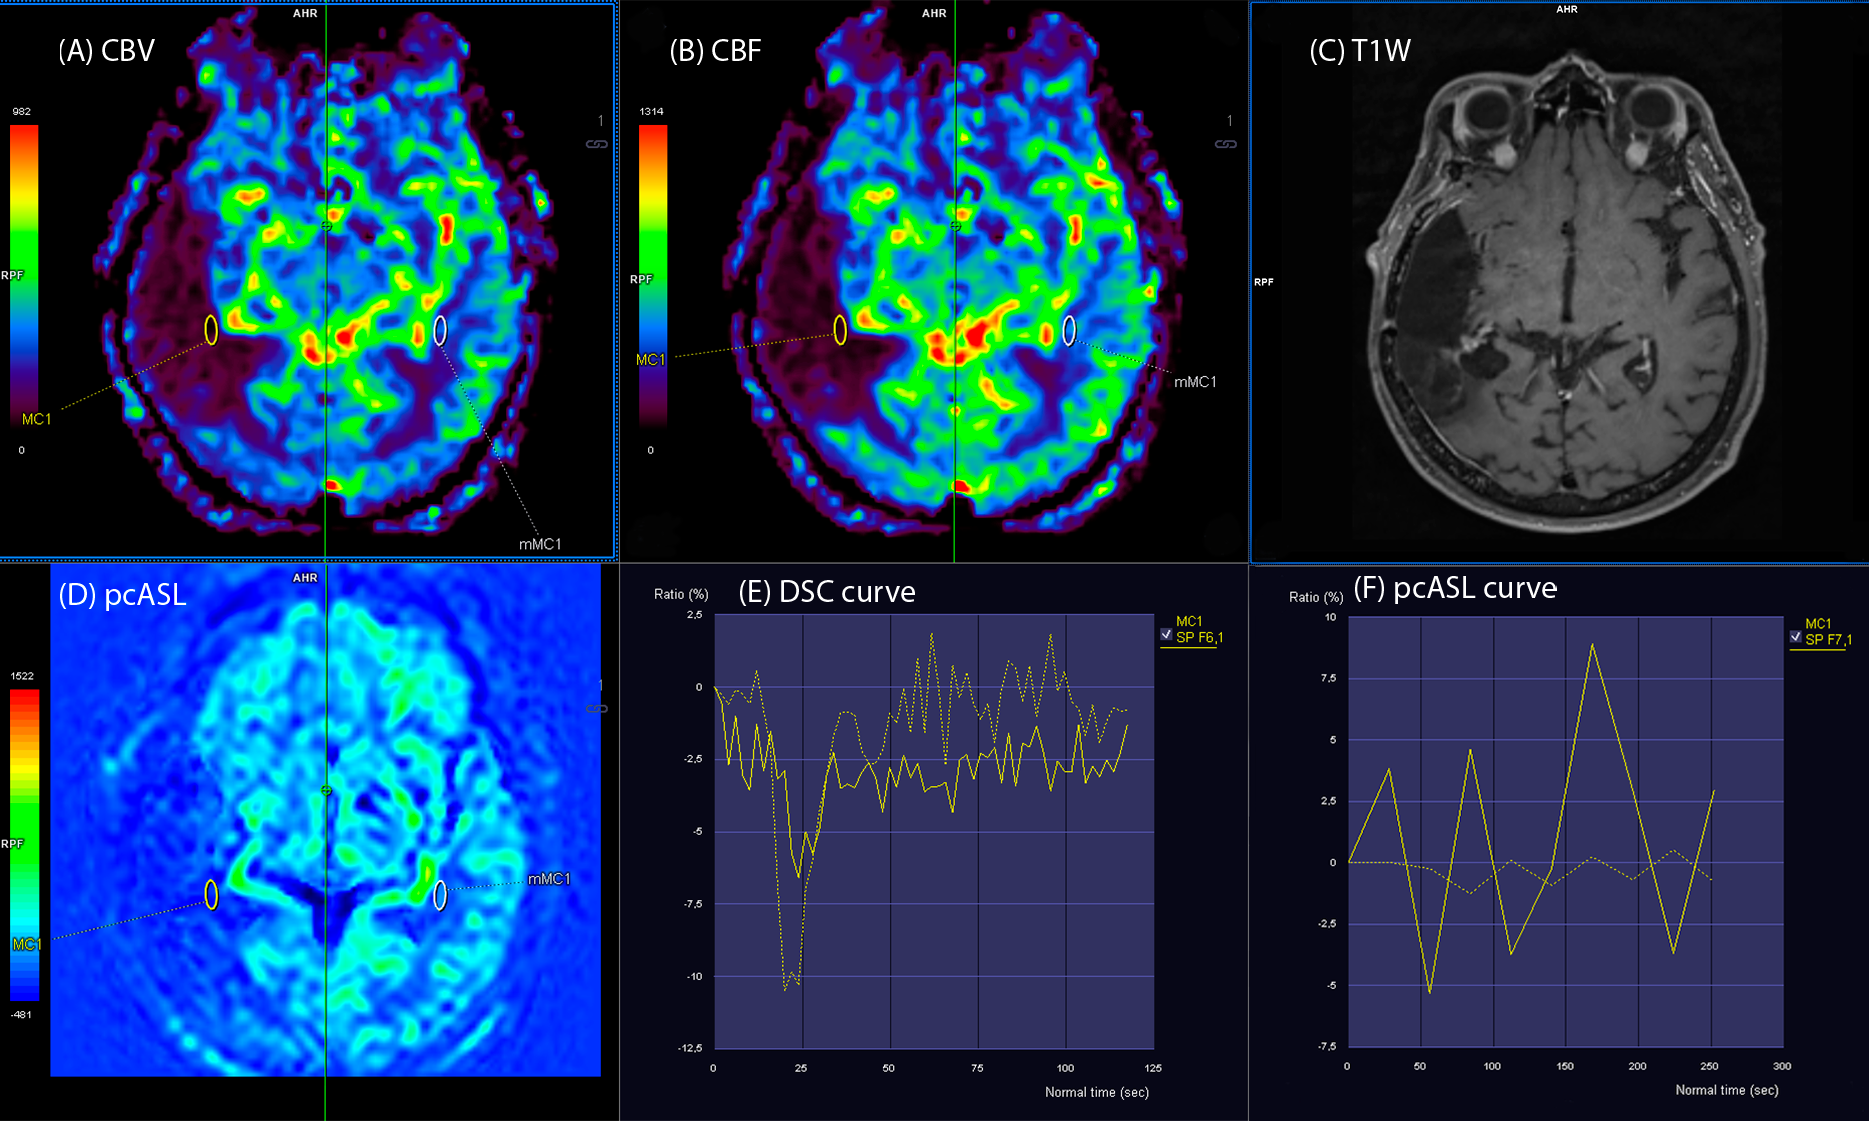
All MRI studies were performed using a 3T scanner (Vida; Siemens Healthineers, Erlangen, Germany) with a 20‐channel head/neck coil. The MRI protocol included the following sequences: 3D T1-WI, DWI, PCASL, FLAIR, T2-WI, SWI, DSC, SVS (Fig.1).
Bolus injection of the GBCA have been commenced after about a 20-second delay, a rapid bolus of contrast agent was administered intravenously at a rate of 5 ml/s using a power injector, immediately followed by a 20 ml saline flush at the same rate. DSC data collection comprised a total of 60 series (2 min 15 s). GBCA was injected at a dose of 0.1 mmol/kg of body weight.
20 patients were included – (13 males and 7 females, 47±12 years old), who was examined to determine the nature of the response to treatment. All patients underwent surgery and received adjuvant treatment (radiation therapy + chemotherapy). Tumor pathology included: glioblastoma GBM (WHO grIV), n=13; anaplastic astrocytoma AA (WHO grIII), n=5; and anaplastic oligoastrocytoma AO (WHO grIII) n = 2.
The area of the suspected tumor was identified using conventional MRI sequences. Small regions of interest (ROI) were drawn exactly over the presumed tumor area at the resection site, excluding areas of necrosis, hemorrhage, etc.
Areas of interest 0.5–1 cm in size were drawn at several locations on the presumed tumor area CBV map, and the area with maximum CBV was identified and measured. CBV values were also calculated from contralateral normal white matter. rCBV was calculated as the ratio of the maximum CBV from the tumor region to the CBV from the contralateral normal region. Similarly, rCBF values were obtained on CBF maps (DSC and ASL).
For analysis of tumor perfusion, rCBV and rCBF perfusion maps were created using software package MR. Neurology syngo.via (Germany). Spearman’s correlation test and Mann-Whitney test were used in statistical analyses (SPSS 17.0).
Results
As a result of the study all patients were divided into 4 groups depending on the CBF and CBV value.Group 1 - 15 patients with pathological increase in cerebral blood flow according to ASL and / or DSC perfusion maps, which is typical for tumor recurrence.
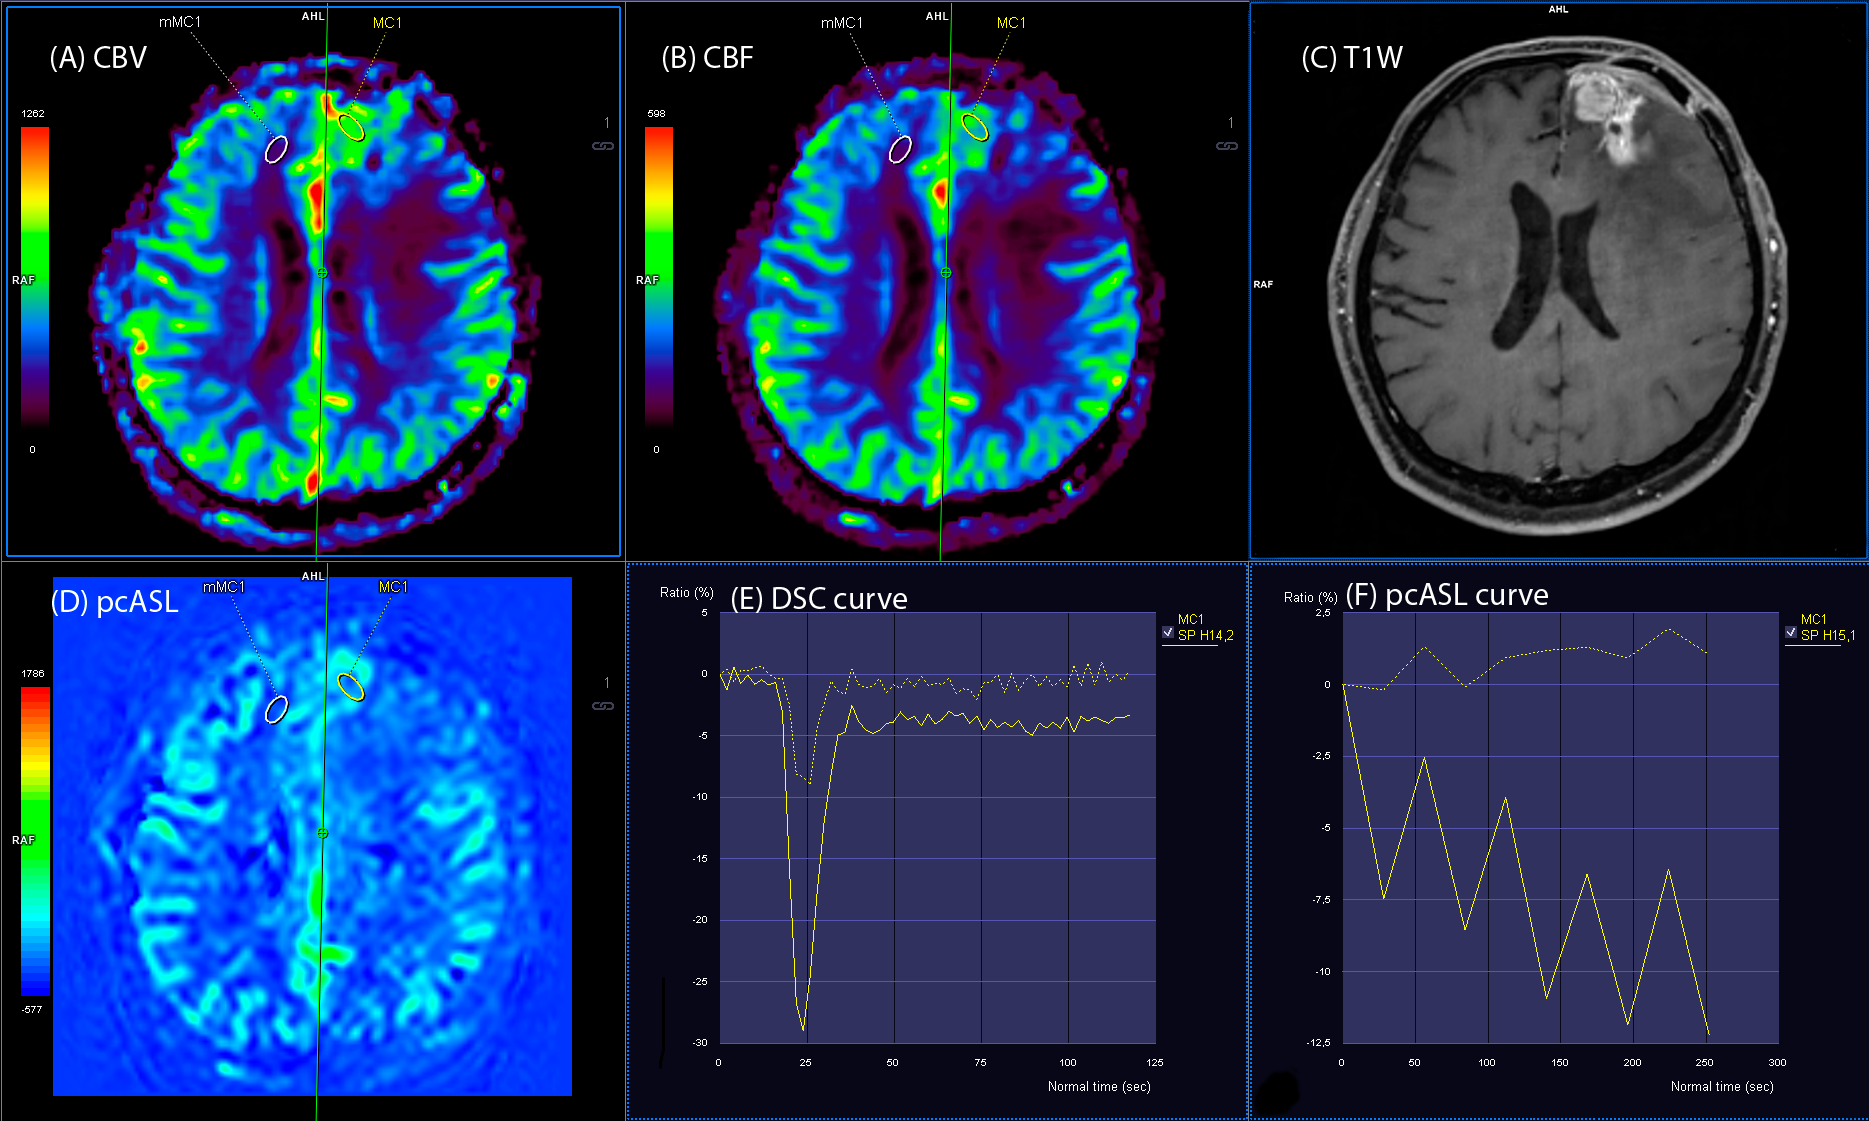
- subgroup 1a - 12 patients (60%) with significant, more than 2 times higher rCBF and rCBV values in the putative tumor focus in relation to the contralateral white matter in the ASL and DSC perfusion maps. (Fig. 2) There was good correlation between the ASL and DSC perfusion maps (r=0.73)
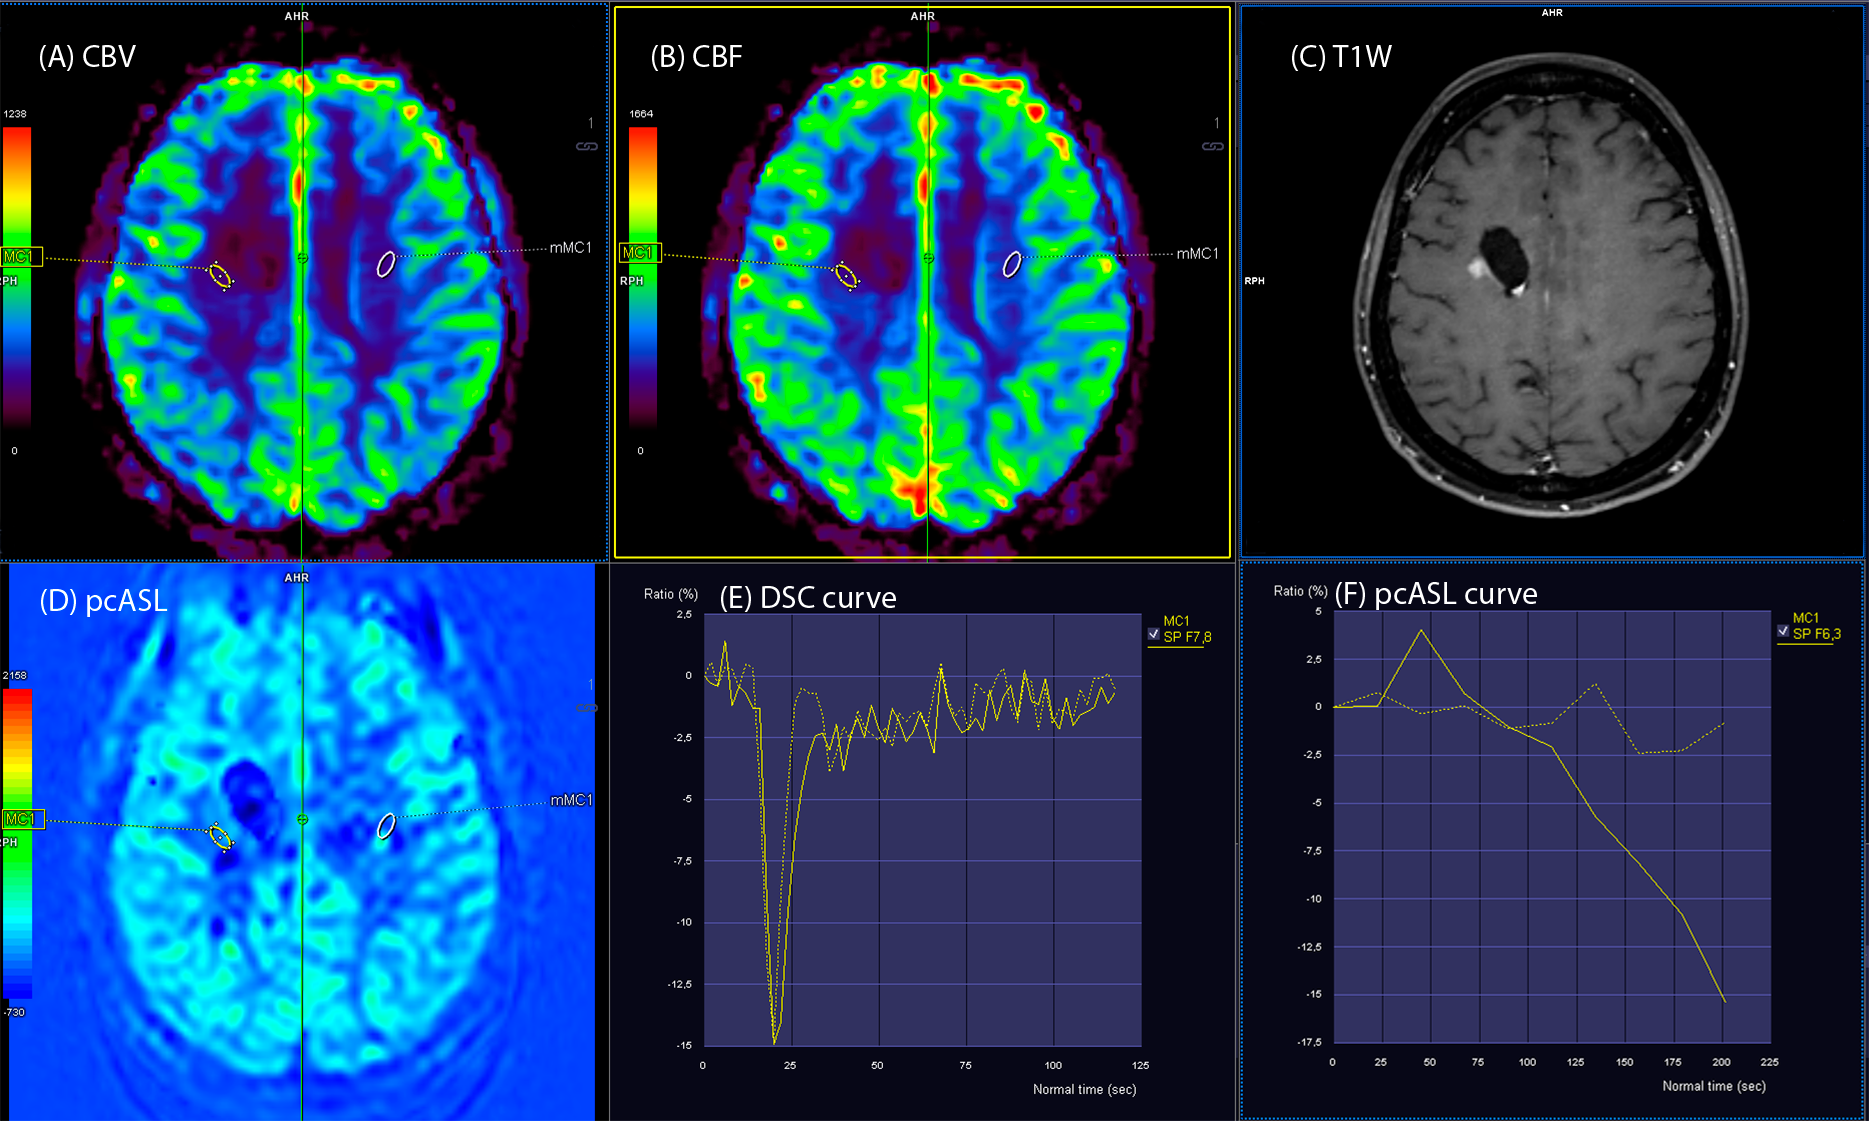
- subgroup 1b - 3 patients (15%) with significant, more
than 2 times higher rCBF values only on the ASL perfusion maps in the putative
tumor focus in relation to the contralateral white matter (p<0.05) (Fig. 3).
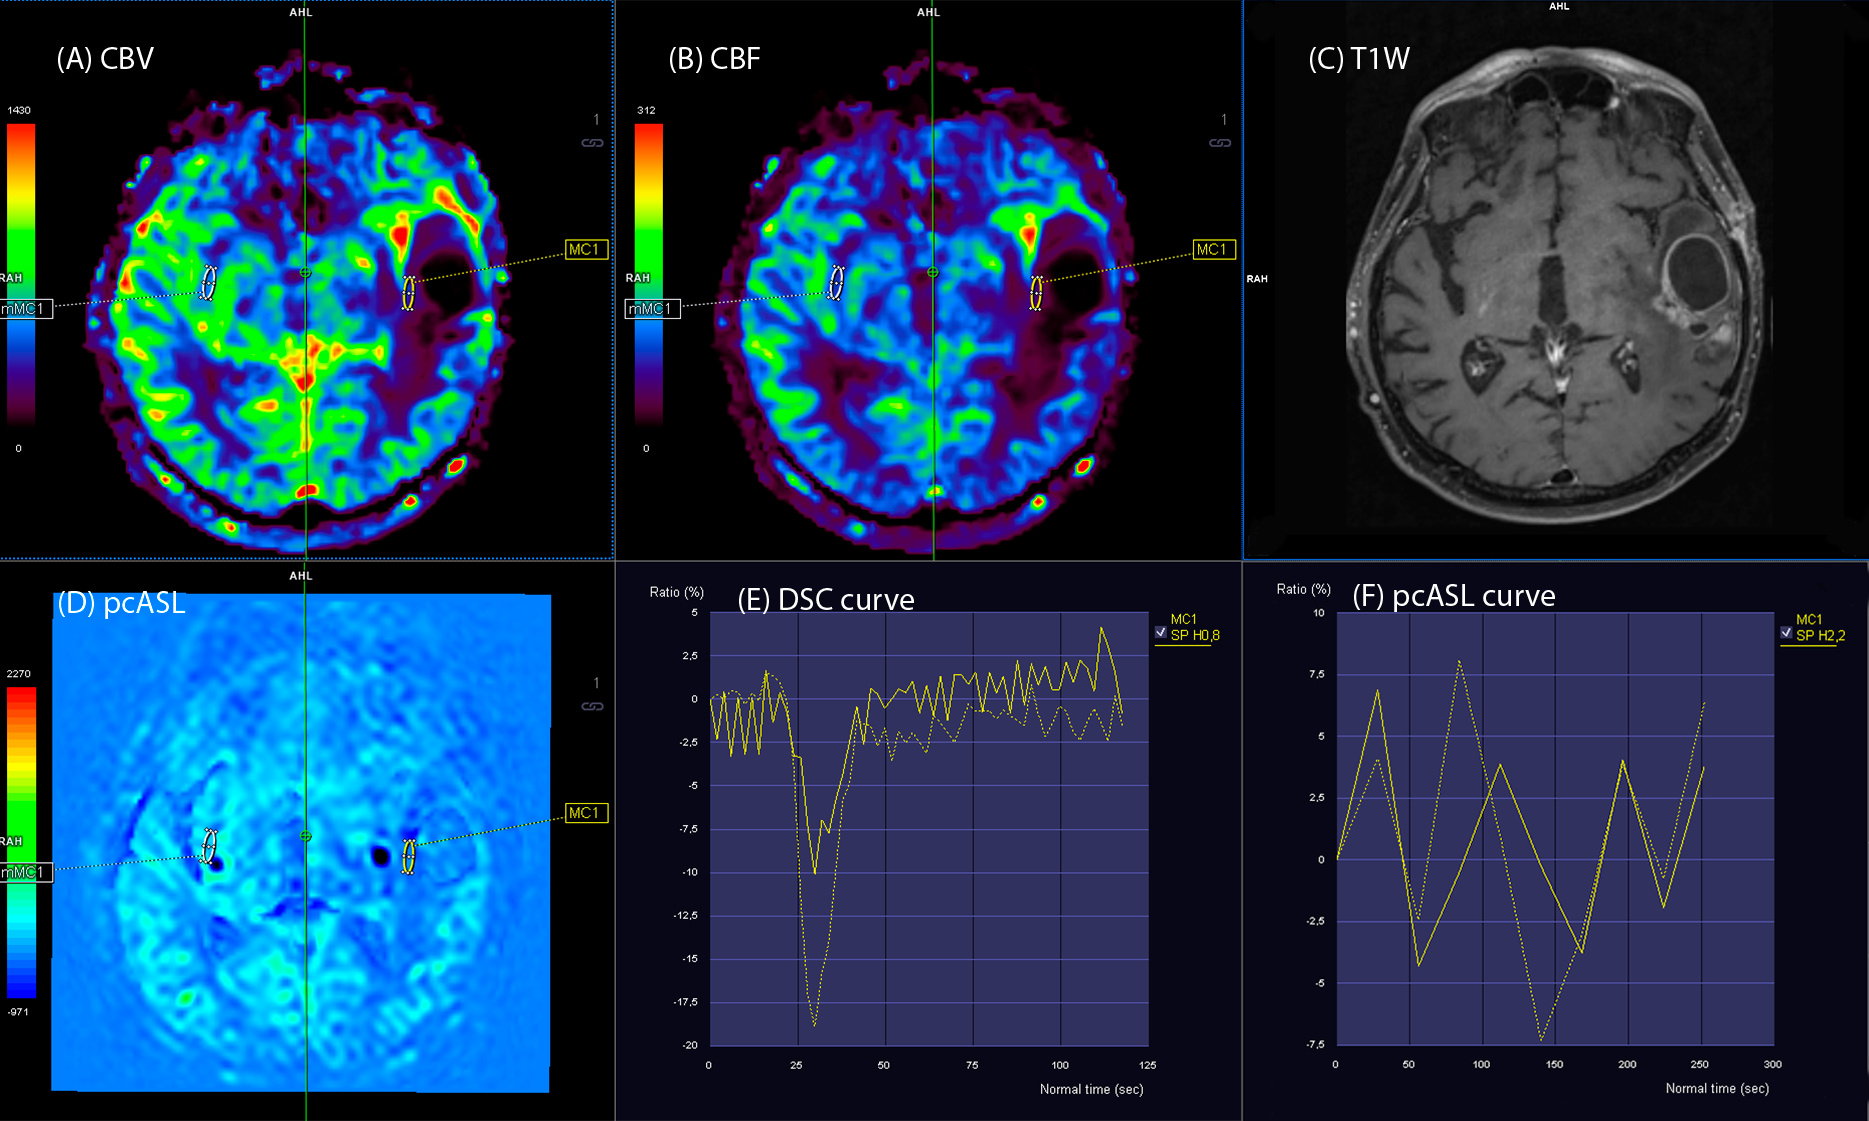
Group 3 - 2 patients (10%) without pathological increase rCBF and rCBV values in the postoperative area (rCBV, rCBF <1). (Fig. 5) There was good correlation between the ASL and DSC perfusion maps (r=0.89)
Conclusion
The addition of ASL perfusion warns against false negative interpretation because rCBV DSC values may not always reliably distinguish stable disease from progression.Acknowledgements
No acknowledgement found.References
1. Stupp R, Mason WP, van den Bent MJ, et al. Radiotherapy plus concomitant and adjuvant temozolomide for glioblastoma. N Engl J Med 2005;352:987–96.
2. Parvez K, Parvez A, Zadeh G. The diagnosis and treatment of pseudoprogression, radiation necrosis and brain tumor recurrence. Int J Mol Sci 2014;15:11832–46
3. Essig M, Shiroishi MS, Nguyen TB, et al. Perfusion MRI: the five most frequently asked technical questions. AJR Am J Roentgenol 2013; 200:24-34.
4. Wu Bing, Lou X, Wu X, Ma L : Intra-interscanner reliabiligy and reproducibility of 3D whole-brain psudo-continuous arterial spin-labeling MR perfusion at 3T. J Magn Reson Imaging 39 : 402-409, 2014.
5. Voglein J, Tuttenberg J, Weimer M, et al. Treatment monitoring in gliomas: comparison of dynamic susceptibility-weighted ontrastenhanced and spectroscopic MRI techniques for identifying treatment failure. Invest Radiol 2011;46:390e400.
6. Kumar AJ, Leeds NE, Fuller GN, et al. Malignant gliomas: MR imaging spectrum of radiation therapy and chemotherapy-induced necrosis of the brain after treatment. Radiology 2000;217(2):377–84.
Figures