2657
Correlation of vessel size and cerebral blood volume measurements in glioma genetic subtypes1Department of Radiology & Nuclear Medicine, Erasmus MC, Rotterdam, Netherlands, 2Erasmus MC Cancer Institute, Erasmus MC, Rotterdam, Netherlands, 3Department of Neurology, Erasmus MC, Rotterdam, Netherlands
Synopsis
Deep insight about tumor microvasculature is important for diagnosis and prognosis of glioma patients. Relative Cerebral Blood Volume (rCBV) and vessel size are two parameters, derived from perfusion MRI, used for evaluation of tumor microvasculature in glioma. In this study, we investigated the clinical value of both rCBV and vessel size and their correlation for three subgroups of glioma based on the recent 2021 World Health Organization (WHO) classification scheme. The result showed that neither rCBV nor vessel size differed significantly between glioma subtypes, though correlation of these two parameters sheds light on the microvasculature characteristics of each subgroup.
The most commonly assessed imaging biomarker of tumor vasculature is rCBV coming from dynamic susceptibility contrast (DSC) MRI. Although previous work illustrated that increased rCBV corresponds to increased malignancy in diffuse glioma, in practice this does not hold when oligodendroglioma - as defined in the WHO 2021 classification scheme - are included (2). This type of tumor is known for its “chicken wire” vasculature, which in turn can lead to high rCBV values (3). When extending DSC MRI to assess simultaneous acquisition of T2 and T2* weighted images to follow the passage of a gadolinium-based contrast agent (GBCA) through the cerebral vasculature, vessel size imaging (VSI) can be done, that has the potential to add information about microvascular structure. We explored using VSI in addition to rCBV to assess three diffuse glioma subtypes present within the WHO 2021 glioma classification.
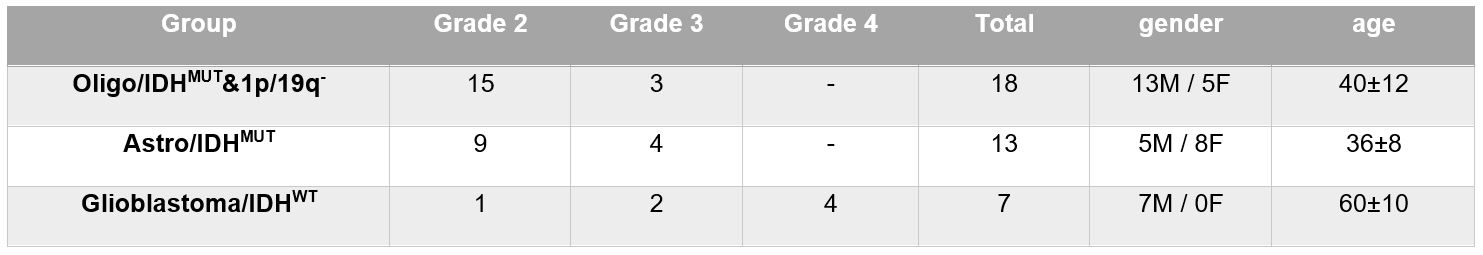
Materials and Methods: A retrospective dataset consisting of 38 patients with confirmed non-enhancing glioma was used and classified in three groups: Oligo/IDHMUT&1p/19q-, Astro/IDHMUT, and Glioblastoma/IDHWT (4). All patients underwent 3T MRI scanning (GE, Milwaukee, WI, USA) prior to surgery. For DSC MRI, Hybrid EPI (HEPI) was used with following parameters: 122 repetitions, TR: 1500 ms, FOV: 15 slices, voxel size: 1.88x1.88x4.00 mm3, TE(GRE): 18.6 ms and TE(SE): 69 ms, with administration of 7.5 ml of GBCA (Gadovist, Bayer, Leverkusen, GE). A pre-load bolus of equal size was administrated 5 minutes before the DSC scan was acquired. Diffusion weighted imaging (2 b-values: 0, 1000 s/mm2, voxel size: 1x1x3 mm3 and TE/TR of 63/5000 ms) was done to estimate the apparent diffusion coefficient (ADC) required for VSI. High resolution T1-weighed pre- and post-contrast (voxel size: 1x1x0.5 mm3; TE/TR: 2.1/6.1 ms), T2 (voxel size: 0.5x0.5x3.2 mm3; TE/TR: 107/10000 ms), and FLAIR (voxel size: 0.6x0.5x0.5 mm3; TE/TR: 106/6000 ms) images were acquired and used for tumor segmentation.
Estimates of mean vessel size and normalized rCBV maps were made according to previously described methods (5,6). HD-GLIO was used to generate tumor regions of interest (ROI) for all patient (7). Average tumor vessel size, normalized rCBV, and ADC were calculated for each group of patients. Additionally, correlation analysis was performed between rCBV and vessel size for each subgroup.
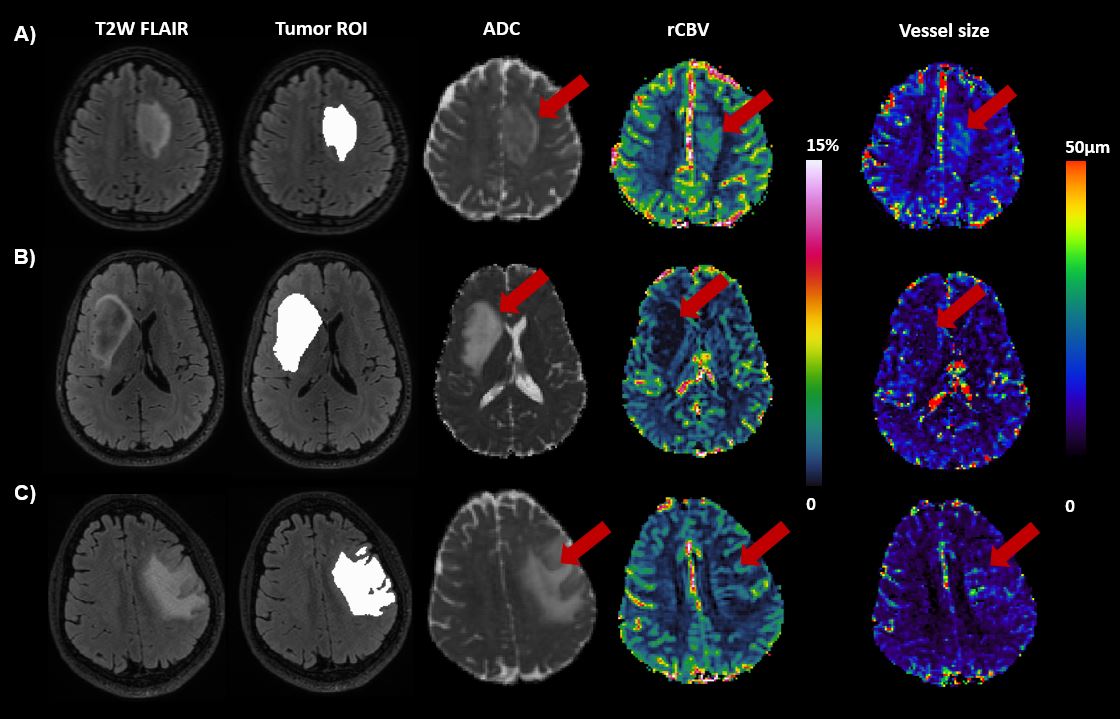
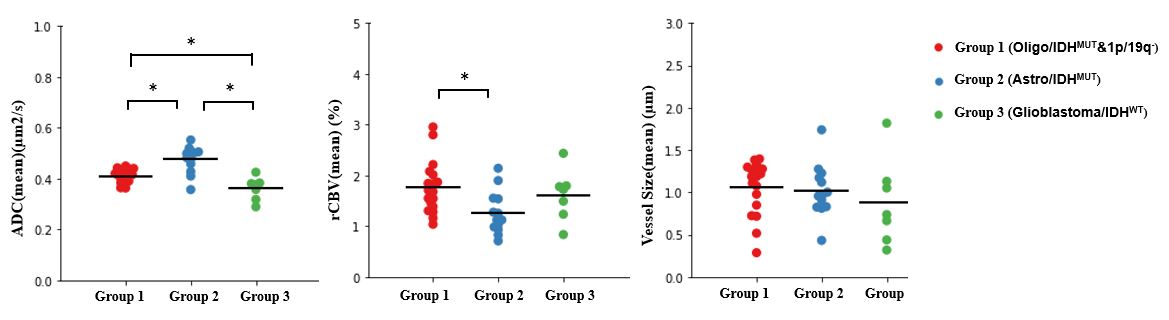
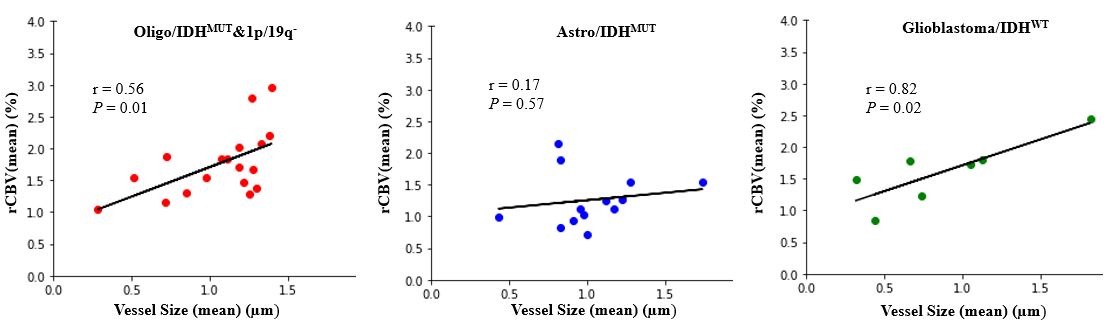
Results: Patient information is summarized in Table 1. Figure 1 shows an example slice of ADC, rCBV and vessel size maps for three patients, each selected from one subgroup. The average of the microvascular parameters (rCBV, vessel size) and ADC are presented in figure 2 for each patient and each group. In Oligo/IDHMUT&1p/19q-, rCBV was significantly higher compared to Astro/IDHMUT (p < 0.05, unpaired t-test), but equal to Glioblastoma/IDHWT. A trend of increased vessel size was found for Oligo/IDHMUT&1p/19q- and Astro/IDHMUT compared to Glioblastoma/IDHWT, but no significant differences were found. Vessel size and rCBV showed strong correlation in Glioblastoma/IDHWT (r=0.82, p=0.02), moderate correlation in Oligo/IDHMUT&1p/19q- (r=0.56, p=0.01) and no correlation in Astro/IDHMUT (r=0.17, p=0.57) (Fig. 3).
Discussion: The result of this study on nonenhancing glioma suggests that rCBV and vessel size alone cannot distinguish between three subgroups based on the 2021 WHO guidelines. However, combining these two parameters and measuring the correlation of these two parameters sheds light on the microvasculature characteristics of each subgroup.
Intuitively it might be expected that vessel size and rCBV are positively correlated, however this correlation is modulated by the vessel density. In other words, in an area with densely packed microvessels, slight change in vessel diameters can result in a considerable change in rCBV, whereas in an area with low vessel density, change in vessel diameters may lead to no or limited change in rCBV. Oligo/IDHMUT&1p/19q- with high rCBV and high VSI showing a moderate relationship between these two parameters, might be reflecting high vessel density. Low density might be present within the Astro/IDHMUT, as we see no correlation - while in Glioblastoma/IDHWT our findings indicate high vessel density. Note that this would be in line with the histopathological findings in (3). Future work validating these results should include histology measurements of vessel size and mean vessel density of targeted biopsies of tumor tissue based on rCBV and vessel size and investigation of the clinical applicability of VSI in glioma imaging diagnostics.
Acknowledgements
No acknowledgement found.References
1. Lebelt A, Dziecioł J, Guzińska-Ustymowicz K, Lemancewicz D, Zimnoch L, Czykier E. Angiogenesis in gliomas. Folia Histochem Cytobiol (2008) 46: doi:10.2478/v10042-008-0009-4
2. Louis DN, Perry A, Wesseling P, Brat DJ, Cree IA, Figarella-Branger D, Hawkins C, Ng HK, Pfister SM, Reifenberger G, et al. The 2021 WHO Classification of Tumors of the Central Nervous System: a summary. Neuro Oncol (2021) 23:1231–1251. doi:10.1093/neuonc/noab106
3. Guo H, Kang H, Tong H, Du X, Liu H, Tan Y, Yang Y, Wang S, Zhang W. Microvascular characteristics of lower-grade diffuse gliomas: investigating vessel size imaging for differentiating grades and subtypes. Eur Radiol (2019) 29:1893–1902. doi:10.1007/s00330-018-5738-y
4. van der Voort SR, Incekara F, Wijnenga MMJ, Kapas G, Gardeniers M, Schouten JW, Starmans MPA, Tewarie RN, Lycklama GJ, French PJ, et al. Predicting the 1p/19q codeletion status of presumed low-grade glioma with an externally validated machine learning algorithm. Clin Cancer Res (2019) doi:10.1158/1078-0432.CCR-19-1127
5. Arzanforoosh F, Croal PL, van Garderen KA, Smits M, Chappell MA, Warnert EAH. Effect of Applying Leakage Correction on rCBV Measurement Derived From DSC-MRI in Enhancing and Nonenhancing Glioma. Front Oncol (2021) 11: doi:10.3389/fonc.2021.648528
6. Kiselev VG, Strecker R, Ziyeh S, Speck O, Hennig J. Vessel size imaging in humans. Magn Reson Med (2005) 53:553–563. doi:10.1002/mrm.20383
7. Kickingereder P, Isensee F, Tursunova I, Petersen J, Neuberger U, Bonekamp D, Brugnara G, Schell M, Kessler T, Foltyn M, et al. Automated quantitative tumour response assessment of MRI in neuro-oncology with artificial neural networks: a multicentre, retrospective study. Lancet Oncol (2019) 20:728–740. doi:10.1016/S1470-2045(19)30098-1
Figures