2656
IDH mutation prediction in glioma patients using 7T 3D-FID-MRSI1High Field MR Centre, Department of Biomedical Imaging and Image-guided Therapy, Medical University of Vienna, Vienna, Austria, 2Department of Neurosurgery, Medical University of Vienna, Vienna, Austria, 3Division of Neuroradiology and Musculoskeletal Radiology, Department of Biomedical Imaging and Image-guided Therapy, Medical University of Vienna, Vienna, Austria, 4Department of Biomedical Imaging and Image-guided Therapy, Computational Imaging Research Lab (CIR), Medical University of Vienna, Vienna, Austria, 5Christian Doppler Laboratory for Clinical Molecular MR Imaging, Vienna, Austria, 6Division of Oncology, Department of Inner Medicine I, Medical University of Vienna, Vienna, Austria, 7Division of Neuropathology and Neurochemistry, Department of Neurology, Medical University of Vienna, Vienna, Austria, 8Division of Medical Imaging and Nuclear Medicine, Medical University of Vienna, Vienna, Austria
Synopsis
We used brain MRSI to explore the differentiation of gliomas regarding IDH-1 and Wildtype mutation. We found significant differencesin metabolites like Gln/NAA, Ins/NAA, and GPC+PCh/NAA using the Mann-Whitney-Wilcoxon test. More metabolites with signifi-cant differentiation were used for IDH classification using Random Forest, which also showed better classification results with additionalmetabolites than GPC+PCh/NAA alone. The ROC curve with more than GPC+PCh/NAA as feature yields an AUC value of 81 %.
Summary of findings
Using an array of metabolites quantifiable with 7T MRSI showed significant differentiation between IDH-1 Wildtype mutation. Including other metabolite ratios improved the classification of IDH mutation.Introduction
Intending to identify biomarkers to differentiate glioma grades and neoplastic mutations of isocitrate dehydrogenase, with 80 % persistence in grade II and III gliomas (Yan et al., 2009), we explored 7T (7 Tesla) magnetic resonance spectroscopic imaging (MRSI) with its inherently increased spatial and spectral resolution for IDH classification and prediction.This is usually done with specific sequences for the quantification of 2-hydroxyglutarate (An et al., 2018), which our method is not sensitive to. As we recently demonstrated glutamine and glycine as potential biomarkers of interest in high-grade gliomas (Hangel et al., 2020) with the help of 7T magnetic resonance spectroscopic imaging (MRSI), an increased array of metabolites could have the potential for the non-invasive determination of glioma properties.Methods
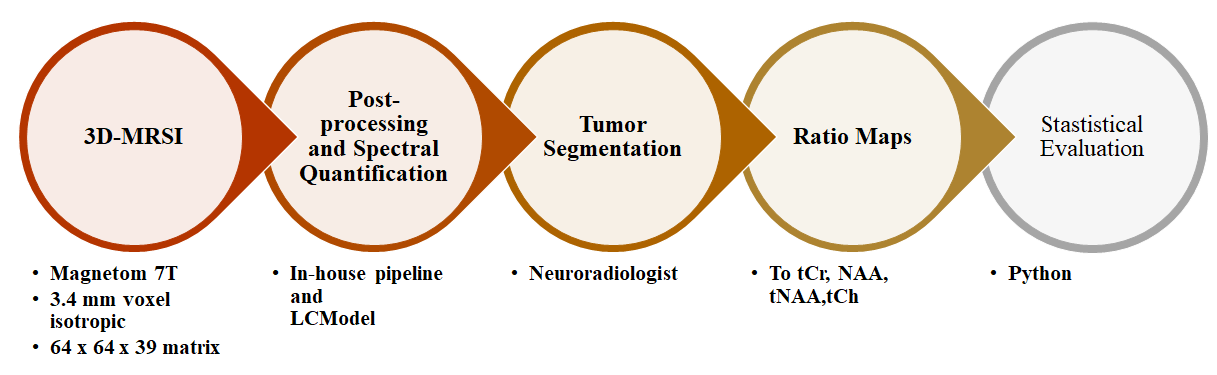
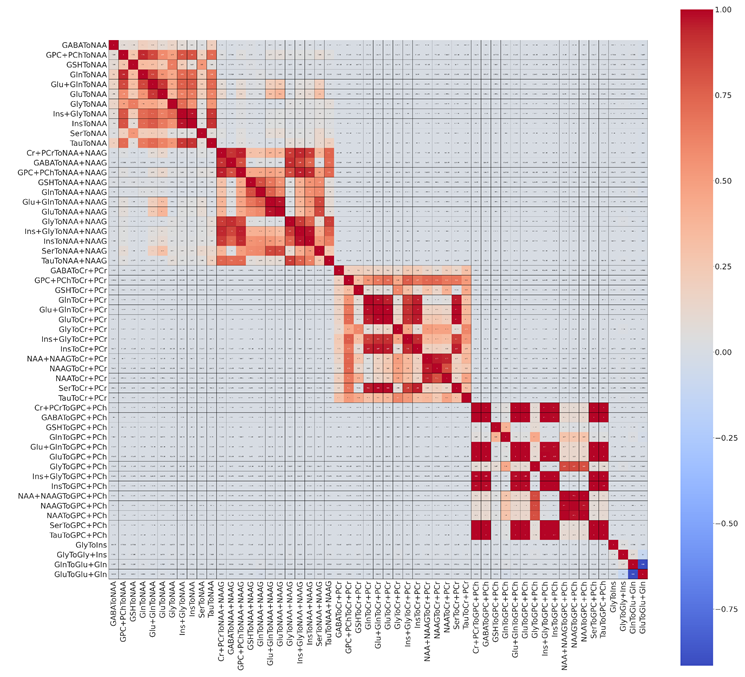
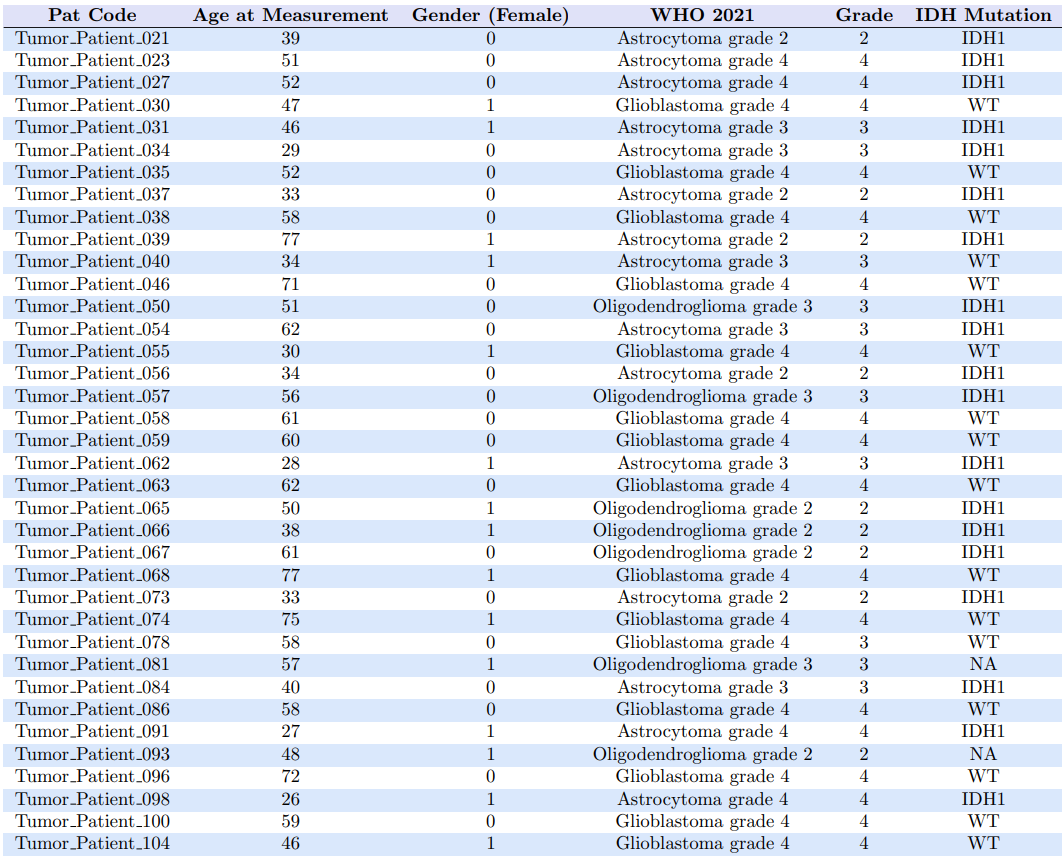
The study recruited 37 preoperative glioma patients (median age : 51 +-24 ) without any contraindications for 7T MRI. The cohort consisted of 27 patients with high-grade gliomas (HGG) and 10 with low-grade gliomas (LGG), with 19 IDH-1 mutations and 16 wildtype mutations altogether. The MRSI measurement at a Siemens Magnetom 7T with a 64 x 64 x 39 matrix and isotropic 3.4 mm voxels took 15 min with a TR of 450ms (Hangel et al., 2020).MP2RAGE and FLAIR with 0.8 mm isotropic resolution as acquired as well. The scans were post-processed using an in-house pipeline (Povaˇzan et al., 2015) and LCMODEL (Provencher, 2001). Manual tumor segmentation based on routine 3T MRI by a neuroradiologist was used for masking tumor segments. Tumors were segmented into Necrosis(Nec), Contrast Enhancing (CE), and Non-Contrast Enhancing (NCE) regions. The ratio maps to total Creatine (tCr), N-acetyl aspartate (NAA), total Nacetyl aspartate, and total Choline (tCr) were created out of the original maps obtained from measurement. The whole process is elaborated in figure1. General and histopathological information 1of all patients were stored along with their metabolite ratios in a single table and stored as a CSV file. Each ratio went through a Mann-Whitney Wilcoxon (MWW) test to identify statistically significant differences in IDH mutation status, and respective boxplots were analyzed. A Random Forest regression was used for IDH mutation prediction. The metabolite ratios were further filtered based on the correlation matrix as in figure 2and cross-validation. We used the filtered set of metabolite ratios as features for the Random Forest regression. The ”one subject left out” method was used for training and prediction. Receiver operating characteristic (ROC) curves were then plotted for hotspot regions comparing different thresholds adopted from Hangel et al. (2021). The minimum, maximum and mean value of ’GPC+PChToNAA’, ’GPC+PChToNAA+NAAG’ and ’GlnToNAA+NAAG’ were calculated from Hangel et al. (2021) and used for thresholding and plotting ROC curves and their Area Under Curve (AUC) values.Results
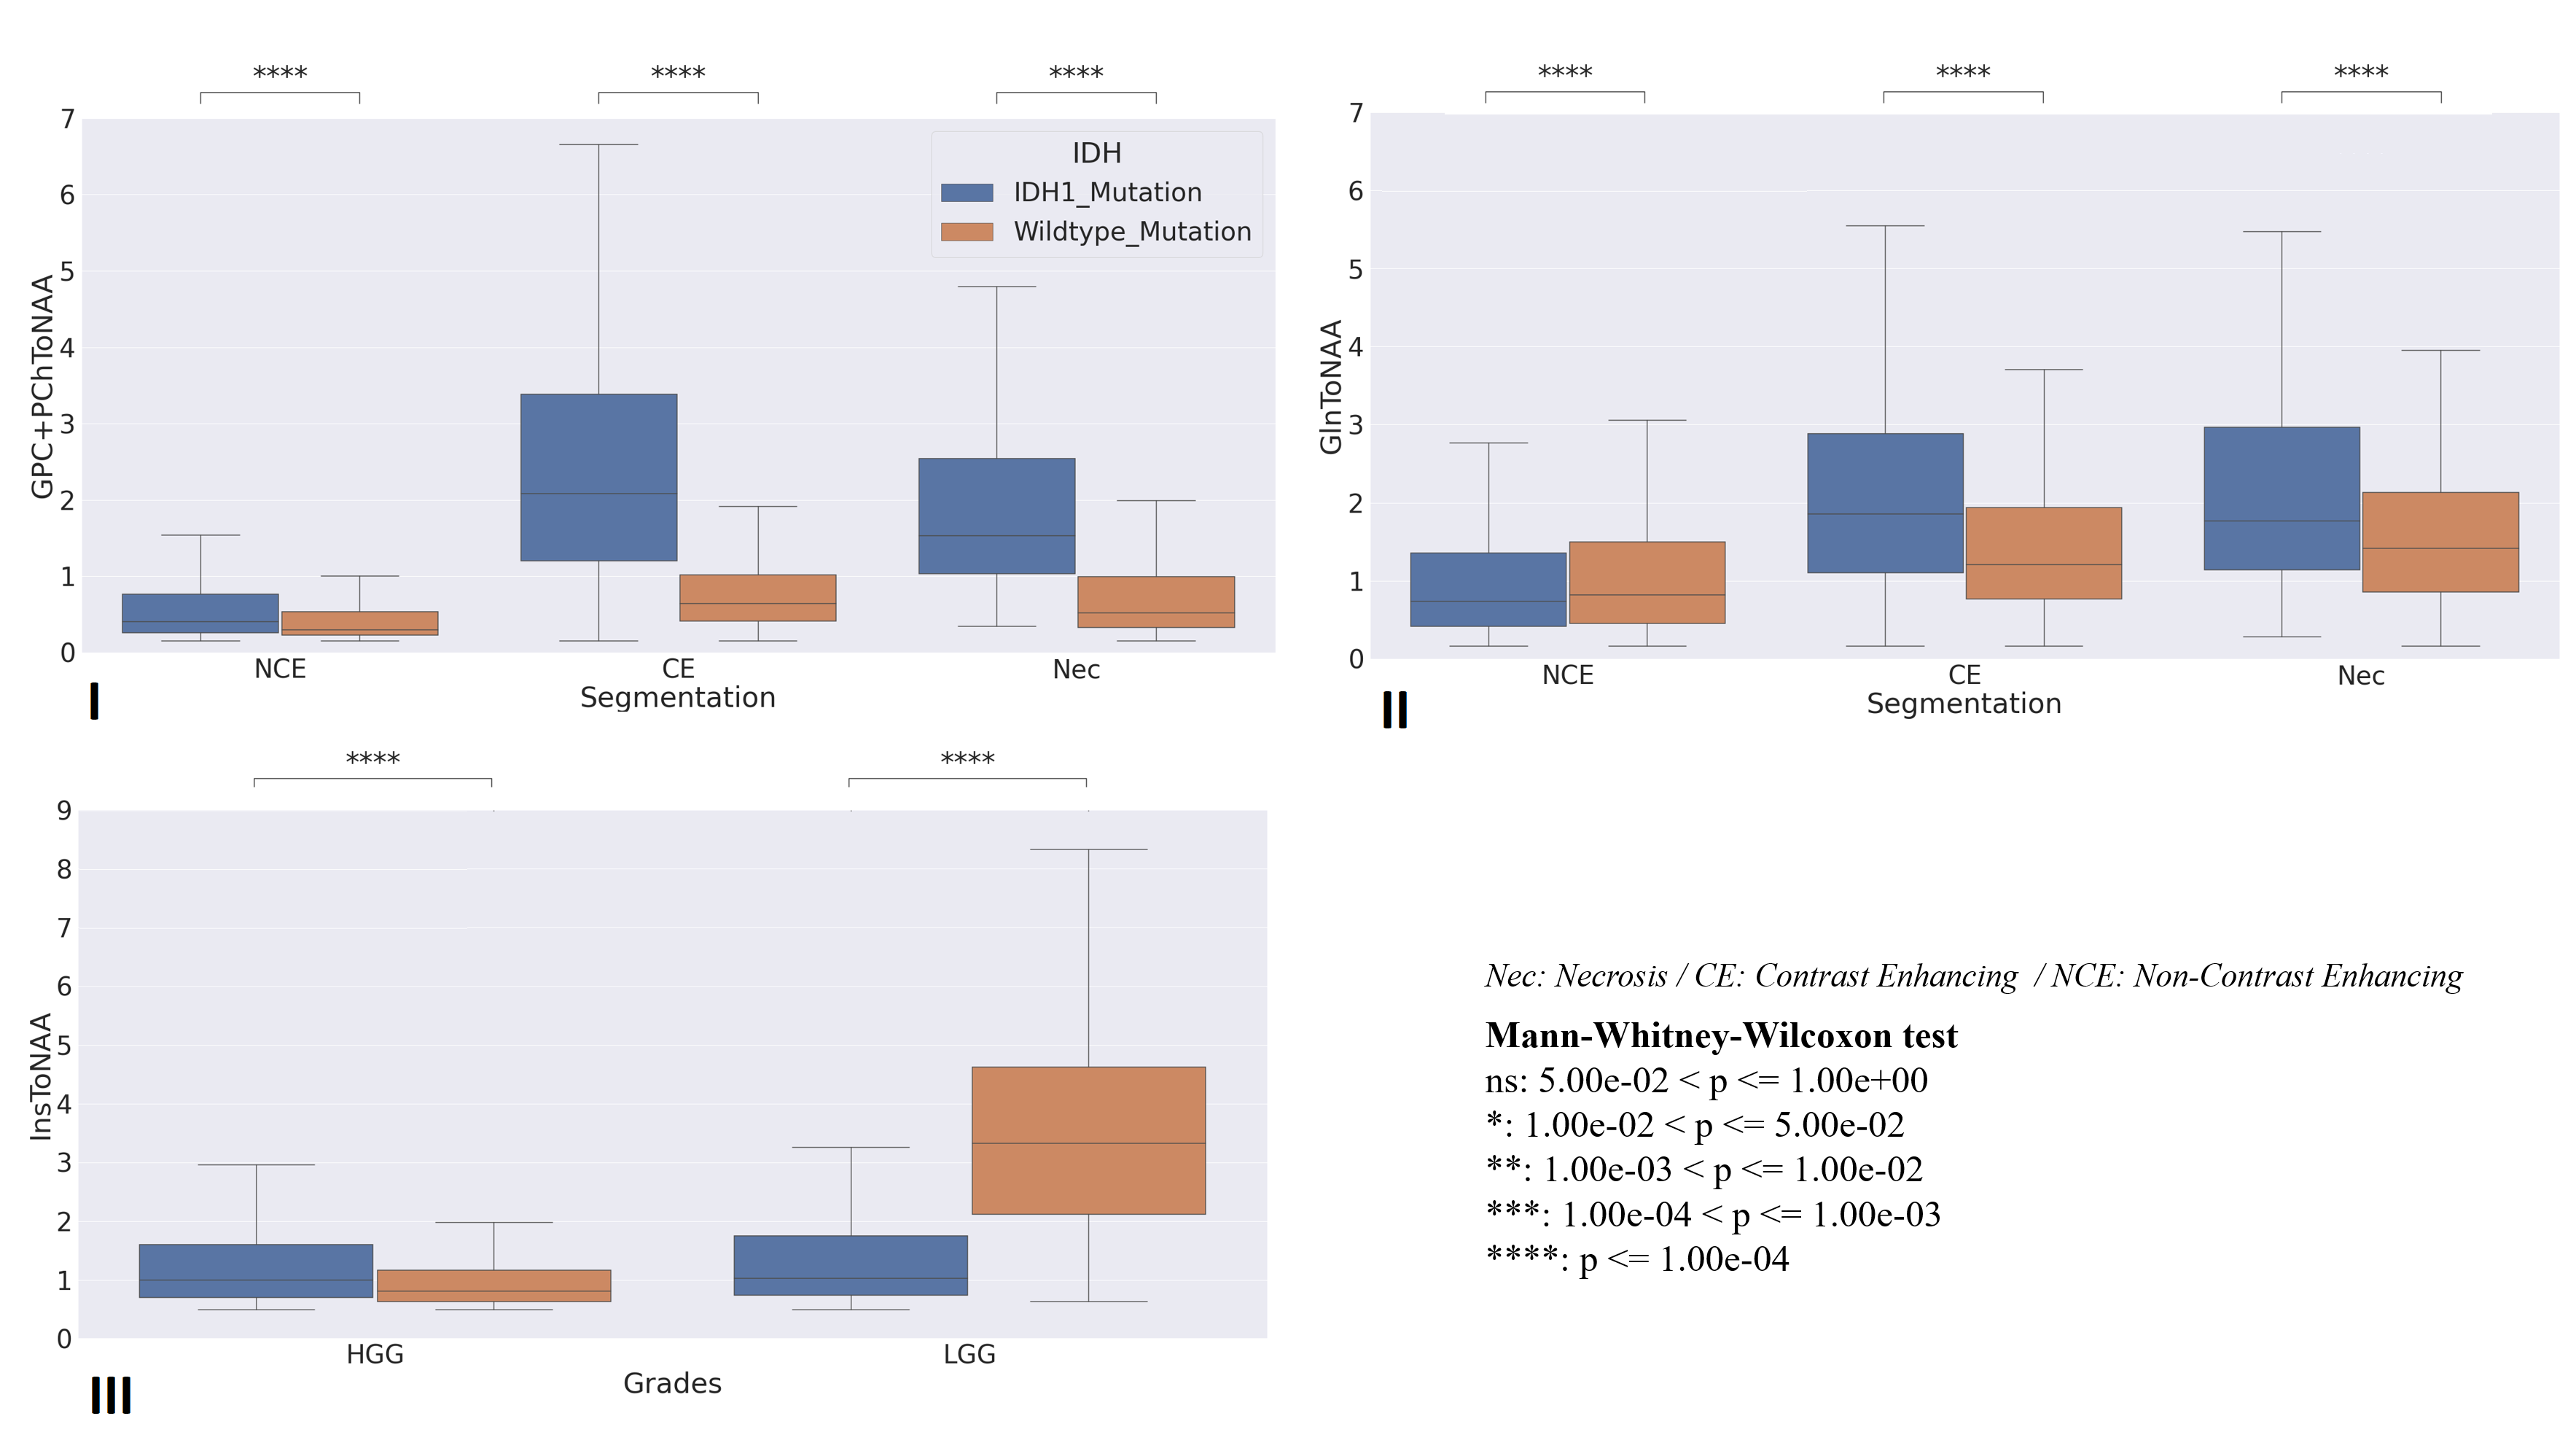
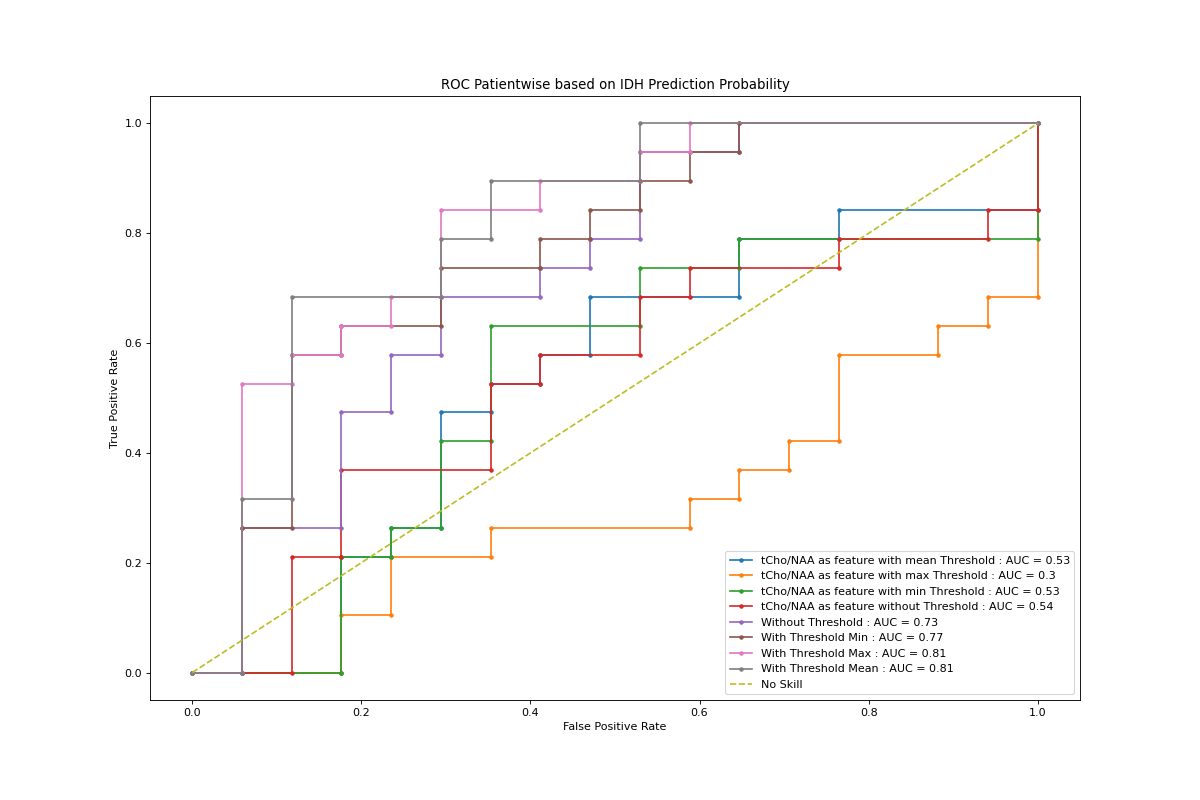
A significant difference was found in the MWW test for tCh to NAA and Gln to NAA while comparing IDH-1 and IDH Wildtype as in Figures3 I and II. Also, the comparison of LGGs and HGGs presented a significant difference for Ins to NAA as in figure 3 III. The result from the MWW test for several such metabolites was good motivation for us to perform IDH classification with metabolite ratios as features. The ROC curves for prediction using only total Choline to N-acetyl aspartate (tCho/NAA) show that using minimum and maximum values as ROI thresholds makes a big difference of AUC values, e.g., 0.3 to 0.54. The second one performed better when compared with a regression with more than tCho/NAA as features. When we compare only tCho/NAA as feature vs. including others as features, in the case of mean threshold, the second one with more features has better performance with AUC value 0.81 over 0.53 with tCho/NAA as a feature with a mean threshold.Conclusion
From our evaluation, extending the standard tCho/tNAA ratios by others like Gln/NAA and Ins/NAA appears to improve IDH differentiation that is independent of 2-HG quantification. From the ROC curves, we saw the possibility of achieving 70-80 % sensitivity and specificity. We still need to overcome some of our limitations, like the size of the patient cohort,and a lack of LGG with IDH Wildtype mutation patients. We further intend to expand our study to grade classification and other molecular markers.Acknowledgements
This work was supported by the Austrian Science Fund (FWF) grants KLI-646, P 30701 and P 34198.References
1. An, Z., Tiwari, V. et al. Echo-planar spectroscopic imaging with dual-readout alternated gradients (DRAG-EPSI) at 7 T: Application for 2-hydroxyglutarate imaging in glioma patients. Magnetic
Resonance in Medicine, 79 (4), 1851–1861. https://doi.org/10.1002/mrm.26884 
2. Hangel, G., Cadrien, C., Lazen, P. et al. High-resolution metabolic imaging of high-grade gliomas using
7T-CRT-FID-MRSI, 2020. NeuroImage: Clinical, 28, 102433. https://doi.org/10.1016/j.nicl.2020.102433
3. Hangel, G., Spurny-Dworak, B., Lazen, P. et al. Inter-subject stability and regional concentration estimates of 3D-FID-MRSI in the human brain
at 7 T, 2021. NMR in Biomedicine. https://doi.org/10.1002/nbm.4596
4. Povazan, M., Strasser, B., Hangel, G. et al. Multimodal post-processing software for MRSI data evaluation, 2015. Proc Int Soc Magn Reson Med.
5. Provencher, S. W. (2001). Automatic quantitation of localized in vivo 1H spectra with LCModel . NMR in Biomedicine,
14 (4), 260–264. https://doi.org/10.1002/nbm.698
6. Yan, H., Parsons, D. W., Jin, G. et al. IDH1 and IDH2 mutations in gliomas, 2009. The New England
Journal of Medicine. https://doi.org/10.1056/NEJMoa0808710
Figures