2652
A Novel GBM Infiltration Biomarker for Predicting Outcome: Clinical Study & Translational Preclinical Validation of ADC vs Tumor Cellularity1Centre for Clinical Brain Sciences, University of Edinburgh, Edinburgh, United Kingdom, 2Glasgow Experimental MRI Centre, University of Glasgow, Glasgow, United Kingdom, 3Wolfson Wohl Translational Research Centre, University of Glasgow, Glasgow, United Kingdom
Synopsis
We report a novel clinical putative glioblastoma (GBM) biomarker of infiltration which predicts overall survival at presentation. Given the extreme challenges in obtaining comprehensive spatially matched MRI and tissue in humans to explore the biomarker biology, we assessed the relation between tumoral cellularity and ADC values in matched histology and MRI in a rodent infiltrating human xenograft GBM model. We demonstrate that the ADC slope measured along linear profiles perpendicular to the boundary of solid macroscopic tumor visible on ADC is a biomarker predictive of overall survival in a single centre human cohort. We demonstrate a strong correlation between ADC and tumor cellularity in the preclinical model, supporting the hypothesis that a radial vectorial profile analysis of tumor ADC maps could provide with a robust clinical biomarker of glioblastoma cell infiltration and therefore outcome.
Introduction
Glioblastoma (GBM) is the most common and aggressive primary brain tumor. Median survival is just >1yr. Treatment failure results from microscopic tumor infiltration at presentation[1]. This precludes complete surgical resection, contributing to high local recurrence rates. An inability to detect infiltration on imaging limits accuracy of radiotherapy planning and safe supramaximal resection. Imaging for infiltrating tumor delineation is a major unmet clinical need, particularly with low/subliminal tumor cell density (TCD). Recent work has identified a negative correlation between ADC and cellularity in a range of tumors, including GBM[2,3,4]. However, biological tissue complexity and limited precision and opportunity for multiple biopsy makes the quantitative assessment of this relationship extremely challenging in patients. Preclinical models which recapitulate the infiltrating tumor margin observed in humans present an opportunity, providing precisely matched specific histology with contemporaneous high resolution MRI. We recently proposed a method of quantitative histopathologic assessment of MRI with stacked in-plane histology (SIH)[5]. This study aims to explore the correlation between MRI-ADC and TCD at the infiltrating margins, to assess whether ADC spatial changes represent a GBM infiltration biomarker. This was undertaken in three phases: A) hypothesis-driven putative clinical biomarker study was undertaken to assess the predictive value of ATC as a putative measure of marginal infiltration; B) voxelwise preclinical analysis was undertaken to quantitatively assess the relationship between ADC and TCD at the margin; and C) spatial correlation between ADC and tumor cellularity across the tumor margin was evaluated both in vivo and with computational modelling to assess potential clinical relevance of the ADC transition coefficient (ATC) as a biomarker for tumor infiltration[6].Methods
Clinical Cohort: 24 patients with suspected GBM were imaged at 3T. Conventional imaging was acquired together with 2 mm isotropic DWI. The solid tumor boundary was delineated on ADC maps informed by contrast-enhanced T1w structural imaging. In an adapted method[6], the ATC was measured at every point across the macroscopic tumor boundary over a 7mm profile where possible. The median ATC was calculated. Overall survival (OS) was the clinical endpoint. The relationship between ATC and OS was evaluated using Cox regression.Preclinical Study: G7 GBM orthotopic xenografts were implanted into 8 nude mice and T2w and DWI data were acquired at 7T[4]. Voxelwise comparison between MRI and congruent SIH maps was performed[5]: brain cryosections were stained with human leucocyte antigen (HLA) marker specific for human-derived GBM cells. Confocal HLA photomicrographs (10x) and high resolution T2w MRI were linearly co-registered and resampled to match DWI. Macroscopic tumor margin was visually delineated using the low ADC/high-T2w-signal region. Comparable to the human ATC measurement, linear profiles up to 0.7mm provided measurements of ADC and HLA/TCD across the infiltrating edge. Spearman’s rho was calculated for every profile to assess tissue and MRI correlation. For individual mice, a summary metric of infiltration was calculated from the ratio of the microscopically infiltrating ROI volume on histology to the volume of the macroscopic tumor ROI on ADC.
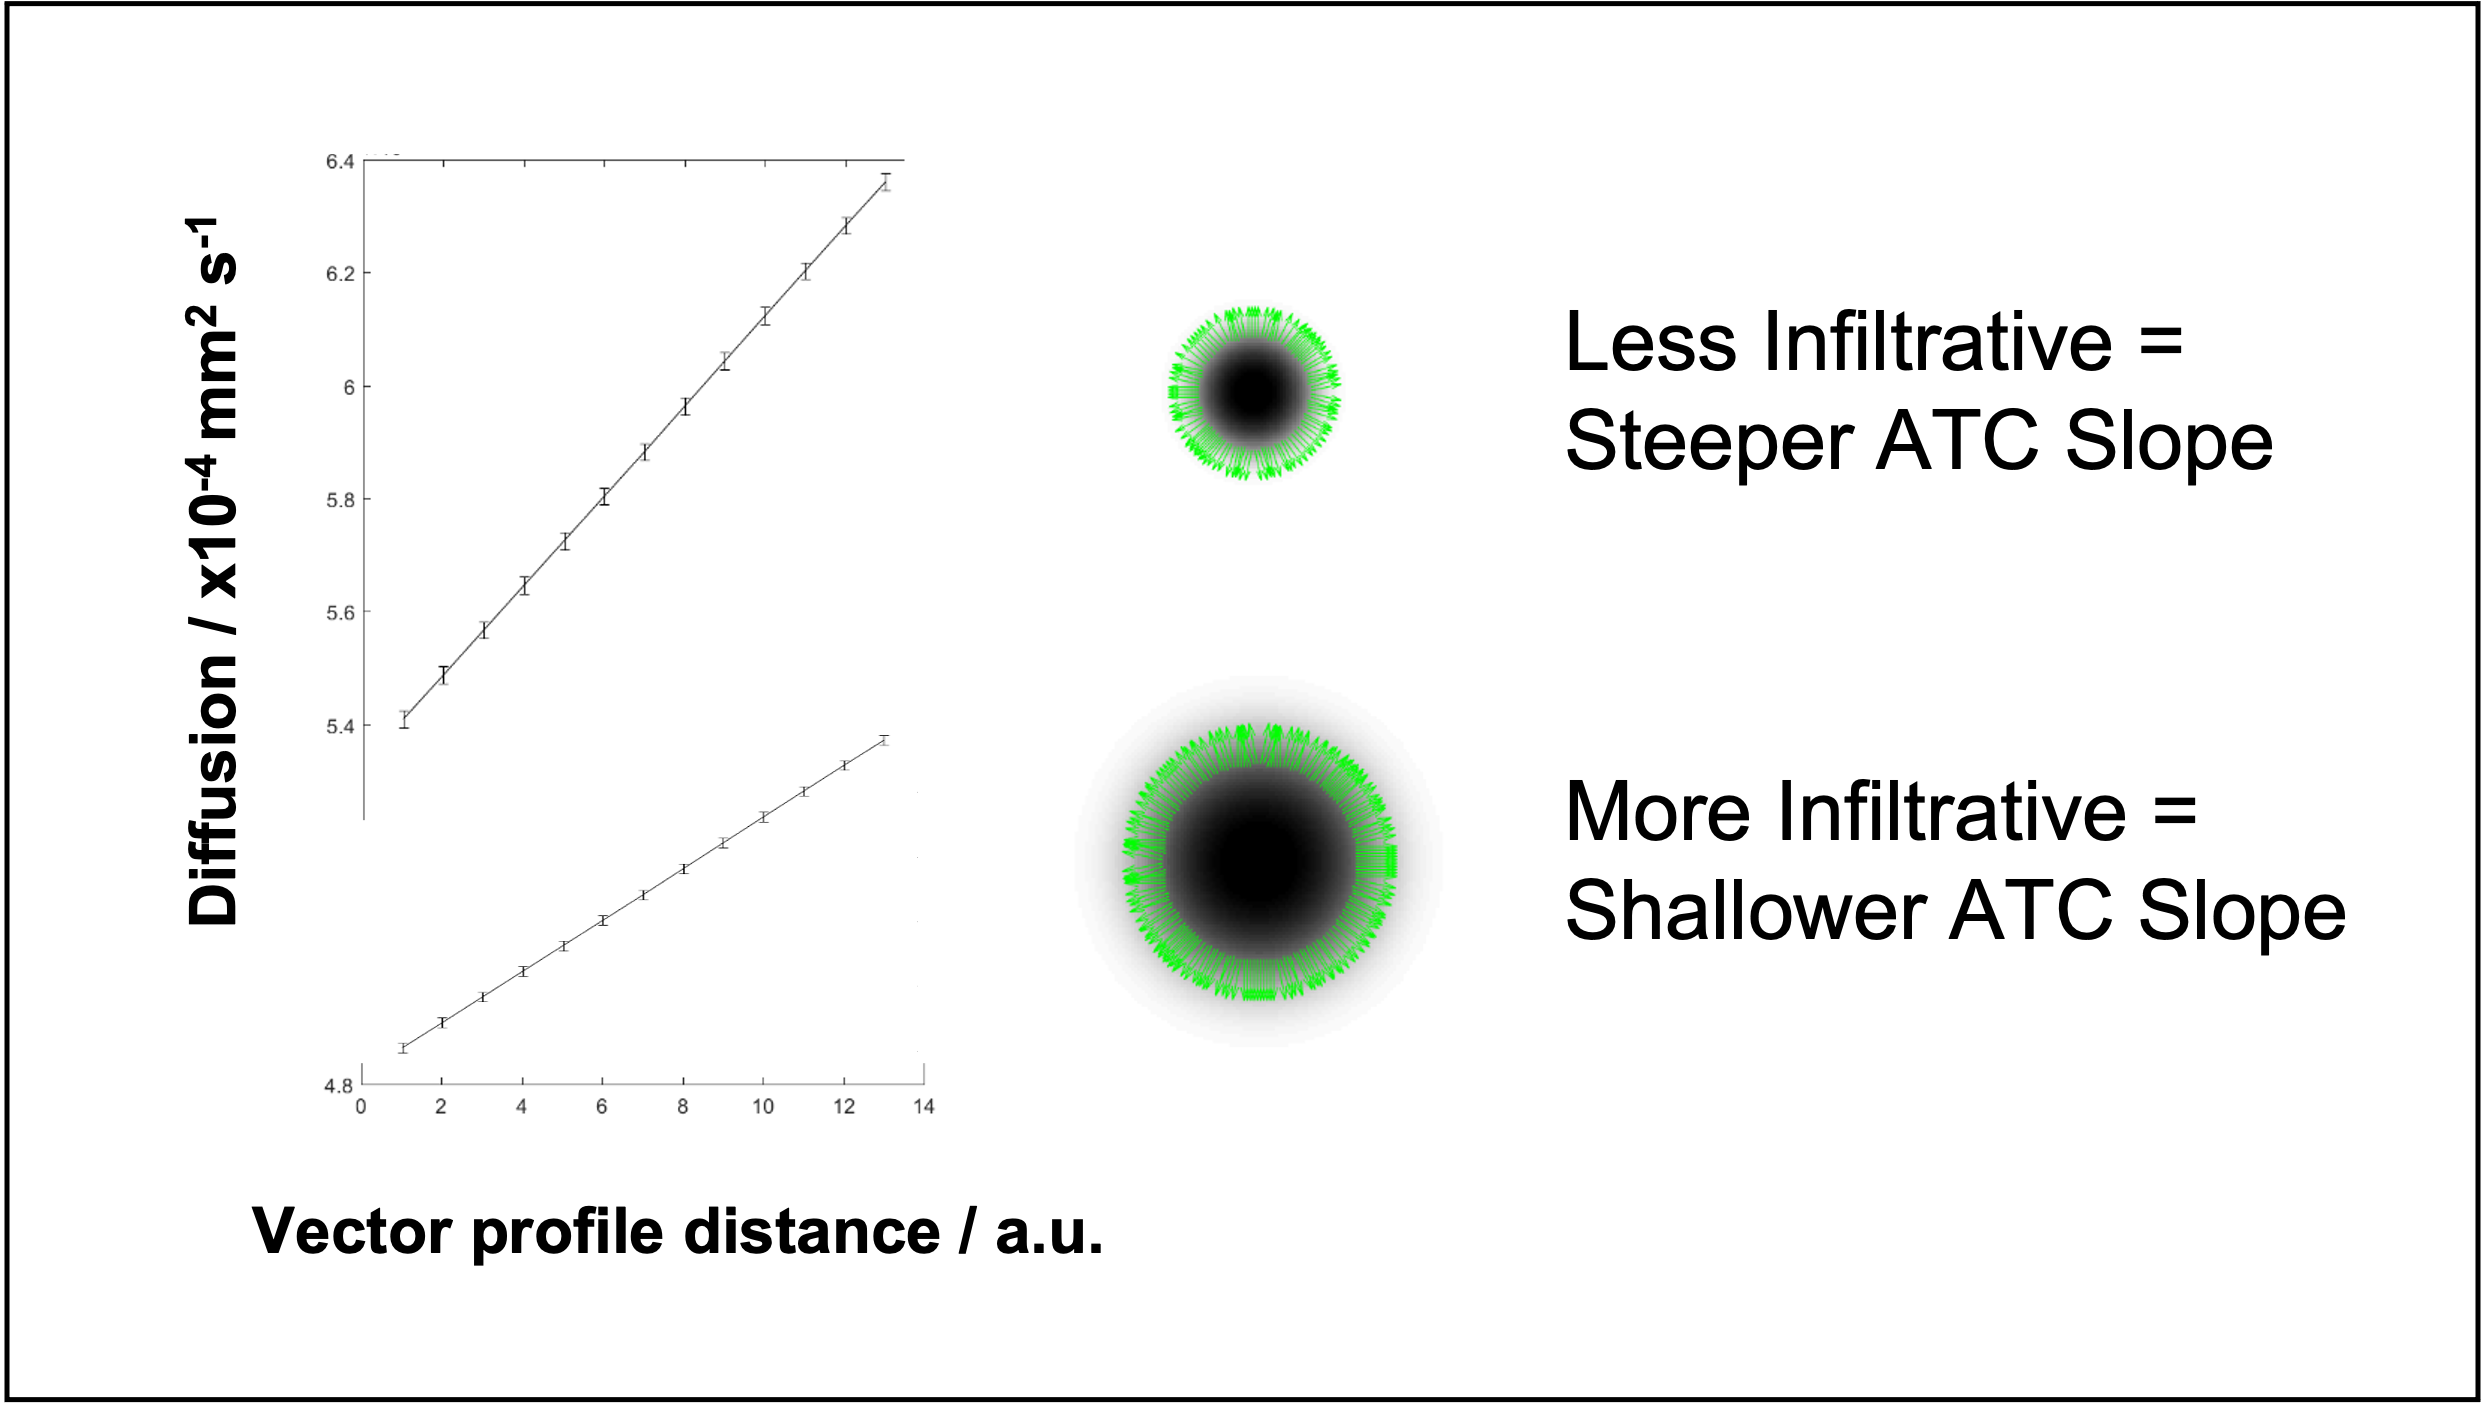
Modelling: A computational gaussian tumor cell density infiltrating front allowed production of idealised ADC maps for spherical digital phantoms based on Graham’s diffusion equation (Fig.2&3) to model the changes of cellular infiltration and ATC.
Results
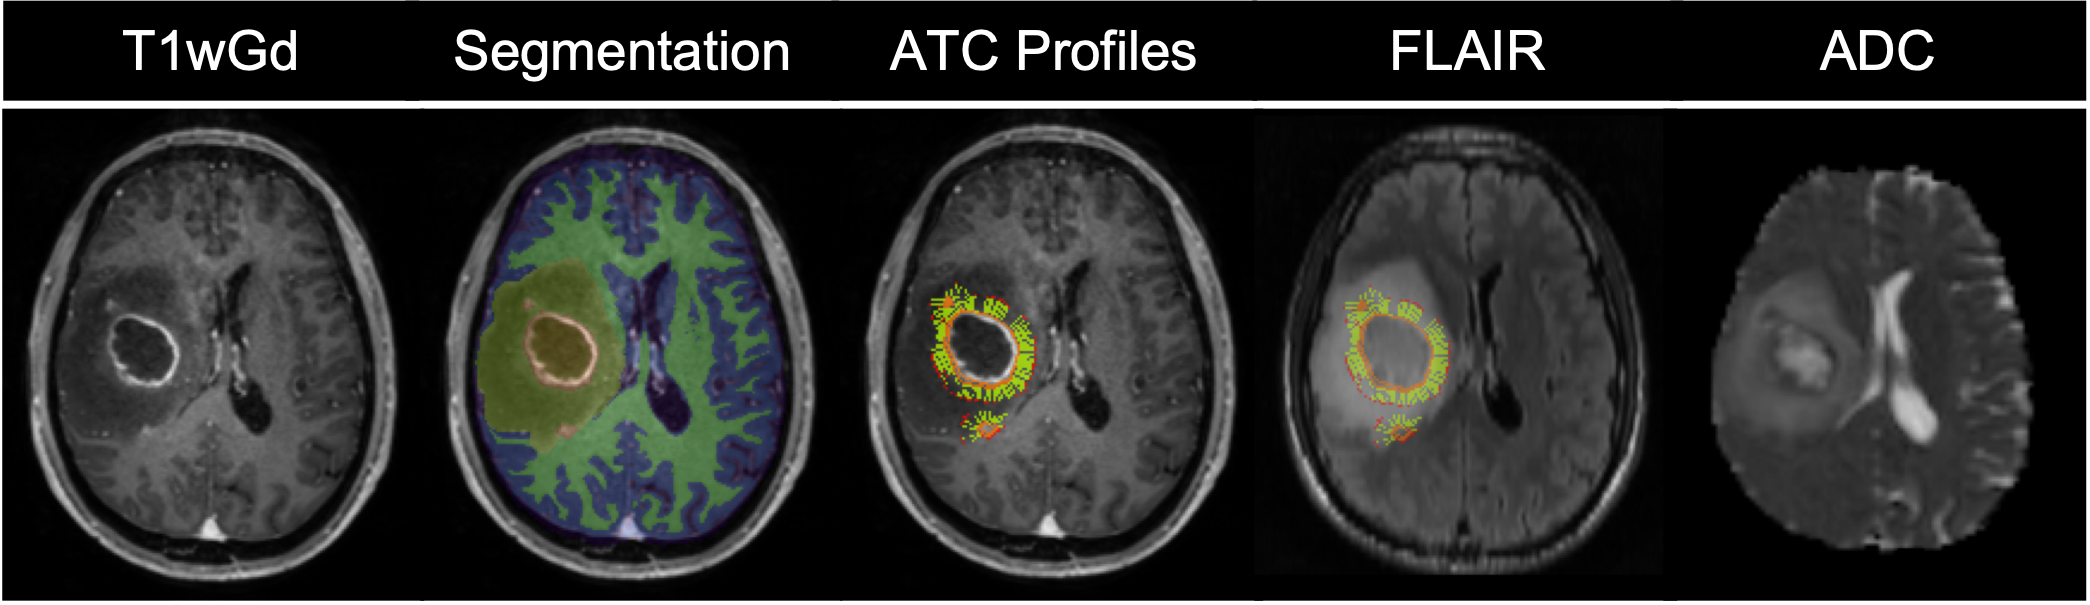
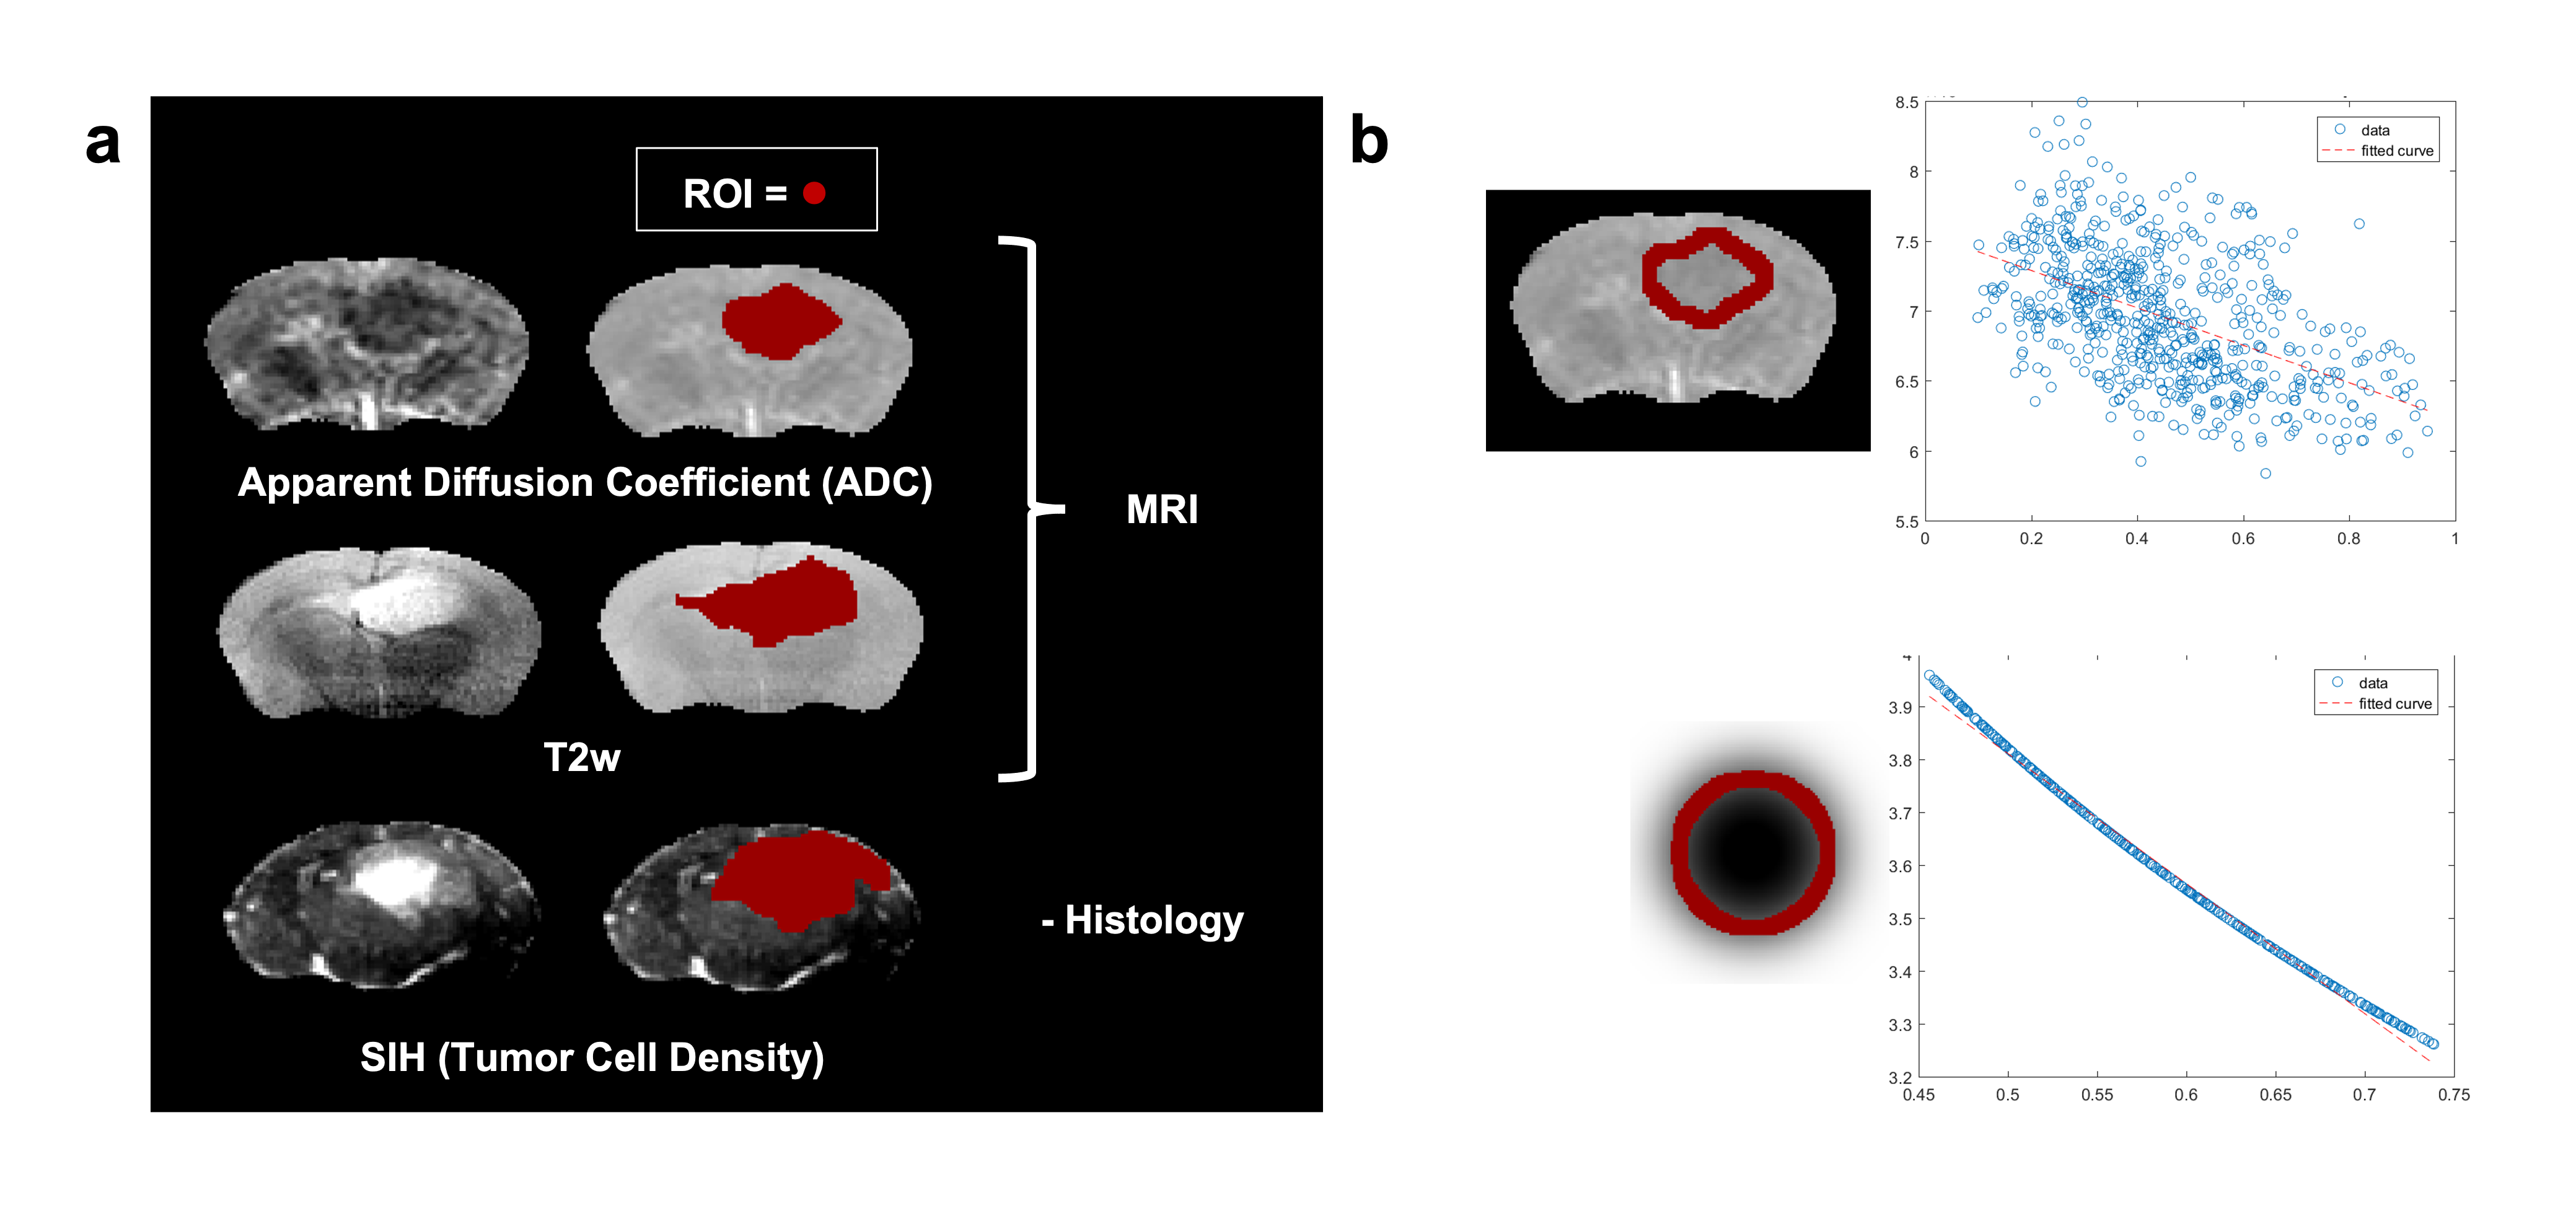
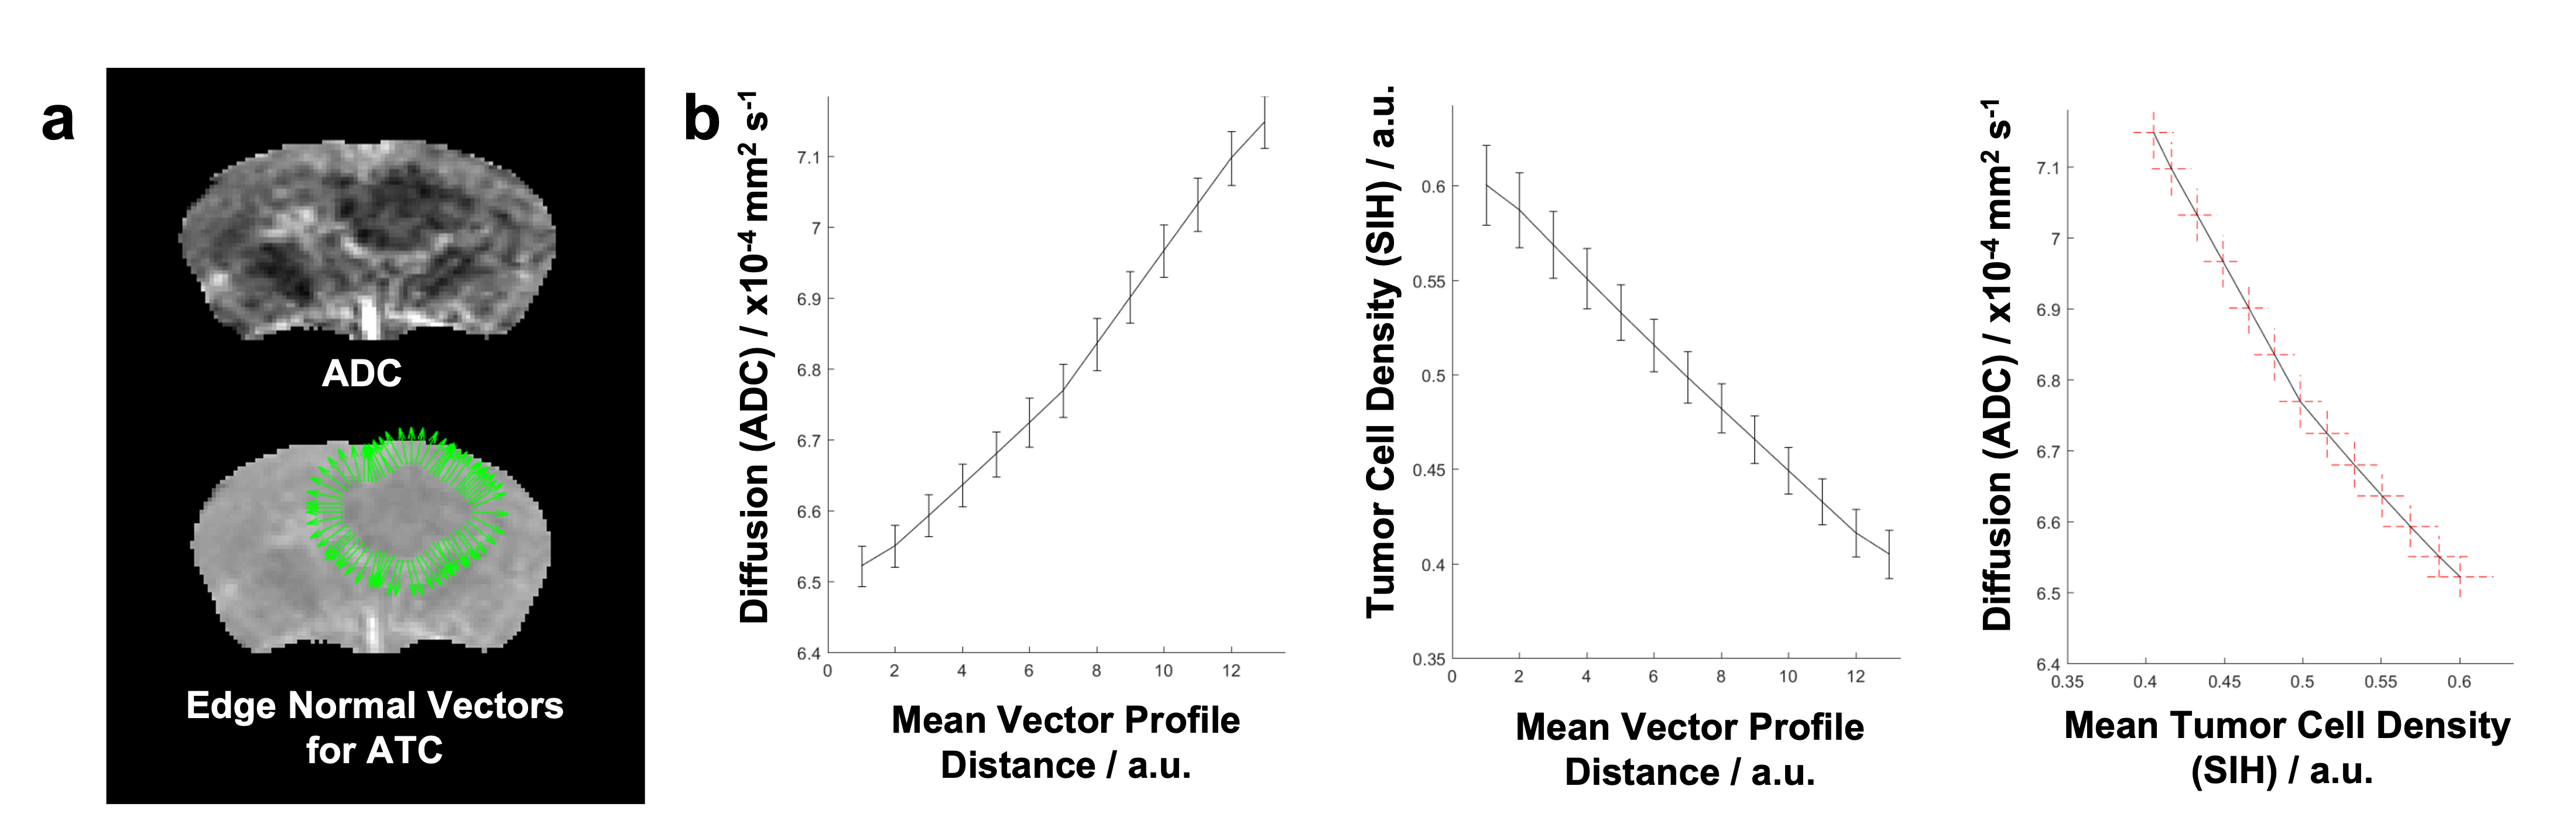
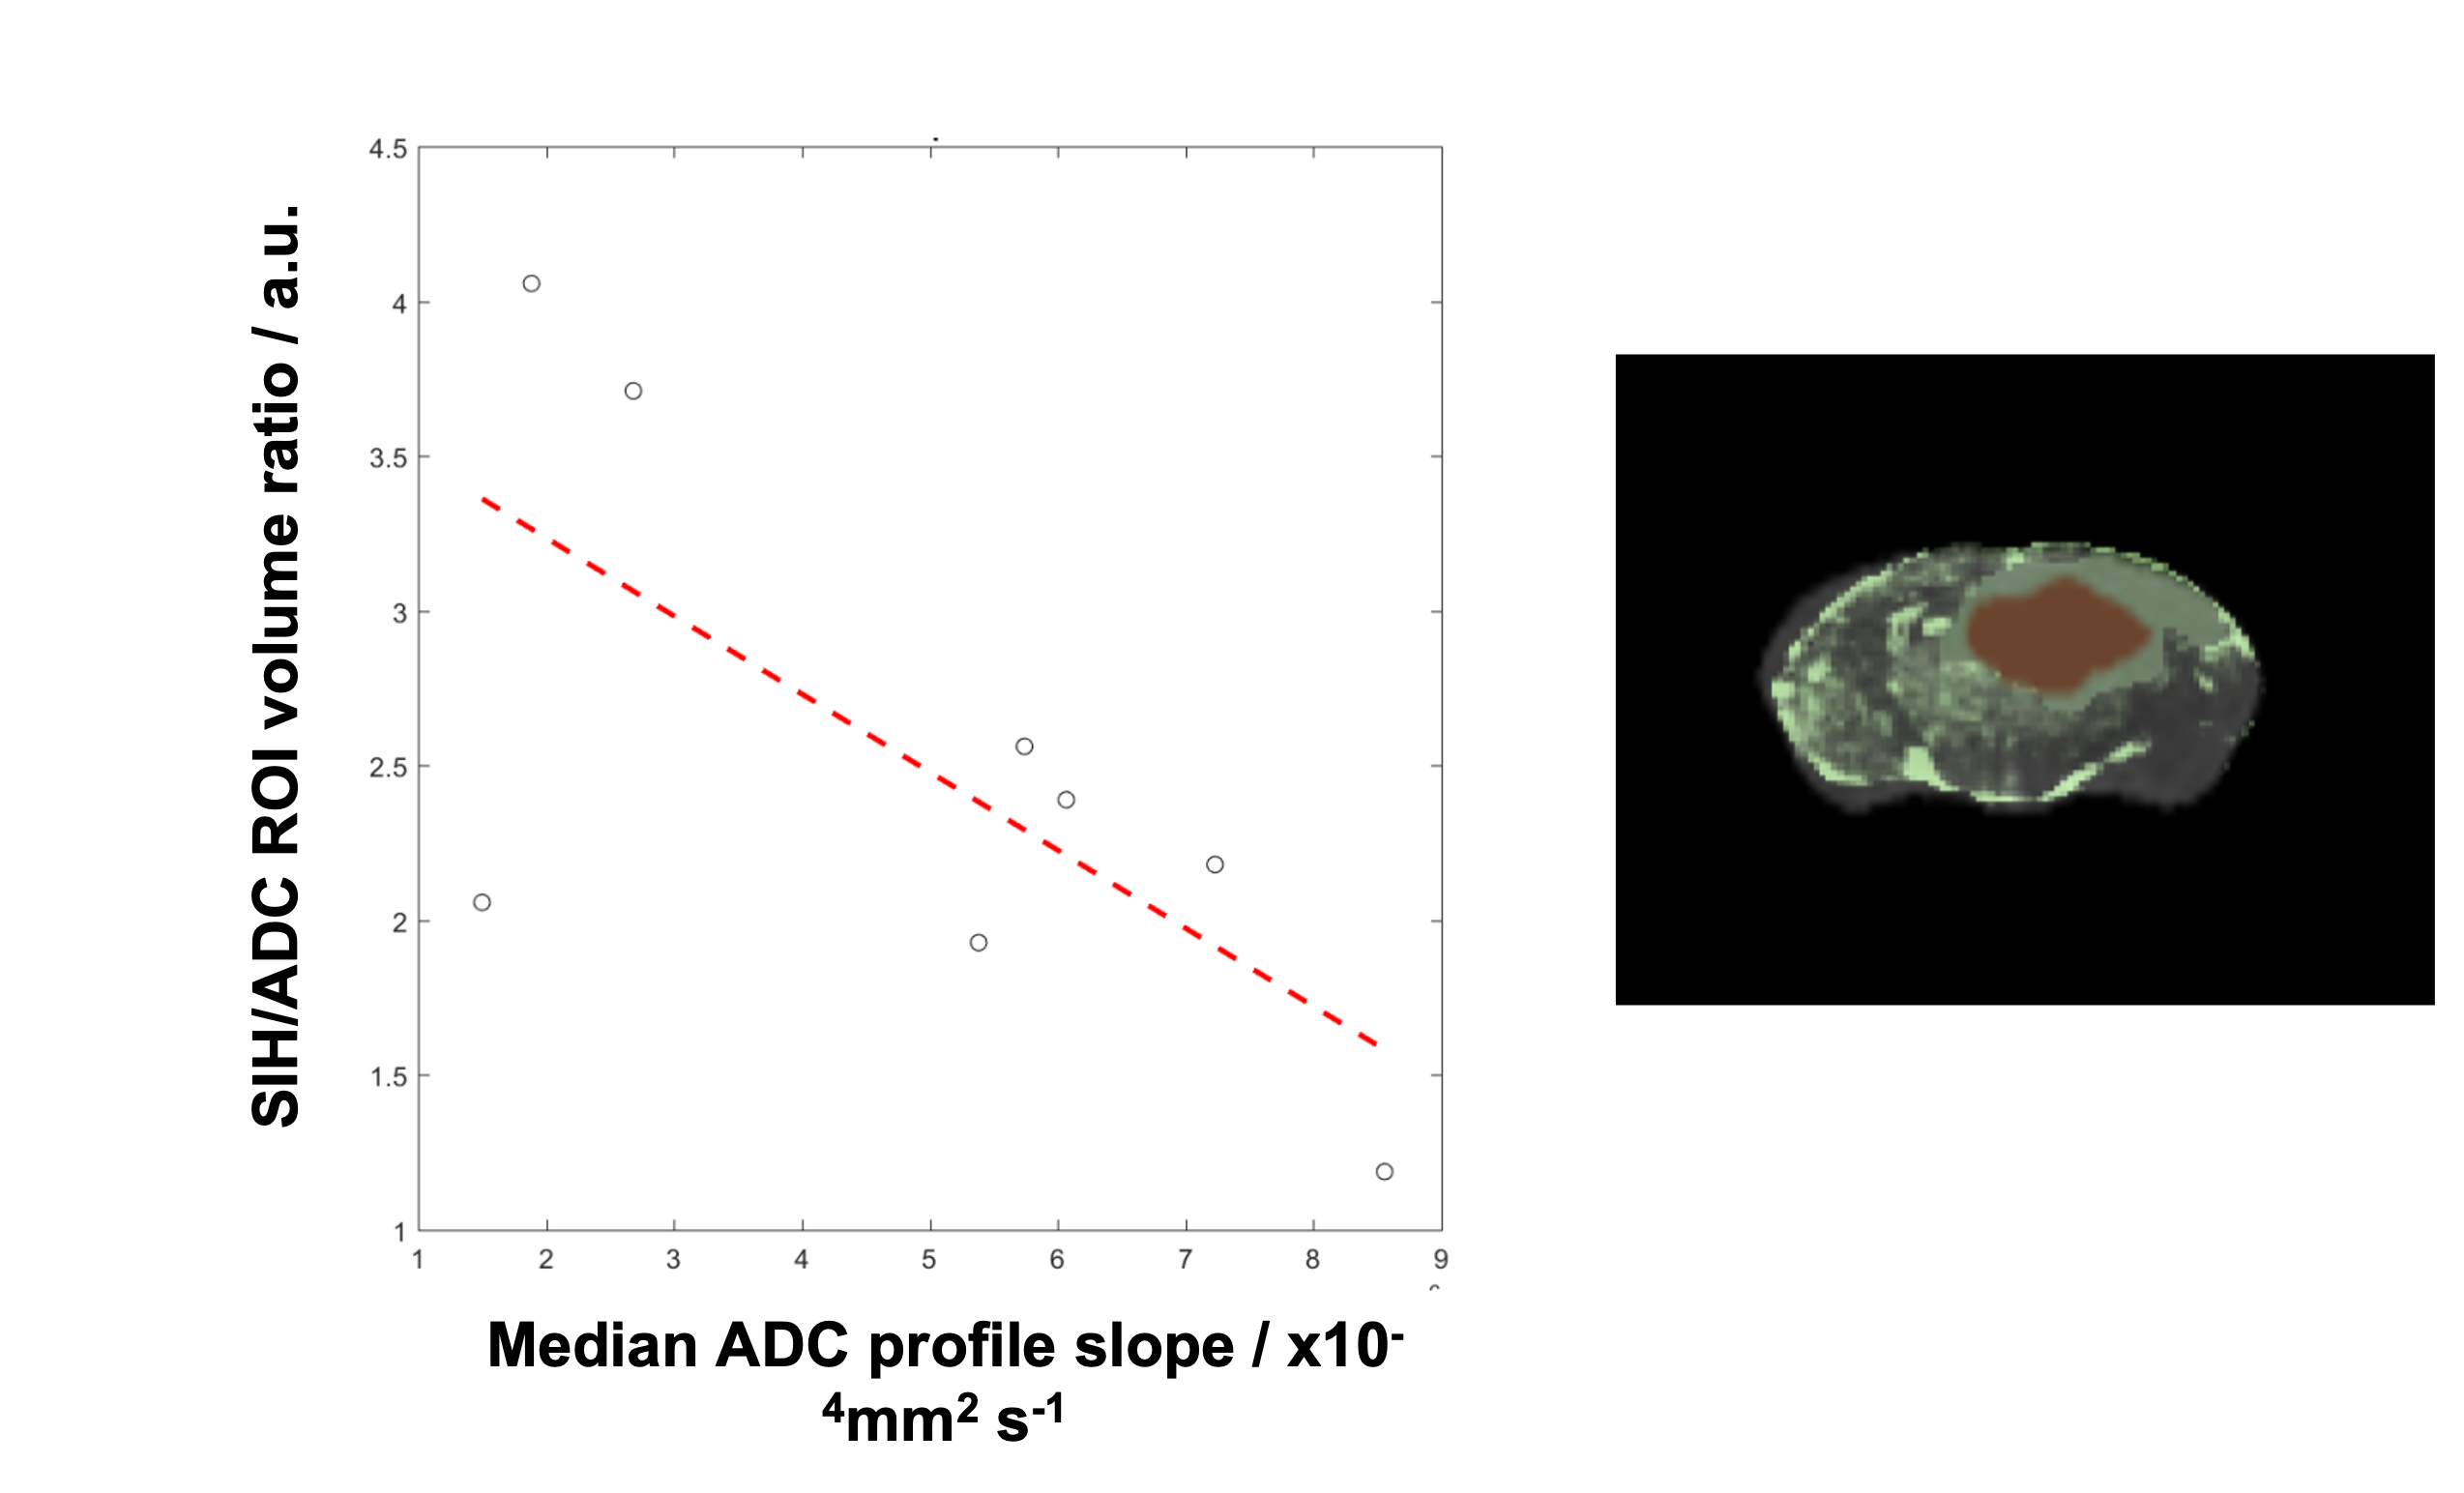
Clinical Cohort: 19 were suitable for analysis. Fig1 exemplifies ATC measurement. Univariate Cox analysis (p=0.042, exp(B)=0.985) indicates a larger ATC is significantly associated with a longer survival.Preclinical Study & Modelling: Fig2a shows examples of matched ADC, T2w, and SIH-HLA imaging. The greater extent of cellular infiltration on histology compared to MRI is seen through ROIs. Fig2b shows ADC against tumor density in the margin for the in vivo (top) and model (bottom) data, with negative correlations as predicted. Fig3 shows the model ATC measurements with more infiltrative tumor demonstrating shallower/lower ATC. Fig4 shows this in vivo in a mouse. >90% of measurable ATC profiles revealed a statistically significant negative correlation between ADC and TCD. Fig5 demonstrates the relationship between median ATC and global infiltrative phenotype in all 8 mice.
Discussion
This work complements previous clinical research relating ADC to GBM cell density in a few dozen samples of spatially limited human biopsy data, here demonstrating a robust voxelwise correlation between a specific histological marker of tumor cell infiltration and ADC in several thousand datapoints in a clinically-relevant infiltrative mouse model of GBM. Furthermore, we demonstrate that measuring the slope (ATC) of radial vectorial profiles across the macroscopic tumor boundary on ADC maps provides a robust, quantitative biomarker of GBM cell infiltration in the preclinical setting. When measured prospectively in a small clinical cohort of GBM patients receiving standard of care, the median ATC was significantly predictive of overall survival, with steeper slope values associated with longer survival as expected from the hypothesised less infiltrating phenotype and vice versa.Conclusion
Median tumor margin ATC is a clinical imaging biomarker which predicts survival in GBM. Exploring the potential mechanism underlying this biomarker would be prohibitive through biopsy alone. Translational approaches provide a complementary opportunity to explore biomarker specificity. Further work will assess ATC as a biomarker in larger clinical cohorts, and explore production of probabilistic spatiotemporal tumor infiltration maps using the local ATC tumor surface profiles, rather than the median value as a reductive static summary metric.Acknowledgements
The clinical portion of this work was funded at the University of Manchester, Salford Royal Foundation Trust, and the Christie Hospital through the Cancer Research UK Gordon Hamilton-Fairly Clinical Research Training Fellowship {C30033/A9809} with huge appreciation to Prof A Jackson, Prof G Parker, and Dr S Mills from Radiology, and all the neuro-oncology unit and MRI staff. The preclinical experiments were funded through the Edinburgh Cancer Research Centre.References
[1] Price SJ, Gillard JH, Imaging biomarkers of brain tumour margin and tumour invasion, Brit J Radiol, 84 (2011) S159-S167.[2] Chen LH, Liu M, Bao J, Xia YB, Zhang JQ, Zhang L, Huang XQ, Wang J, The Correlation between Apparent Diffusion Coefficient and Tumor Cellularity in Patients: A Meta-Analysis, Plos One, 8 (2013).
[3] Surov A, Meyer HJ, Wienke A, Correlation between apparent diffusion coefficient (ADC) and cellularity is different in several tumors: a meta-analysis, Oncotarget, 8 (2017) 59492-59499.
[4] Eidel O, Neumann J-O, Burth S, KieslichPJ, Jungk C, Sahm F, et al. (2016) Automatic Analysis of Cellularity in Glioblastoma and Correlation with ADC Using Trajectory Analysis and Automatic Nuclei Counting. PLoS ONE 11(7): e0160250. doi:10.1371/journal.pone.0160250
[5] Al-Mubarak HFI, Vallatos A, Gallagher L, Birch JL, Gilmour L, Foster J, Chalmers AJ, Holmes WM, Stacked in-plane histology for quantitative validation of imaging biomarkers: Application to an infiltrative brain tumour model, J Neurosci Methods, 326 (2019).
[6] Jenkinson MD, Smith TS, Brodbelt AR, et al. Apparent diffusion coefficients in oligodendroglial tumors characterized by genotype. J Magn Reson Imaging 2007;26:1405–12.
Figures