2650
Amide proton transfer imaging for differentiation of glioblastoma from brain metastasis1Radiology, Faculty of Medicine Siriraj hospital, Mahidol University, Bangkok, Thailand, 2Bangkok International Hospital, BDMS, Bangkok, Thailand
Synopsis
Until now, the differentiation between glioblastoma and brain metastasis still has some limitations and inconclusive findings.
This study aimed to use amide proton transfer (APT)-weighted imaging to differentiate glioblastoma from brain metastasis.
We found that by quantitative assessment, the APTw value in enhancing solid portion and peritumoral high FLAIR area of glioblastomas were significantly greater than that of brain metastases. The APTw color map also showed higher signal at the peritumoral high FLAIR area in glioblastomas than metastasis by visual assessment.
Introduction
Amide proton transfer weighted (APTw) imaging, a molecular non-gadolinium MRI technique based on chemical exchange saturation transfer (CEST) principle, is designed to detect amide protons in endogenous mobile proteins and peptides in the tissue (1) by means of protons exchange with nearby bulk water.Glioblastomas (GBM) and brain metastasis are commonly encountered in adult population. Up to now, the imaging ability to differentiate between these tumors still has some limitations and inconclusive findings.
This study aimed to use amide proton transfer APTw imaging to differentiate glioblastoma from brain metastasis.
Materials and Methods
A total of 14 patients (age range 46-76 years) including 10 patients with glioblastomas and 4 patients with brain metastases were enrolled and underwent preoperative brain 3T-MRI with APT-weighted sequence using the 3D spin-echo approach with TR/TE 6491/7.8 ms, voxel size 1.8x1.8 mm, matrix size 256x256, TSE factor of 174, EPI factor of 1, and scan time 4 mins. A pulse-train radiofrequency saturation (saturation power 2 μT, saturation time 2.0 sec.) was used. Multi-offset from 0 to ±6 was done. Each 10.03-mm ROI was placed in enhancing solid portion, peritumoral high FLAIR area, and contralateral normal appearing white matter (CNAWM). The magnetization transfer ratio asymmetry (MTRasym) and normalized magnetization transfer ratio asymmetry (nMTRasym) values; normalized by the CNAWM, were obtained, and compared for statistical analysis. Final diagnosis was validated by pathological results.Results
Qualitative visual assessment (Fig 1, Fig 2)The APTw color map showed higher signal (most of them seen as yellow color) at the peritumoral high FLAIR area in glioblastomas than metastasis (all showed green color).
All gd-enhancing solid portions, either glioblastoma or brain metastasis, had the same yellow color shading on APT color map which was difficult to differentiate them by visual assessment.
The intratumoral necrotic areas showed red color which represented more higher APT signal than that enhancing solid portions.
Quantitative assessment
The quantitative evaluation was performed in every lesion in all studies. Totally there were 19 lesions of GBM group and 11 lesions of metastasis group. The MTRasym and nMTRasym values of the enhancing solid portion of GBM and peritumoral high FLAIR area were significantly higher than that of brain metastases. (Table 1)
Discussion and Conclusion
This study showed the mean MTRasym values and the mean nMTRasym values at enhancing solid portions of glioblastomas to be significantly higher than those in brain metastases which is discordant to previous study (2).However, previous studies reported that the high-grade gliomas had higher concentration of mobile proteins and peptides than the low-grade gliomas(3, 4, 5). As previously reported(5), considering that APT MRI is a promising in vivo imaging method for quantifying the cellular proliferation of gliomas. These findings imply that the higher APTw signal intensity in the higher-grade gliomas possibly attributed to the denser cellularity in the solid components of these tumors. The other study (6) reported the mean ADC values at contrast enhancing areas of metastases to be significantly higher than those in high-grade gliomas which suggested that metastases had higher intracellular and extracellular water fractions than the latter. This also concludes that GBM may usually have higher neoplastic cell infiltration than metastases.
Our study demonstrated that mean MTRasym values and the mean nMTRasym values at peritumoral high FLAIR area of GBM were significantly higher than those in brain metastases which is concordant to previous study (4, 6).
Previous advanced MRI studies including APT imaging, diffusion, perfusion, and MR spectroscopy have shown that peritumoral high FLAIR area of metastatic brain tumors mainly reflect vasogenic edema. In the GBM, it was hypothesized that specific cells and inflammatory cells infiltrated into the perilesional zone make it reflects more than just vasogenic edema (4, 6).
For visual assessment, our study found that APTw signal of perilesional high FLAIR areas in glioblastoma usually showed high signal demonstrated as yellow color, whereas all metastatic perilesional high FLAIR areas showed green color inseparable from normal white matter background on APT color map. There might be concluded that APT color map is capable to differentiate these two tumors.
Interestingly, APTw signal in intratumoral necrotic cystic areas showed significantly high and higher APTw value than enhancing portions. As previously reported (3, 7, 8, 9), this was based on the hypothesis that APT imaging detects endogenous mobile proteins and peptides in tissue such as those in the cytoplasm, therefore the liquid-like cystic portion of the tumor which contains many mobile proteins as expected shows the high APT signal.
In conclusion, APTw MR imaging could be used to distinguish glioblastomas from brain metastases by evaluating the enhancing solid portions and peritumoral high FLAIR areas. Moreover, the technique could be performed repeatedly for long term follow up with no concern of gadolinium deposition in the organ, especially in brain.
Acknowledgements
We gratefully acknowledge Ms. Dollaporn Polyeam for assistance with statistical analysis.References
1.Zhou J, Lal B, Wilson DA, Laterra J, van Zijl PC. Amide proton transfer (APT) contrast for imaging of brain tumors. Magn Reson Med. 2003;50(6):1120-6.2.Yu H, Lou H, Zou T, Wang X, Jiang S, Huang Z, et al. Applying protein-based amide proton transfer MR imaging to distinguish solitary brain metastases from glioblastoma. European Radiology. 2017;27(11):4516-24.
3.Zhou J, Zhu H, Lim M, Blair L, Quinones-Hinojosa A, Messina SA, et al. Three-dimensional amide proton transfer MR imaging of gliomas: Initial experience and comparison with gadolinium enhancement. J Magn Reson Imaging. 2013;38(5):1119-28.
4.M L, S C, EA K, G J, J A, AW L. High-Grade Gliomas and Solitary Metastases: Differentiation by Using Perfusion and Proton Spectroscopic MR Imaging. Radiology. 2002;2002;222(3):715-21.
5.Park JE, Kim HS, Park KJ, Kim SJ, Kim JH, Smith SA. Pre- and Posttreatment Glioma: Comparison of Amide Proton Transfer Imaging with MR Spectroscopy for Biomarkers of Tumor Proliferation. Radiology. 2016;278(2):514-23.
6.Chiang IC, Kuo Y-T, Lu C-Y, Yeung K-W, Lin W-C, Sheu F-O, et al. Distinction between high-grade gliomas and solitary metastases using peritumoral 3-T magnetic resonance spectroscopy, diffusion, and perfusion imagings. Neuroradiology. 2004;46(8):619-27.
7.Ma B, Blakeley JO, Hong X, Zhang H, Jiang S, Blair L, et al. Applying amide proton transfer-weighted MRI to distinguish pseudoprogression from true progression in malignant gliomas. J Magn Reson Imaging. 2016;44(2):456-62.
8.Suh CH, Park JE, Jung SC, Choi CG, Kim SJ, Kim HS. Amide proton transfer-weighted MRI in distinguishing high- and low-grade gliomas: a systematic review and meta-analysis. Neuroradiology. 2019;61(5):525-34.
9.Zhou J, Heo HY, Knutsson L, van Zijl PCM, Jiang S. APT-weighted MRI: Techniques, current neuro applications, and challenging issues. J Magn Reson Imaging. 2019;50(2):347-64.
Figures
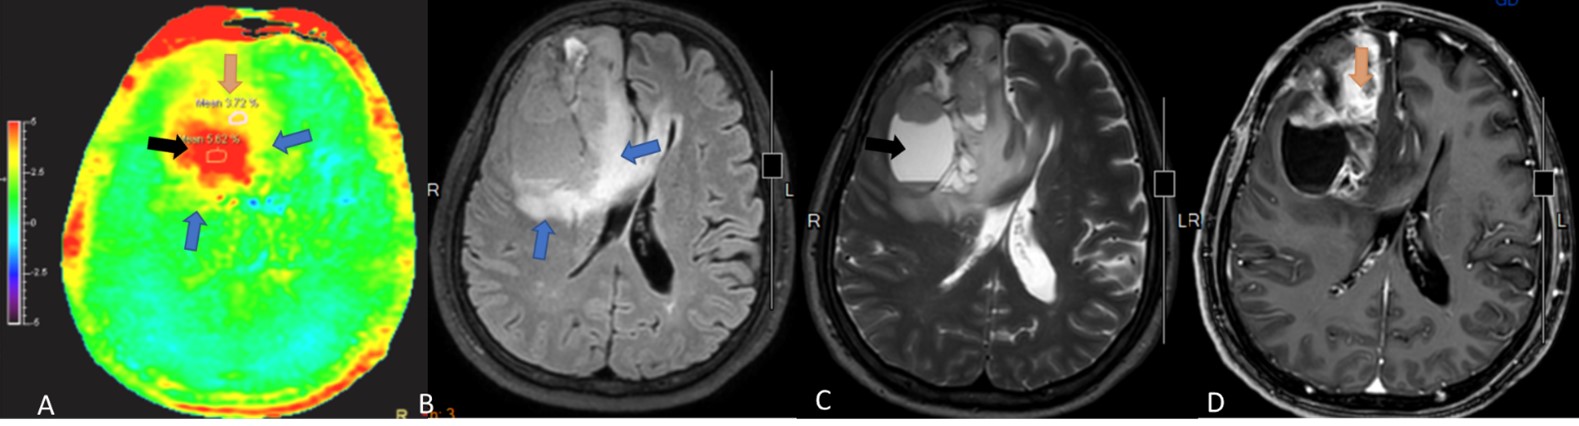
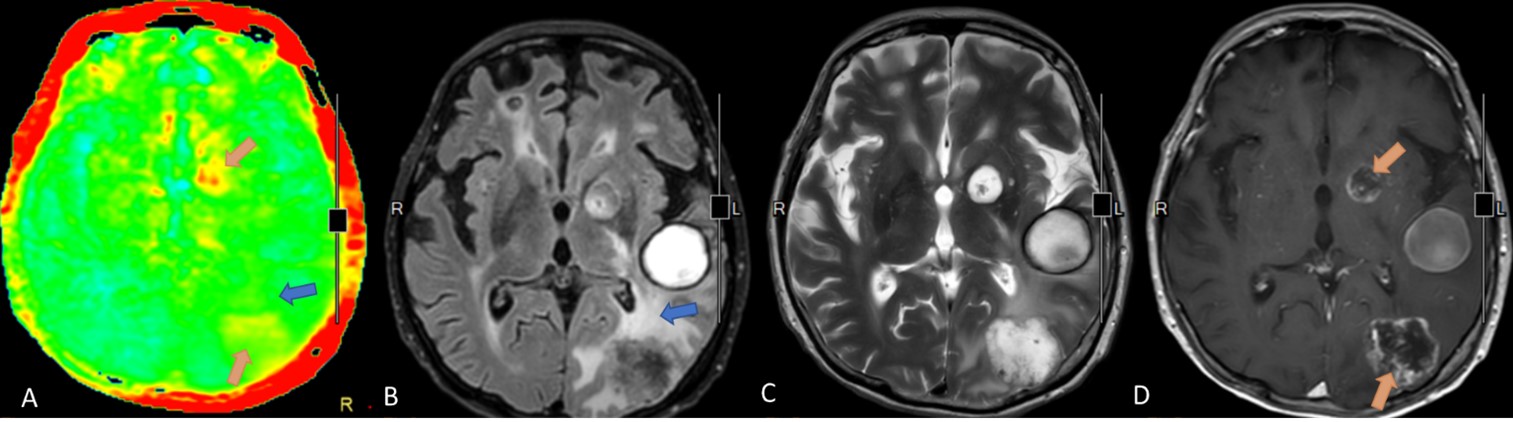
Figure2 APT-weighted and conventional MR images of a 68-year-old female with 2 rim-enhancing metastatic breast cancer lesions at left occipital and left basal ganglia. APT color map (A) showed yellow color corresponding with enhancing component of these 2 lesions on Gd-enhanced T1W-image (D) (orange arrow). The perilesional hyperintense on FLAIR (B) and T2W (C) at left temporo-occipital region show green color on APT color map (A) (blue arrow) which indistinguishable from the normal brain background.
