2647
Assessment of Brain Activity during a Lower Extremity Sensorimotor Task using CEST MRI at 3T
Rongwen Tain1,2, Benjamin M. Ellingson3,4, Craig Stark1,2,5, Catalina Raymond Guzman3,4, Kelli Sharp6,7, and Joanne Armour Smith8
1Campus Center for Neuroimaging, University of California, Irvine, CA, United States, 2Facility for Imaging and Brain Research, University of California, Irvine, CA, United States, 3Brain Tumor Imaging Laboratory, University of California, Los Angeles, CA, United States, 4Department of Radiology and Psychiatry, University of California, Los Angeles, CA, United States, 5Department of Neurobiology and Behavior, University of California, Irvine, CA, United States, 6Department of Physical Medicine and Rehabilitation, University of California, Irvine, CA, United States, 7Department of Dance, University of California, Irvine, CA, United States, 8Department of Physical Therapy, Chapman University, Orange, CA, United States
1Campus Center for Neuroimaging, University of California, Irvine, CA, United States, 2Facility for Imaging and Brain Research, University of California, Irvine, CA, United States, 3Brain Tumor Imaging Laboratory, University of California, Los Angeles, CA, United States, 4Department of Radiology and Psychiatry, University of California, Los Angeles, CA, United States, 5Department of Neurobiology and Behavior, University of California, Irvine, CA, United States, 6Department of Physical Medicine and Rehabilitation, University of California, Irvine, CA, United States, 7Department of Dance, University of California, Irvine, CA, United States, 8Department of Physical Therapy, Chapman University, Orange, CA, United States
Synopsis
A recent animal study demonstrates that CEST MRI is a potential tool to detect neuronal activation. In this work, we study CEST effects in the secondary somatosensory cortex during rest and during a goal-directed lower extremity sensorimotor task (small amplitude left leg lifting) in 10 healthy participants. Significantly higher CEST effects were observed in participants performing the leg task in the secondary somatosensory cortex, but not in a prefrontal cortex control region. This indicates that CEST MRI is a potential tool to detect brain metabolism associated with neuronal activity in human subjects at 3T.
Introduction
Functional MRI studies have shown activation of secondary somatosensory areas during motor tasks, but the precise role of these areas in motor function in humans is still unclear.1 It is important to gain a better understanding of this role, as dysfunction of somatosensory processing during motor tasks is evident in individuals with a wide variety of motor control disorders.2 However, functional MRI is an indirect and delayed measure of brain activity. Recently CEST MRI has been proposed to image real-time metabolic changes associated with neuronal activation.3 This study therefore aims to explore an alternative metabolic imaging approach based on CEST MRI to assess metabolic changes in a somatosensory area induced by neuronal activation.Methods
Imaging was performed using a Siemens Prisma 3T MRI system on 10 healthy volunteers (21±2 yrs, 2 male, 7 female, 1 unspecified) with informed consent. T1-MPRAGE and CEST MRI (32 off-resonance frequencies between ±5 ppm and -100 ppm) parameters were based on recent publications.4 During CEST MRI data acquisition, half of the participants performed repetitive small-amplitude straight leg lifts (SLL) with the left leg for about 7.5 min. This task involves slowly lifting the left leg a short distance to touch a horizontal target in response to a visual cue before lowering the leg again. In the other participants CEST MRI was acquired during rest. In order to compensate for B0 field inhomogeneity, the CEST data with ± 1.5 ppm was interpolated to obtain a B0 map. Asymmetric CEST contrast at 3 ppm was derived using the equation: CEST(%) = 100*(Sneg -Spos) /S0. CEST spectra as well as the mean and standard deviation of CEST contrast were derived from 4 ROIs including the areas of the right and left secondary somatosensory cortex and prefrontal cortex for comparison. A Student’s t-test was used to assess difference in CEST measurements (p<0.05).Results and Discussion
All the participants completed the testing without difficulty. Examples of a CEST contrast map from participants at rest and during the sensorimotor task are shown in Fig. 1. In general, CEST contrast in gray matter was higher than that in white matter, consistent with previous publications. 4 There was observable higher CEST contrast in the secondary somatosensory cortex in participants performing the sensorimotor task (Fig. 1 arrows). In the task group, there was significantly higher CEST contrast in the right-somatosensory cortex than the right-prefrontal cortex (p<0.05) (Fig. 2). Interestingly, there was no significant difference in CEST contrast between left-sensory and left-prefrontal cortex (p=0.09). The CEST contrast in both left- and right- secondary somatosensory cortices in the task group was also significantly higher than that of the resting group (p<0.05). No significant differences in the prefrontal ROIs were observed between the two groups. In the resting state, the CEST spectra were similar in all 4 ROIs (Fig.3 left) as expected. In contrast, the spectra from the task group (Fig. 3 right) showed higher magnetization transfer ratio (MTR) in the downfield of water (positive ppm frequency). These findings are consistent with the characteristics of the task that involves unilateral limb motion but requires bilateral limb/trunk sensorimotor control.5 The location of the changes detected in the somatosensory cortices are also consistent with brain activation quantified with fMRI during the sensorimotor task (unpublished data). There were also observable changes in water linewidth in the prefrontal cortex. Several factors including changes in pH and chemical exchange rate may contribute the changes in water linewidth. Those changes could be potentially involved in neuronal activation.Conclusion
In this work, we present our initial evidence of detection of brain activity using CEST MRI at 3T. During a goal-directed leg lifting task, CEST effects in the somatosensory cortex were observed. The results of this study suggest that CEST MRI can be a tool to evaluate task-related brain metabolism in humans.Acknowledgements
This study was supported by NICHD grant K01HD092612.References
- Eickhoff S, Amunts K, Mohlberg H, et al. The human parietal operculum. II. Stereotaxic maps and correlation with functional imaging results. Cereb Cortex. 2006;16(2):268-79.
- Meier ML, Vrana A, Schweinhardt P. Low Back Pain: The Potential Contribution of Supraspinal Motor Control and Proprioception. Neuroscientist. 2019 Dec; 25(6): 583–596.
- Roussel T, Frydman L, Bihan DL, et al. Brain sugar consumption during neuronal activation detected by CEST functional MRI at ultra-high magnetic fields. Sci Rep 9, 4423
- Harris RJ, Yao J, Chakhoyan A, et al. Simultaneous pH-sensitive and oxygen-sensitive MRI of human gliomas at 3 T using multi-echo amine proton chemical exchange saturation transfer spin-and-gradient echo echo-planar imaging (CEST-SAGE-EPI). Magn Reson Med. (5):1962-1978
- Smith JA, Konig Ignasiak N, Jacobs JV. Task-invariance and reliability of anticipatory postural adjustments in healthy young adults. Gait Posture. 2020; 76: 396-402.
Figures
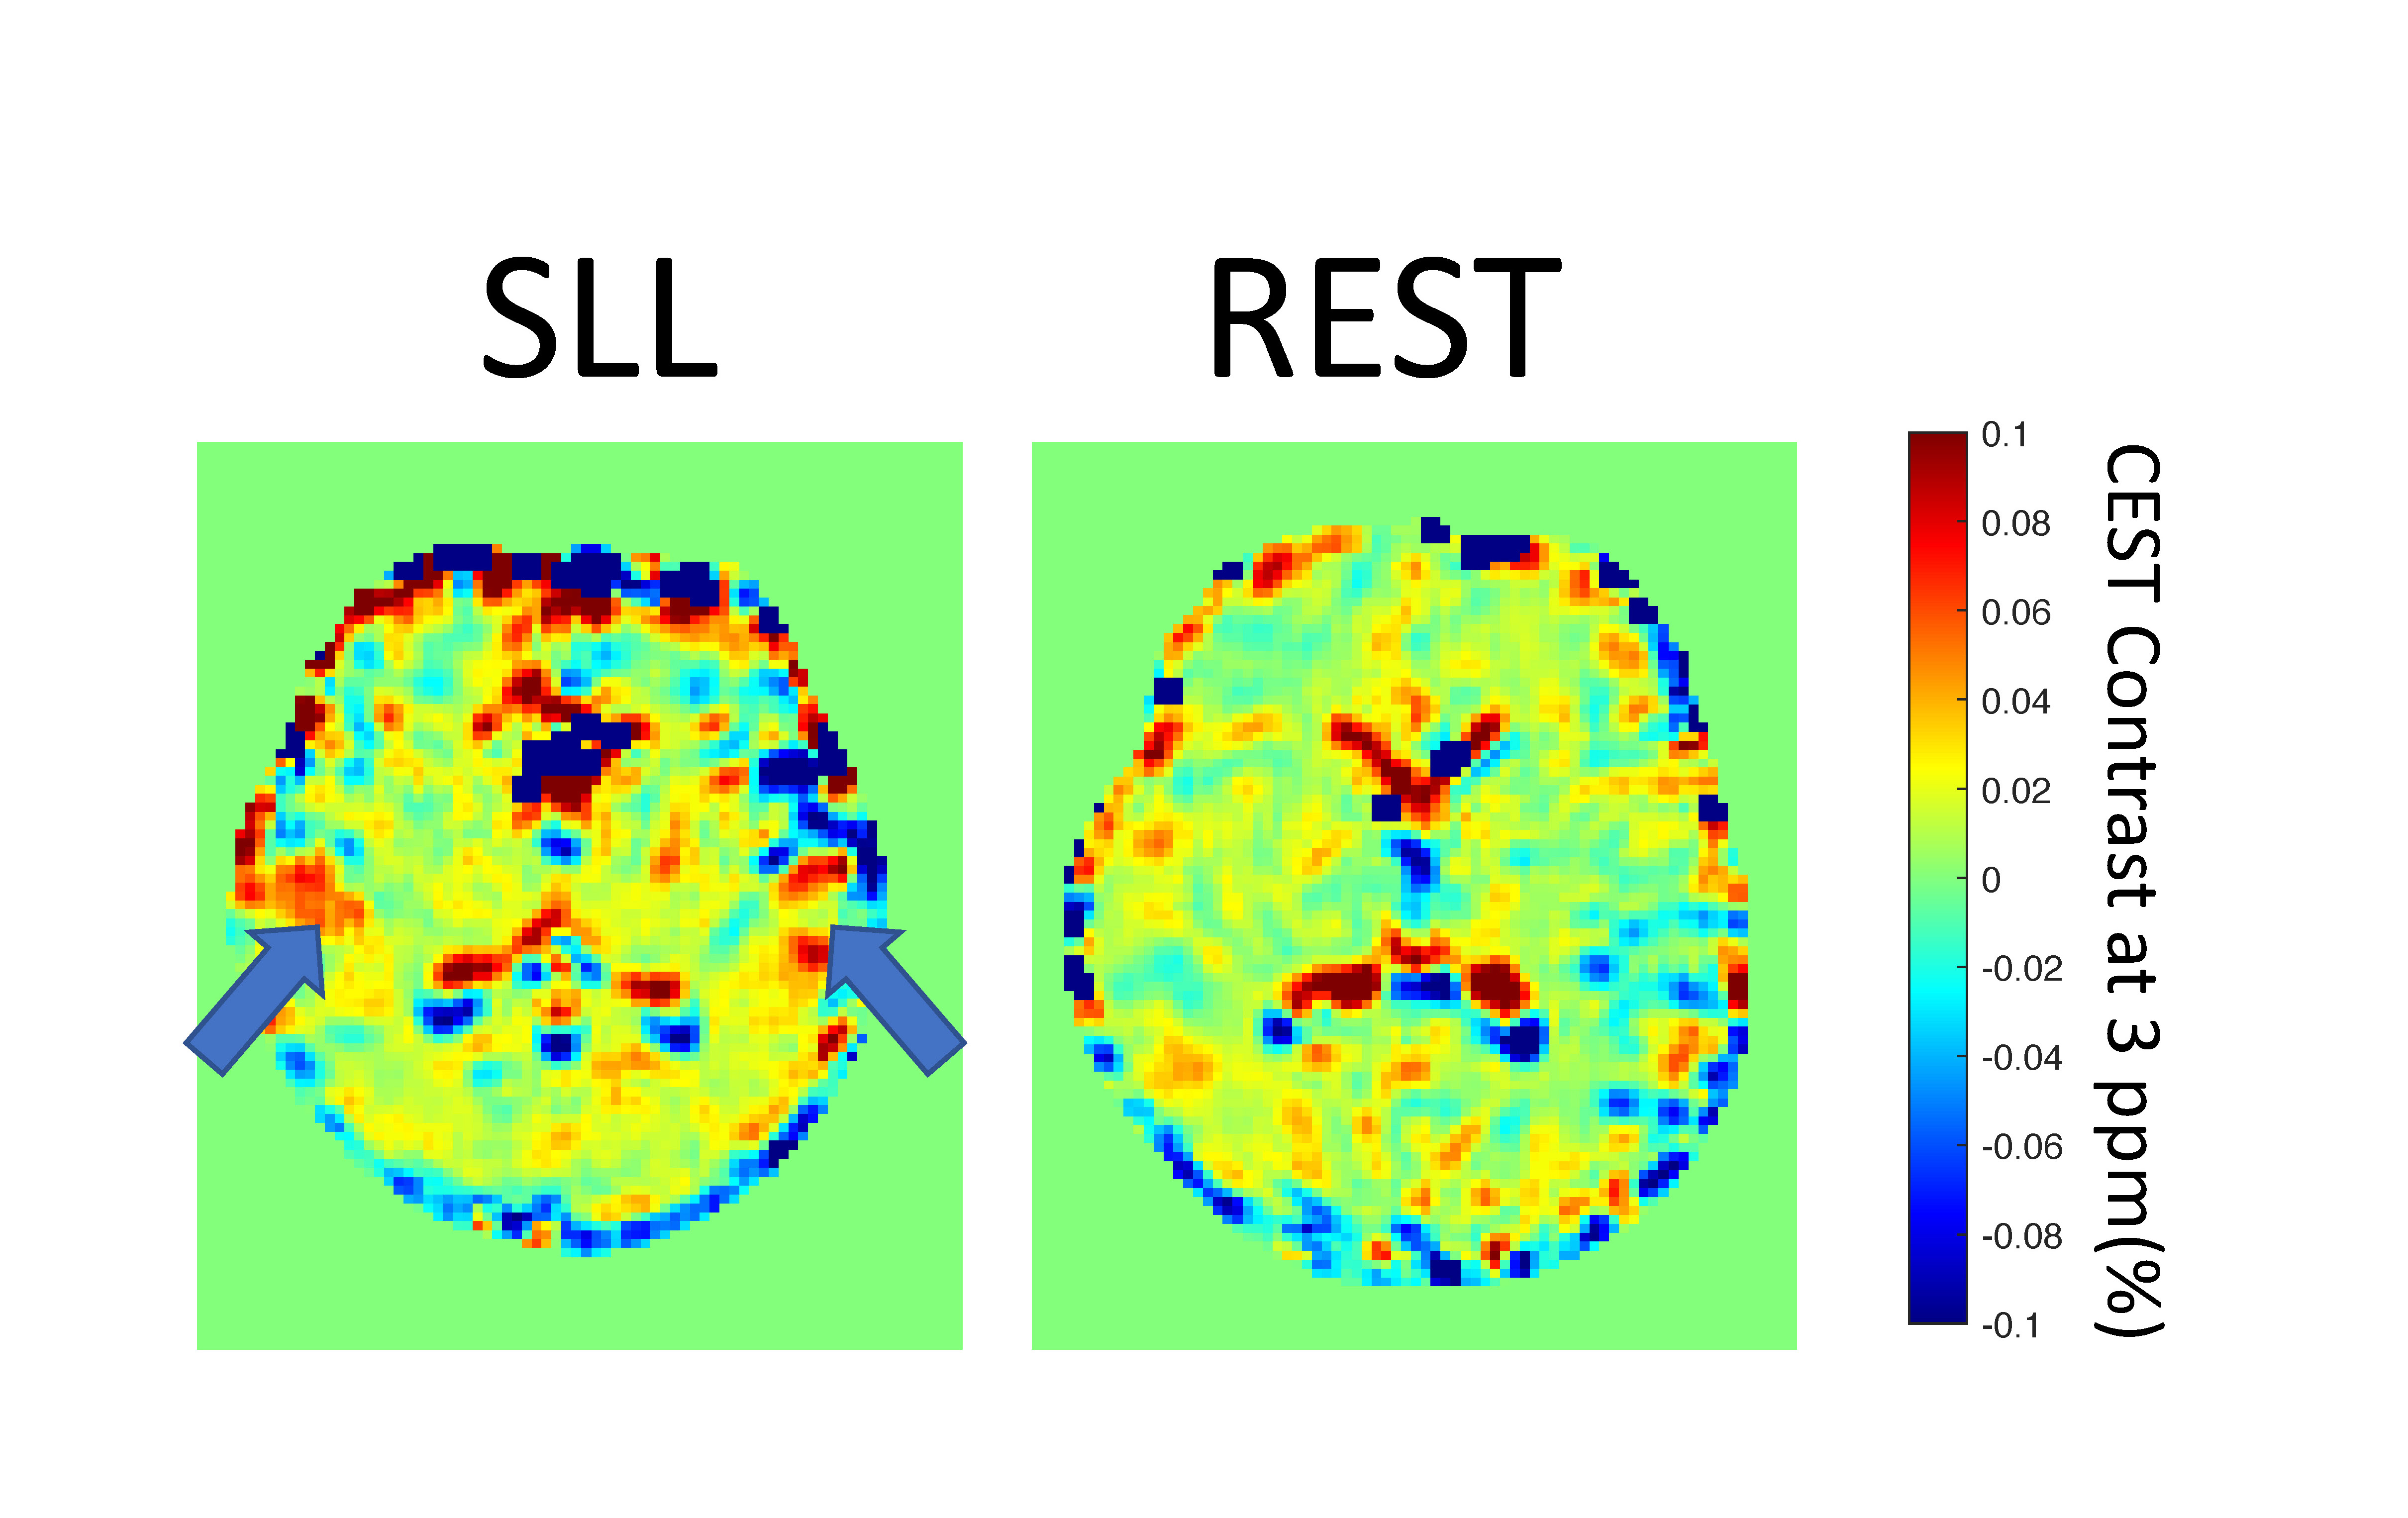
Figure 1. Example of CEST contrast map at 3ppm from subjects performing the straight leg lift (SLL) task (Left) and at rest (Right).
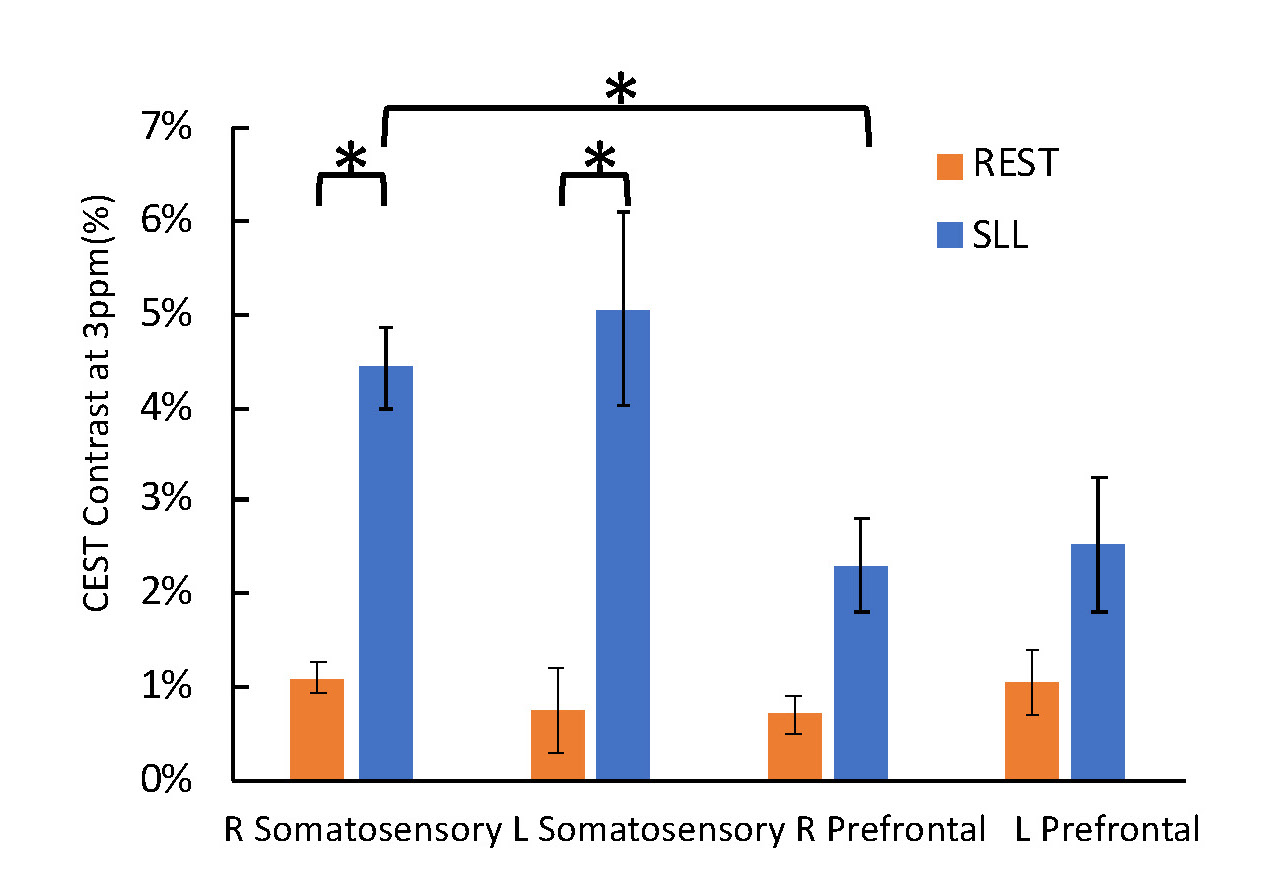
Figure 2. CEST contrast (mean±sd) of left and right secondary somatosensory and prefrontal cortex. (* p<0.05)
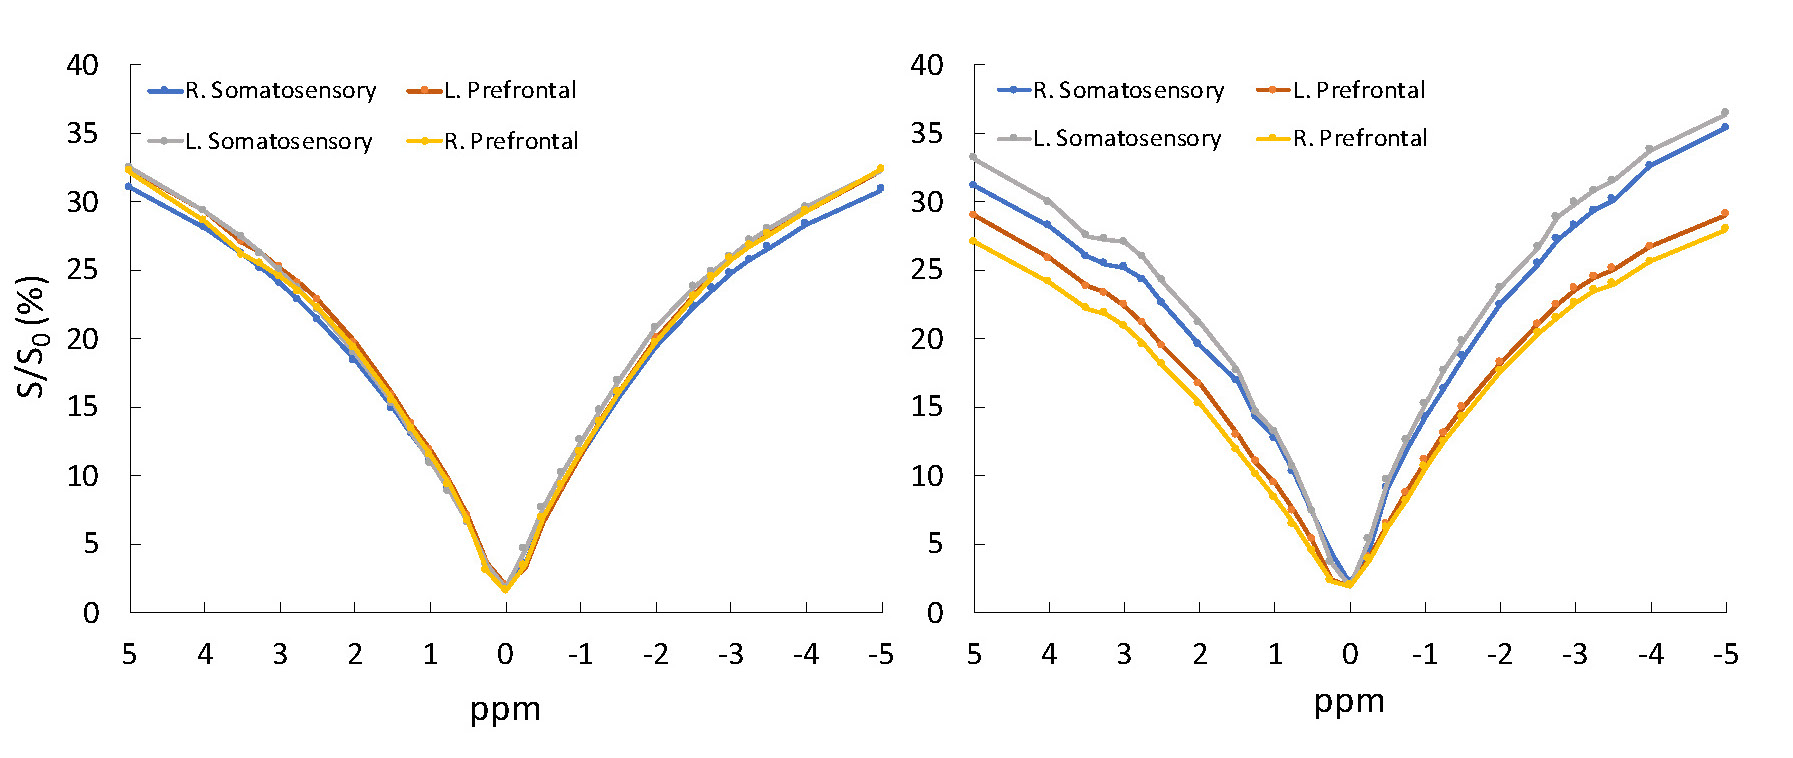
Figure 3. CEST spectra of left and right secondary somatosensory and prefrontal cortex at rest (Left) and during the straight leg lift task (Right).
DOI: https://doi.org/10.58530/2022/2647