2645
A clinical protocol for 3D imaging of the locus coeruleus with super-resolution at 3 Tesla1Invicro LLC, A Konica Minolta Company, London, United Kingdom, 2GE Healthcare, London, United Kingdom, 3Invicro LLC, A Konica Minolta Company, Needham, MA, United States
Synopsis
The locus coeruleus (LC) is the principal source of noradrenaline production in humans. Histology studies have shown that severe loss of neurons in the LC is associated with many neurodegenerative disorders. Damage is thought to be non-uniform and occurring in stages, hence there is a growing interest in imaging the LC in vivo in these patient populations. In this work we propose a protocol for imaging the LC at clinical field strengths using a 3D magnetization-transfer prepared imaging sequence strategy and the application of super-resolution techniques to increase the LC features within the brainstem region.
Introduction
The neuroimaging field has shown increasing interest in the locus coeruleus (LC), a small neuromelanin (NM) rich nucleus located in the pons region of the brainstem. Literature has shown that the LC neurons degenerate in many neurological disorders1-6.MRI has been used for non-invasive in vivo imaging of the LC, more recently with magnetization transfer (MT)7-10. However, because of the small nature of the structure (rod-like, ~16mm in extent, <100mm3 volume11) contrast-to-noise ratio (CNR) measurements are generally highly variable (~2.5-8.77,12,13).
2D multi-slice sequences are commonly preferred at clinical field strengths (up to 3 Tesla) because it is possible to achieve submillimeter in-plane resolutions with high sensitivity. Yet, these are acquired with relatively thick slices (2-5mm) and are generally more time-consuming compared to volumetric 3D acquisitions. Therefore, in this work we propose a high-resolution clinical protocol for LC imaging at 3T, implemented with a 3D fast spoiled gradient-echo (FSPGR) sequence.
Super resolution (SR) methods have been used in several clinical MRI applications14-16, in order to produce high resolution images from ordinary resolution (OR) data. Here we also show the potential of a super-resolution approach based on a deep back projection networks (DBPN)17 applied to the acquired low-resolution data.
Materials and Methods
Three healthy controls (age: 49±8; 2 males) underwent a 3T brain MRI (Signa PET-MR, GE Healthcare) equipped with a 32-channel coil (Nova Medical Inc., Wilmington, MA). A 3D-FSPGR sequence was used for LC imaging using the ‘special’ fat-saturation pulse at 1200Hz off-resonance and 400⁰ flip-angle for MT-preparation (Table 1). A standard MT-prepared 2D-GRE sequence was also acquired (Table 1).For each subject and method, averaging of all runs of the acquired ordinary resolution (OR) data was performed in subject-space with AntsMultivariateTemplateContruction2.sh of ANTs software (v2.3.5; 4 levels, rigid transforms, mutual-information similarity). SR was applied to the individual runs (ANTsPyNet software, model: ‘mriSuperResolution’) and then the same registration matrices were used for averaging the SR data. The LC was segmented based on the semi-automated approach described in Chen et al.7 (adding manual corrections when necessary), and the CNR (defined as CNR=(SLC-SRef-Region)/SDRef-Region) and LC volume were calculated.
To assess the LC’s longitudinal axis, the ROIs were subsequently mapped to 0.5mm MNI152 space (ICBM2009b) via the T1w scan (MT-to-T1w: Rigid; T1w-to-MNI: Affine+Symmetric-image-Normalization (SyN)18 registrations; interpolation: nearest-neighbor) and slice-wise voxel counts in the LC region were computed.
To test the MT effect, the 2D-GRE and 3D-FSPGR sequences were acquired on a gelatin (Hartley’s cubes: https://www.hartleysfruit.co.uk/) and saline phantoms at different off-set frequencies ranging from 100Hz to 3000Hz (Table 1) with similar sequence parameters to the human scans. An additional scan from each of the sequences with MT-off was acquired to calculate magnetization-transfer-ratio (MTR)19.
Results
MTR results for the saline and gelatin phantoms at different off-set frequencies (Figure 1) show direct saturation at short frequencies (<900Hz). As expected, at 1200Hz and above, no MT effect is observed in the saline curve (MTR1200Hz<1.5%). In contrast, the gelatin shows a clear change in skewness of the 2D-GRE (MTR1200Hz=11.7%) and 3D-FSPGR curves (MTR1200Hz=12.2%).Sample OR and SR images of the LC for the 2D-GRE and 3D-FSPGR sequences are displayed in Figure 2. Manual edits of the LC-ROIs were required mostly for the 2D-GRE segmentations because of CSF contamination.
CNR was on average lower in the FSPGR data compared to the 3D-GRE but not significantly different. The SR data increased the CNR using both sequences: on average, ~1.8-fold and 1.3-fold for the 2D-GRE and 3D-FSPGR, respectively (Figure 3(a)).
Compared to the 3D-FSPGR, the LC’s longitudinal axis is not clearly visible in the 2D-GRE OR data because of the low resolution in the z-direction (Figure 2); slice-wise voxel counts were ~34% higher in the 3D-FSPGR case (Figure 4(a), paired t-test, p<0.001).
Compared to the OR, the SR data (Figure 4(b)) shows a smoother distribution of the LC signal across slices (OR vs SR paired t-test: p<0.02) reducing the difference in 2D-GRE and 3D-FSPGR profiles (paired t-test, p=0.17). The SR data also shows a reduced volume (Figure 3(b)), but not reaching significance.
Discussion and Conclusions
We present a 3D MRI protocol to visualize the LC in-vivo in humans at clinical field strengths that can be implemented without sequence modifications. The 3D-FSPGR method showed high LC contrast from the MT-preparation and no CSF contamination from T1-weighting (steady-state spoiled gradient echo sequences with short TR and flip-angle in same order as TR in ms). This resulted in a more accurate semi-automated segmentation and lower average LC-CNR compared to the standard 2D protocol due to CSF signal spillage.Because of the multiple up- and down-sampling stages in the DBPN algorithm it was possible to increase features in the SR images compared to the acquired OR data. For the LC this resulted in an increased CNR and reduction of segmented volume most likely due to the reduction of partial-volume effects. These effects are expected to be lower-limit as alignment and averaging was based on pre-computed matrices from the OR analysis.
Future work will focus on testing reproducibility of the protocol at a shorter total-acquisition times (to approx. 10mins), favorable when imaging patient populations, and tailoring the SR models to focus on enhancing contrast features within the brainstem.
Acknowledgements
No acknowledgement found.References
1. Braak, H., Rüb, U., Gai, W.P. and Del Tredici, K., 2003. Idiopathic Parkinson's disease: possible routes by which vulnerable neuronal types may be subject to neuroinvasion by an unknown pathogen. Journal of neural transmission, 110(5), pp.517-536.
2. Grudzien, A., Shaw, P., Weintraub, S., Bigio, E., Mash, D.C. and Mesulam, M.M., 2007. Locus coeruleus neurofibrillary degeneration in aging, mild cognitive impairment and early Alzheimer's disease. Neurobiology of aging, 28(3), pp.327-335.
3. Kelly, S.C., He, B., Perez, S.E., Ginsberg, S.D., Mufson, E.J. and Counts, S.E., 2017. Locus coeruleus cellular and molecular pathology during the progression of Alzheimer’s disease. Acta Neuropathologica Communications, 5(1), pp.1-14.
4. O’Callaghan, C., Hezemans, F.H., Ye, R., Rua, C., Jones, P.S., Murley, A.G., Holland, N., Regenthal, R., Tsvetanov, K.A., Wolpe, N. and Barker, R.A., 2021. Locus coeruleus integrity and the effect of atomoxetine on response inhibition in Parkinson’s disease. Brain, 144(8), pp.2513-2526.
5. Passamonti, L., Lansdall, C.J. and Rowe, J.B., 2018. The neuroanatomical and neurochemical basis of apathy and impulsivity in frontotemporal lobar degeneration. Current opinion in behavioral sciences, 22, pp.14-20.
6. Weinshenker, D., 2008. Functional consequences of locus coeruleus degeneration in Alzheimer's disease. Current Alzheimer Research, 5(3), pp.342-345.
7. Chen, X., Huddleston, D.E., Langley, J., Ahn, S., Barnum, C.J., Factor, S.A., Levey, A.I. and Hu, X., 2014. Simultaneous imaging of locus coeruleus and substantia nigra with a quantitative neuromelanin MRI approach. Magnetic resonance imaging, 32(10), pp.1301-1306.
8. Trujillo, P., Petersen, K.J., Cronin, M.J., Lin, Y.C., Kang, H., Donahue, M.J., Smith, S.A. and Claassen, D.O., 2019. Quantitative magnetization transfer imaging of the human locus coeruleus. Neuroimage, 200, pp.191-198.
9. Priovoulos, N., Jacobs, H.I., Ivanov, D., Uludağ, K., Verhey, F.R. and Poser, B.A., 2018. High-resolution in vivo imaging of human locus coeruleus by magnetization transfer MRI at 3T and 7T. Neuroimage, 168, pp.427-436.
10. Priovoulos, N., van Boxel, S.C., Jacobs, H.I., Poser, B.A., Uludag, K., Verhey, F.R. and Ivanov, D., 2020. Unraveling the contributions to the neuromelanin-MRI contrast. Brain Structure and Function, 225(9), pp.2757-2774.
11. German, D.C., Walker, B.S., Manaye, K., Smith, W.K., Woodward, D.J. and North, A.J., 1988. The human locus coeruleus: computer reconstruction of cellular distribution. Journal of Neuroscience, 8(5), pp.1776-1788.
12. Isaias, I.U., Trujillo, P., Summers, P., Marotta, G., Mainardi, L., Pezzoli, G., Zecca, L. and Costa, A., 2016. Neuromelanin imaging and dopaminergic loss in Parkinson's disease. Frontiers in aging neuroscience, 8, p.196.
13. Ye, R., Rua, C., O'Callaghan, C., Jones, P.S., Hezemans, F.H., Kaalund, S.S., Tsvetanov, K.A., Rodgers, C.T., Williams, G., Passamonti, L. and Rowe, J.B., 2021. An in vivo probabilistic atlas of the human locus coeruleus at ultra-high field. Neuroimage, 225, p.117487.
14. Chen, Y., Xie, Y., Zhou, Z., Shi, F., Christodoulou, A.G. and Li, D., 2018, April. Brain MRI super resolution using 3D deep densely connected neural networks. In 2018 IEEE 15th International Symposium on Biomedical Imaging (ISBI 2018) (pp. 739-742). IEEE.
15. Tustison, N.J., Avants, B.B., Lin, Z., Feng, X., Cullen, N., Mata, J.F., Flors, L., Gee, J.C., Altes, T.A., Mugler III, J.P. and Qing, K., 2019. Convolutional neural networks with template-based data augmentation for functional lung image quantification. Academic radiology, 26(3), pp.412-423.
16. Hesterman, J., Avants, B., Greenblatt, E. and Tustison, N.J., 2020. Deep volumetric super‐resolution improves the detection of amyloid‐related cross‐sectional group differences in MCI: Neuroimaging/New imaging methods. Alzheimer's & Dementia, 16, p.e039961.
17. Haris, M., Shakhnarovich, G. and Ukita, N., 2018. Deep back-projection networks for super-resolution. In Proceedings of the IEEE conference on computer vision and pattern recognition (pp. 1664-1673).
18. Avants, B.B., Epstein, C.L., Grossman, M. and Gee, J.C., 2008. Symmetric diffeomorphic image registration with cross-correlation: evaluating automated labeling of elderly and neurodegenerative brain. Medical image analysis, 12(1), pp.26-41.
19. Henkelman, R.M., Stanisz, G.J. and Graham, S.J., 2001. Magnetization transfer in MRI: a review. NMR in Biomedicine: An International Journal Devoted to the Development and Application of Magnetic Resonance In Vivo, 14(2), pp.57-64.
Figures

Table 1 Scanning parameters of the 2D-GRE and 3D-FSPGR sequences using in the healthy controls (HC) and phantom experiments.
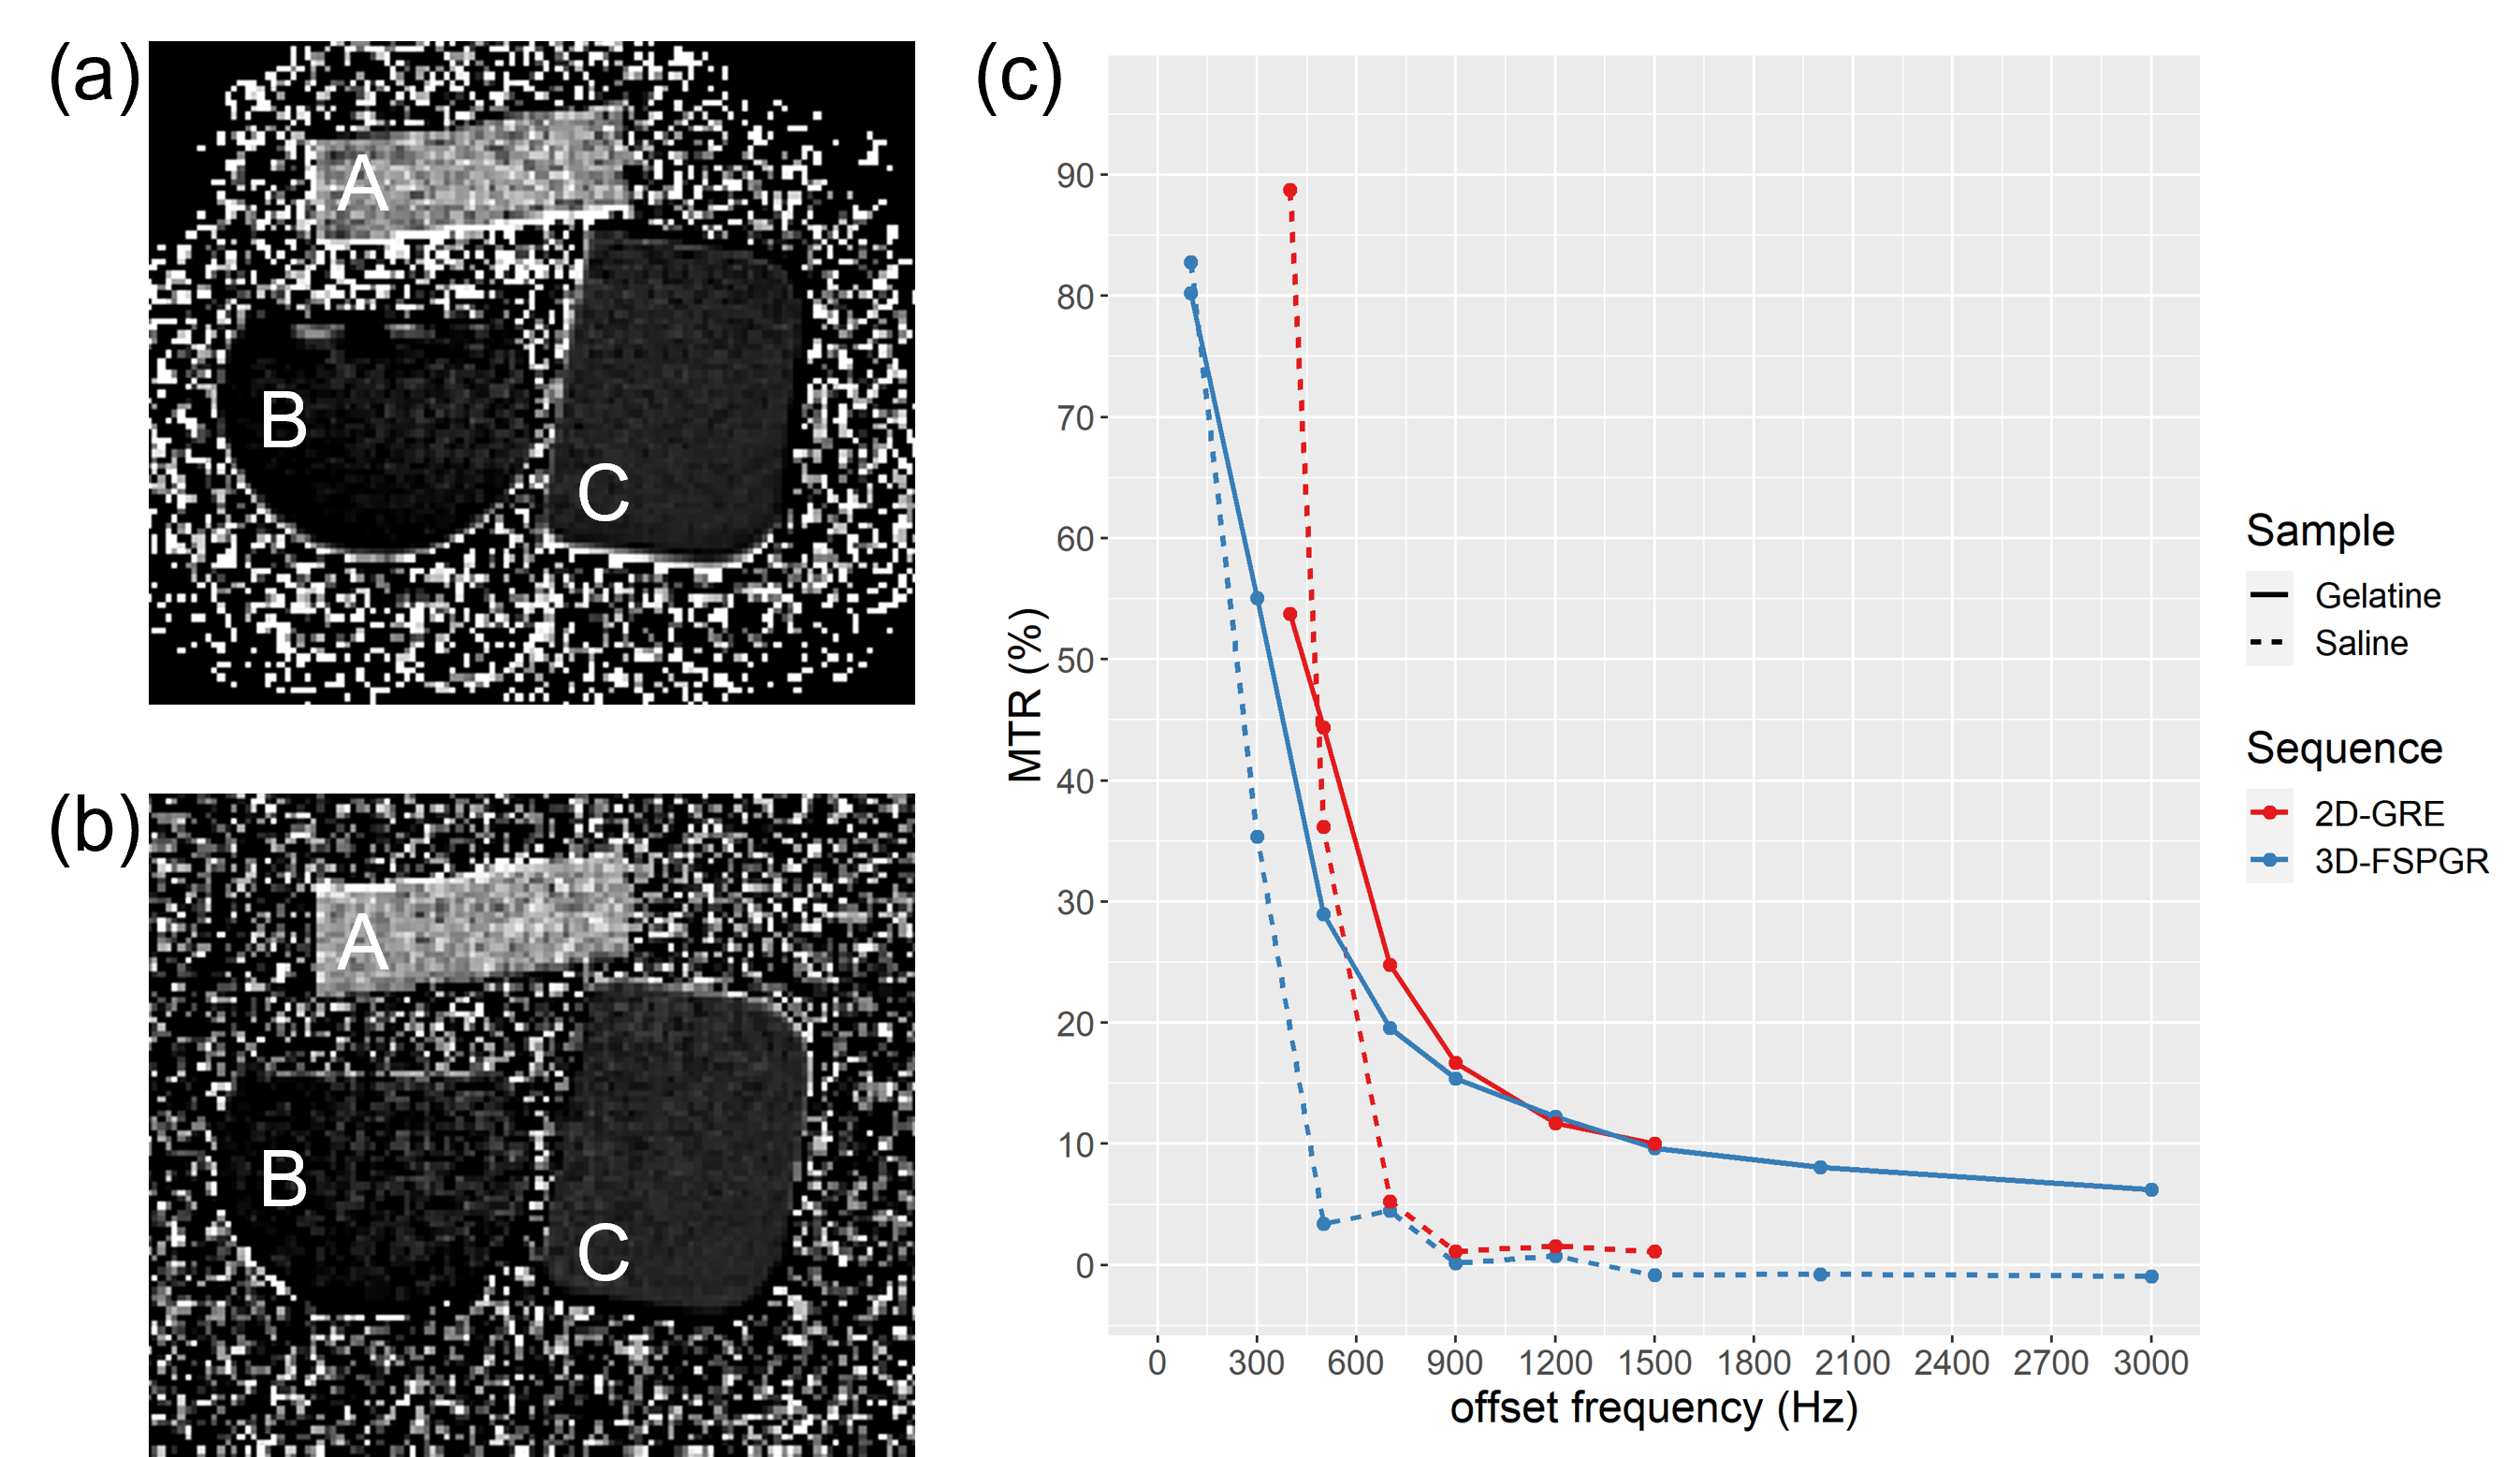
Figure 2 Axial and coronal views of the locus coeruleus (LC) obtained after averaging the OR and SR (a) 2D-GRE and (b) 3D-FSPGR data. (c) Example of the semi-automated segmentation without the manual adjustments in the OR 2D-GRE and 3D-GRE data. Blue arrows point to voxels that were included in the LC ROI but are part of the CSF. These were not included in the 3D-FSPGR segmentation (green arrows).
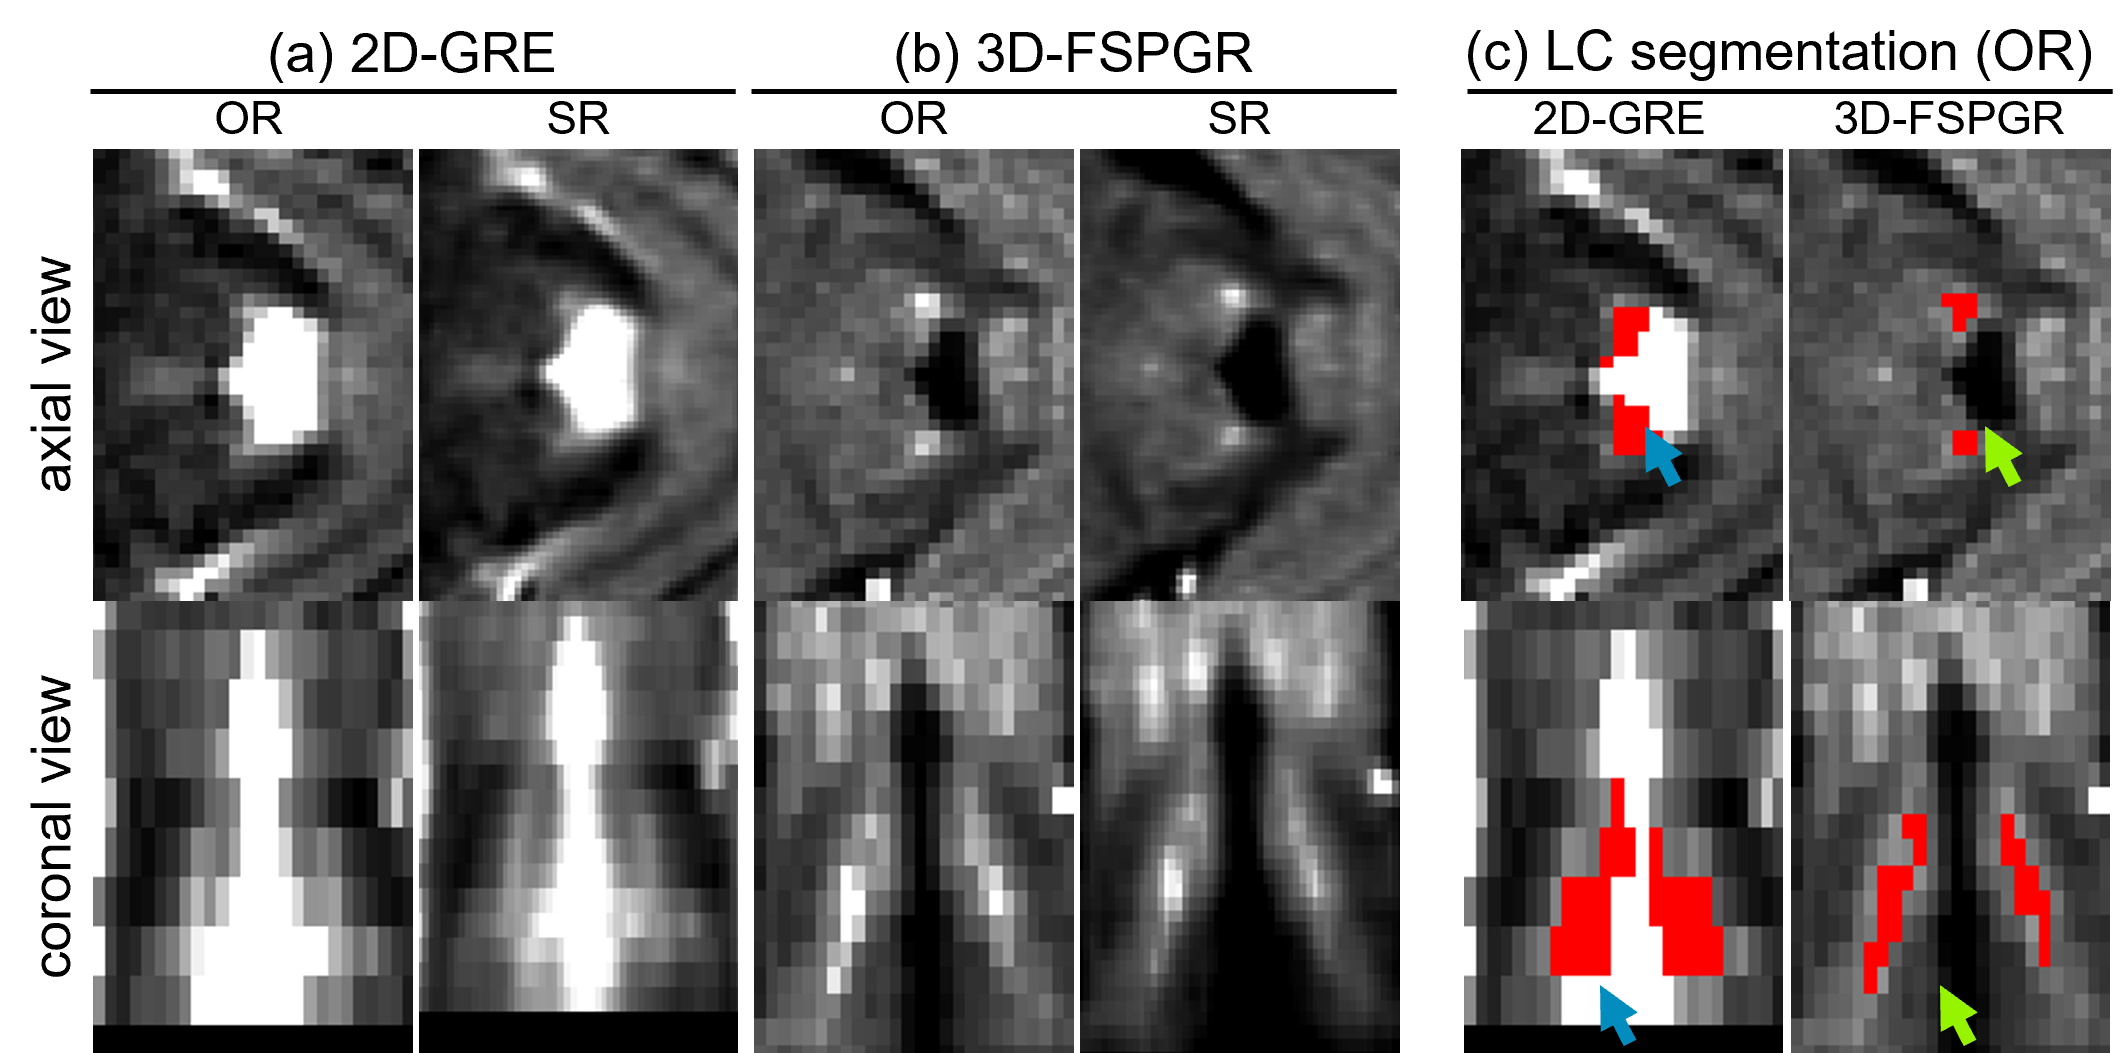
Figure 2 Axial and coronal views of the locus coeruleus (LC) obtained after averaging the OR and SR (a) 2D-GRE and (b) 3D-FSPGR data. (c) Example of the semi-automated segmentation without the manual adjustments in the OR 2D-GRE and 3D-GRE data. Blue arrows point to voxels that were included in the LC ROI but are part of the CSF. These were not included in the 3D-FSPGR segmentation (green arrows).
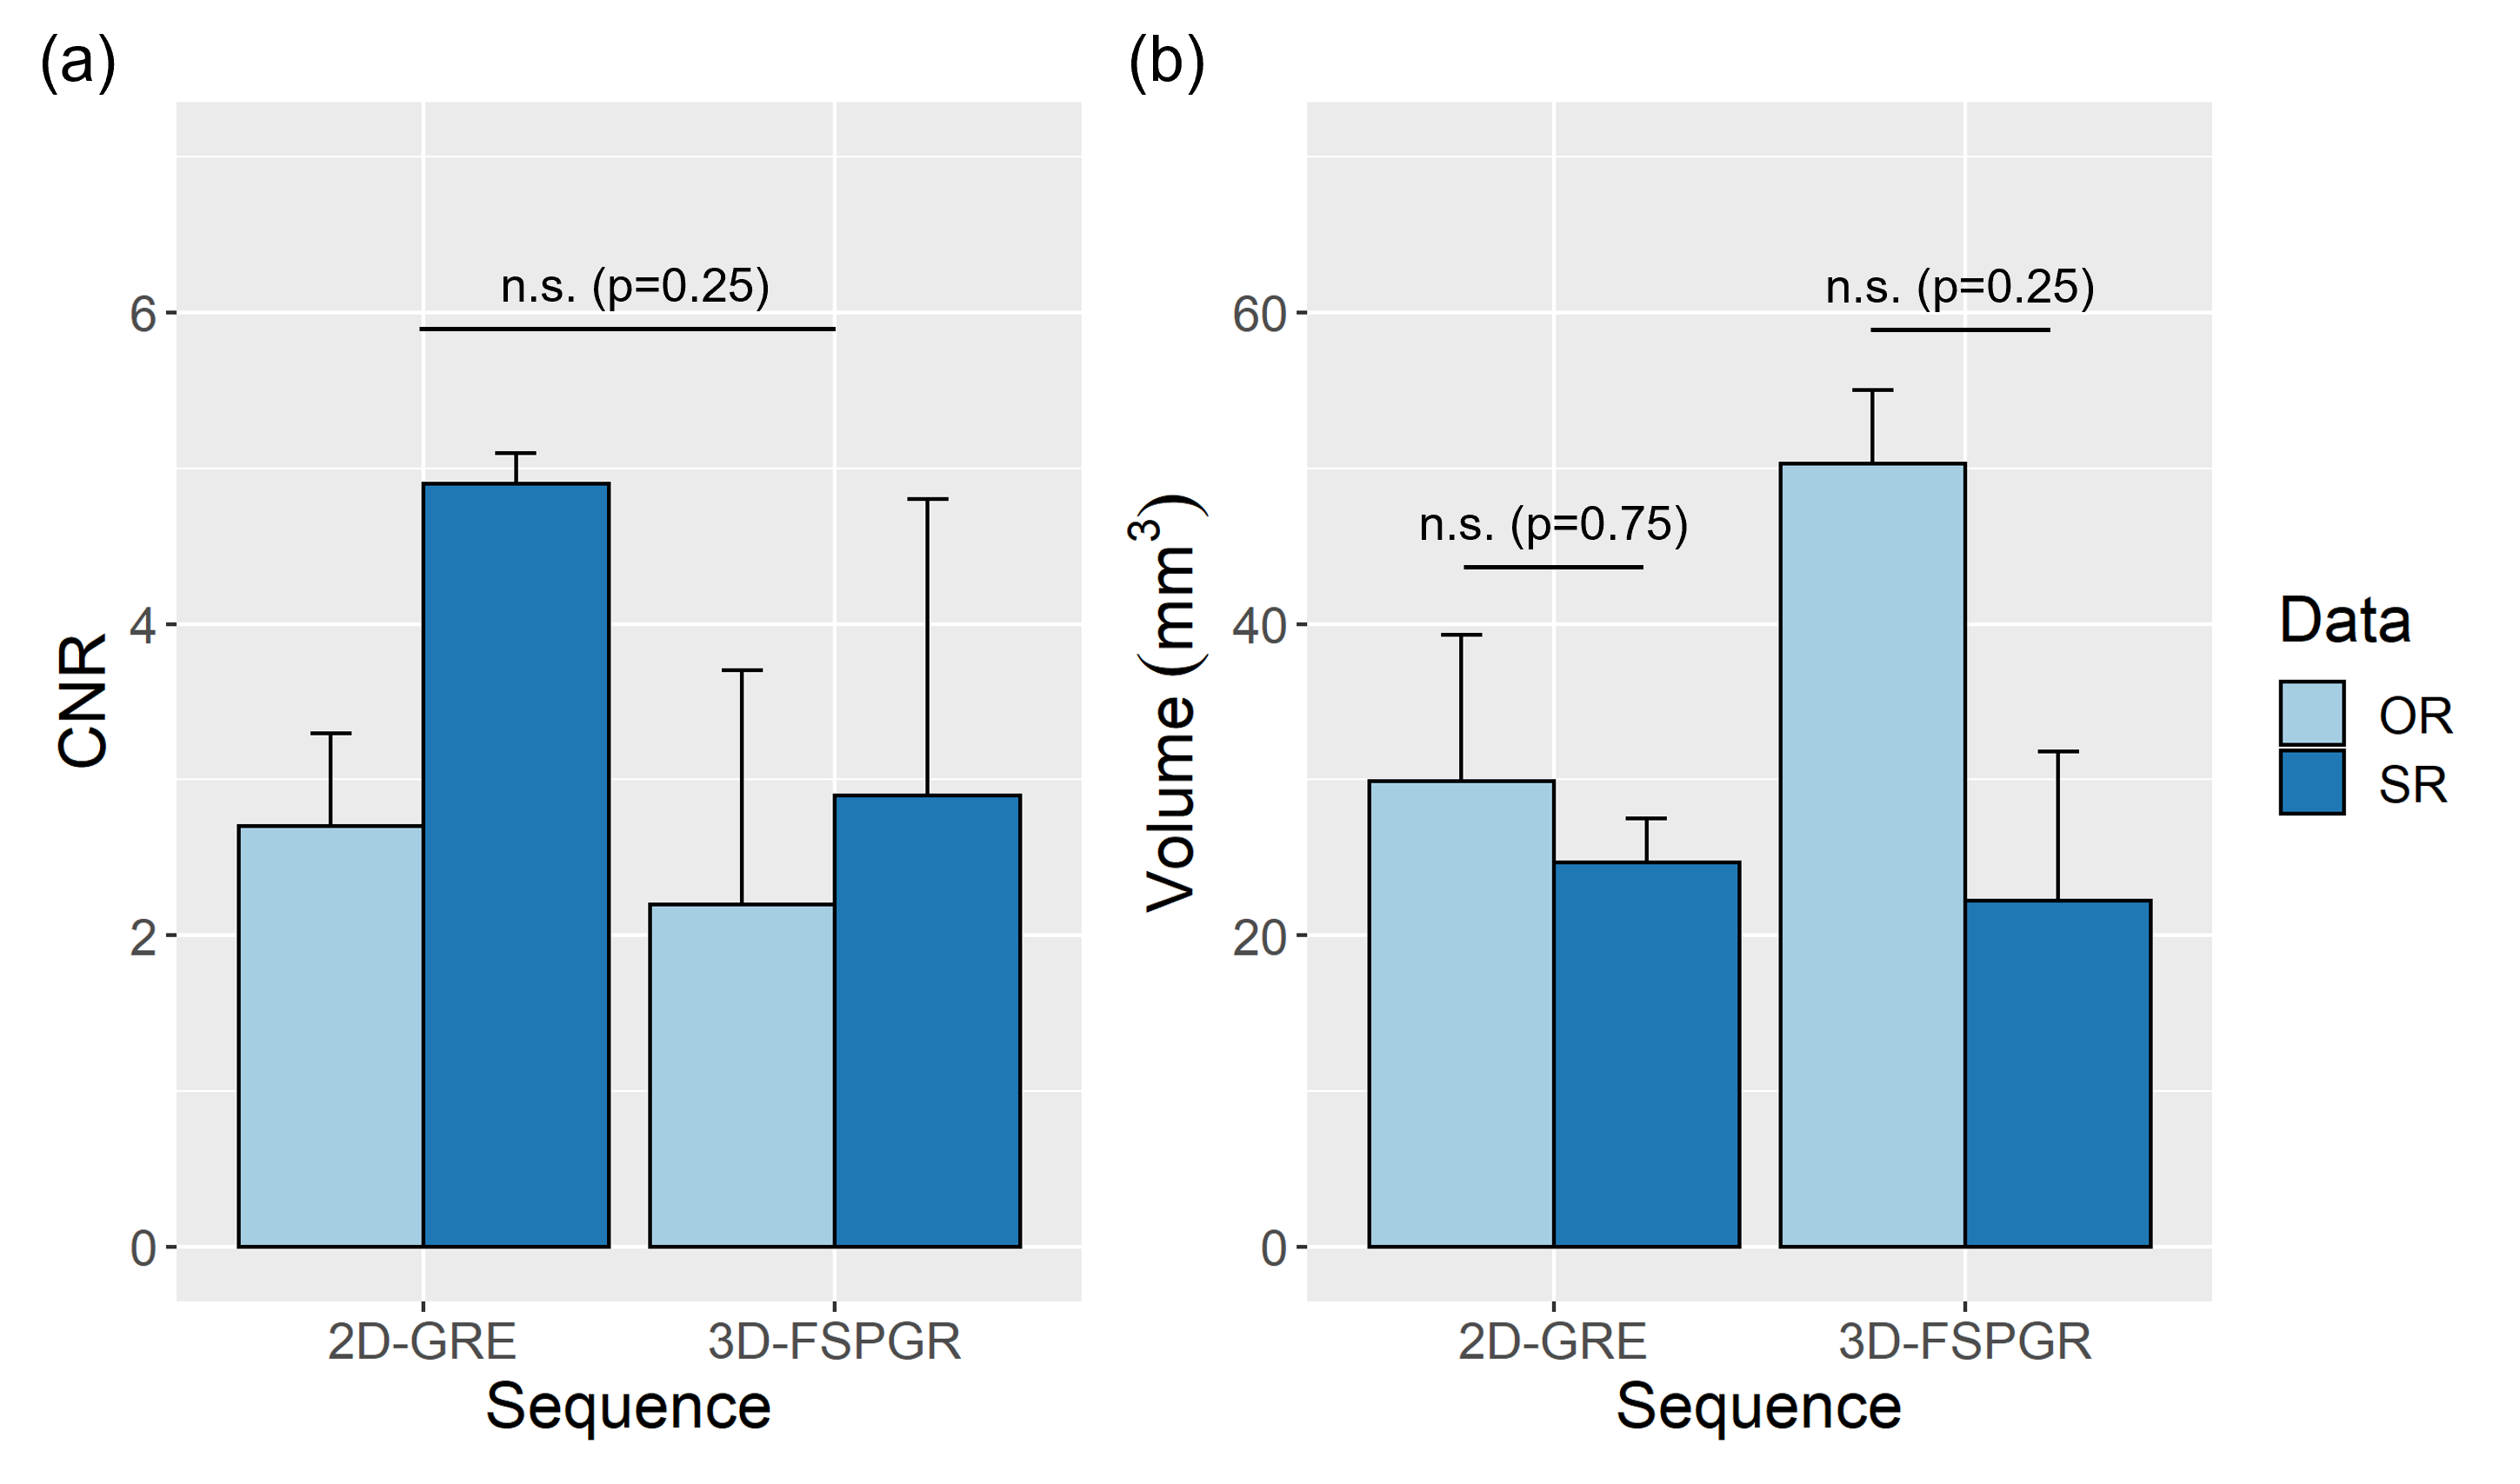
Figure 3 Boxplots of the average and standard-deviation of (a) CNR and (b) volume (mm3) from the left and right segmented LC on the 3 healthy controls. The acquired data (OR: light blue) and super-resolution data (SR: dark blue) are shown in each plot. Paired Wilcox-tests were performed for group comparisons and p-values are reported in the plots.
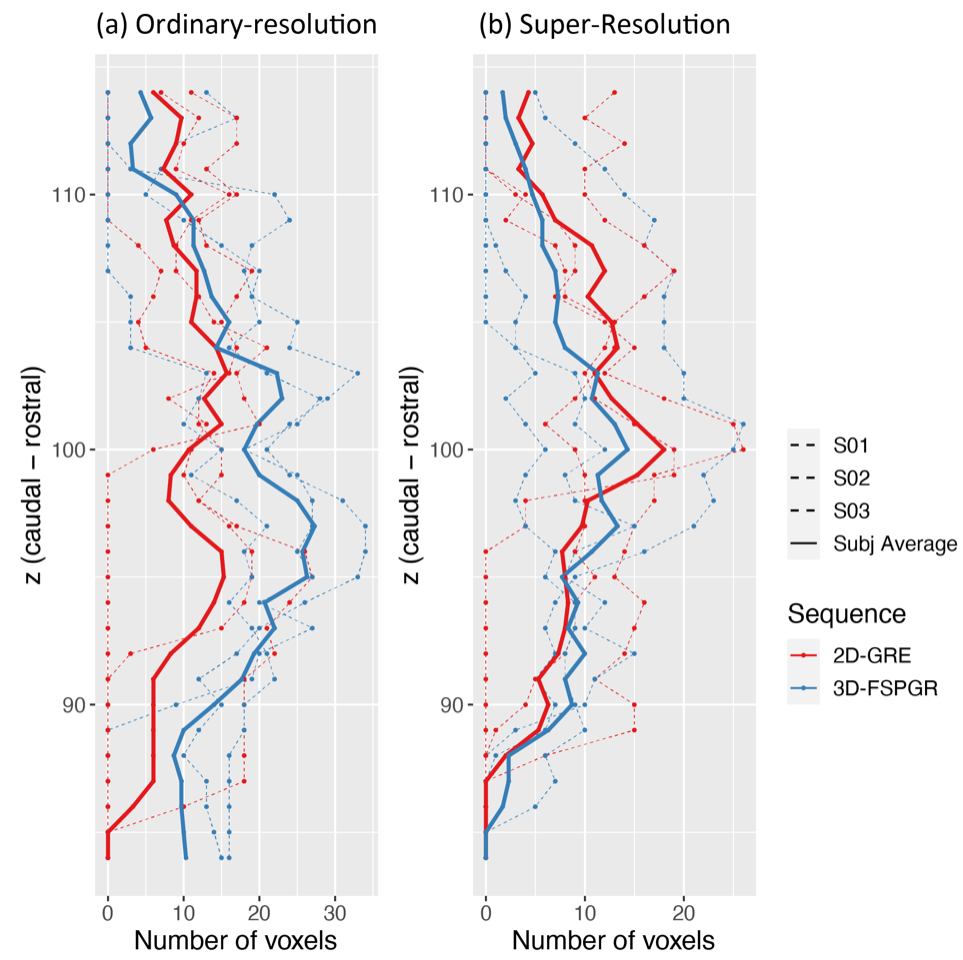
Figure 4 Slice-wise voxel counts in MNI152 space of the 2D-GRE (red) and 3D-FSPGR (blue) LC ROIs obtained for (a) the acquired (OR) and (b) super-resolution (SR) data. After applying the semi-automated segmentation with manual corrections to each of the subject’s datasets, ROIs were mapped to MNI152 space. LC voxels were counted for each subject and were plotted in dashed lines. The subject-average results were also plotted in solid lines.