2642
Brain-wide Quantitative Imaging Measures in progressive Multiple Sclerosis: a Multi-modal Framework and Longitudinal Validation Study
Yukai Zou1,2, Aravinthan Varatharaj1,3, Charlotte Stuart1, Finn Lennartsson4, Angela Darekar2, Claudia AM Gandini Wheeler-Kingshott5, and Ian Galea1,3
1Clinical Neurosciences, University of Southampton, Southampton, United Kingdom, 2Medical Physics Department, University Hospital Southampton NHS Foundation Trust, Southampton, United Kingdom, 3Wessex Neurological Centre, University Hospital Southampton NHS Foundation Trust, Southampton, United Kingdom, 4Department of Clinical Sciences, Diagnostic Radiology, Lund University, Lund, Sweden, 5NMR Research Unit, Department of Neuroinflammation, Queen Square MS Centre, UCL Queen Square Institute of Neurology, London, United Kingdom
1Clinical Neurosciences, University of Southampton, Southampton, United Kingdom, 2Medical Physics Department, University Hospital Southampton NHS Foundation Trust, Southampton, United Kingdom, 3Wessex Neurological Centre, University Hospital Southampton NHS Foundation Trust, Southampton, United Kingdom, 4Department of Clinical Sciences, Diagnostic Radiology, Lund University, Lund, Sweden, 5NMR Research Unit, Department of Neuroinflammation, Queen Square MS Centre, UCL Queen Square Institute of Neurology, London, United Kingdom
Synopsis
This study aims to develop quantitative MRI measures that are more statistically straightforward to correlate with clinical disability of progressive MS individuals, whose brains often show atrophy and tissue damage that vary amongst regions, which is hard to interpret clinically. The impacts of different software packages and MR contrasts on estimating brain atrophy were investigated. Individual DTI profiles characterised specific progression within each brain region, preserving the heterogeneity amongst individuals. Some of the measures were shown to capture the overall progression and correlate with clinical disability. In summary, this framework shows promise to integrate quantitative MRI into routine clinical care.
Introduction
The fast-evolving techniques of quantitative MRI add new dimensions to probing human brain development and pathophysiology.1 However, clinical interpretation of imaging-based biomarkers still faces barriers. Non-standardised image processing pipelines, such as different choices of software packages and MR contrasts as inputs, add variances when extracting quantitative measures such as brain atrophy in multiple sclerosis (MS). In existing MS neuroimaging literature, diffusion-weighted imaging (DWI) is more often used in research for comparisons between patient groups than for patient management,2 and compromised tissue integrity is often reported within multiple brain regions across multiple groups,3 which complicates the statistics to correlate with clinical measures due to multiple comparison testing.4 More critically, this approach fails to preserve the heterogeneity of susceptibility to systemic inflammation among brain regions at different stages of MS pathology evolution, and among different patients.5–7 This study aims to 1) investigate the impacts of different segmentation tools and MR contrasts on estimating brain volume changes, 2) compute brain-wide quantitative MRI measures for progressive MS individuals, and 3) correlate the proposed measures with the MS Functional Composite,8 a holistic measure of clinical disability in progressive MS.Methods
Thirty-seven participants (ages: 32-70; mean=52.5) completed two MRI assessments, approximately 2.5 years apart. T1- and T2-weighted, FLAIR, and DWI data were collected on a 3T Siemens Skyra scanner via a 20-element phased-array coil. An overview of the processing pipeline was summarized in Figure 1. Three segmentation software packages were utilized: Cross-sectional SAMSEG,9,10 LesionTOADS,11 and FSL-SIENA with Lesion Segmentation Toolbox (www.statisticalmodelling.de/lst.html) (SIENA+LST). SAMSEG was implemented following online instruction (https://surfer.nmr.mgh.harvard.edu/fswiki/Samseg), using different combinations of contrasts as inputs: 1) T1 + FLAIR, 2) T1 + T2, and 3) T1 + FLAIR2, a multiplication of FLAIR and T2, which improve lesion segmentation and SNR of the FLAIR acquired at lower field strength.12 The implementation of LesionTOADS is available at a Github repo (https://github.com/sotnir/lesion-toads). SIENA started by extracting brain and skull images from the two-timepoint whole-head input data13; settings of the brain extraction tool (FSL-BET) were modified from default according to optimisation recommendations for MS.14 Standard-space masking was applied to improve removal of non-brain tissue to improve SIENA output.15 The two brain images were then aligned to each other using the skull images to constrain the registration scaling,16 and both brain images were resampled into the space halfway between the two. Next, tissue-type segmentation was carried out using FSL-FAST17 to find brain/non-brain edge points, and then perpendicular edge displacement (between the two timepoints) was estimated at these edge points. After segmentation, annualised percentage brain volume change (aPBVC) were estimated between the two timepoints. Three cut-offs of brain atrophy rates were set at -0.40%, -0.46%, and -0.52%, to achieve specificity levels of 80%, 90%, and 95% respectively.18 At each threshold, Pearson’s Chi-square test was performed to evaluate the sensitivity of distinguishing progressors. Maps of diffusion tensor imaging (DTI) metrics were estimated at each time point (Figure 1), including fractional anisotropy (FA) and mean diffusivity (MD), and a total of 51 regions from two brain atlases were applied to compute regional DTI values. Within each region, annualized DTI change (Regional k) were computed across the two timepoints. An unweighted average was then applied per individual, to summarize all the k as the proposed brain-wide DTI measures (Overall k). aPBVC and Overall k were then correlated with the annual change of MSFC.Results
At all three thresholds, T1 + T2 exhibited the lowest sensitivity in distinguishing MS progressors (Figure 2), and there was a significant difference among the five approaches in terms of distinguishing MS progressors (X2 > 13.39, p < 0.01) (Figure 2). A comprehensive profile of regional k (Figure 3) and a summary score of Overall k (Figure 4) were computed on an individual basis. Higher annual change of MSFC correlated with lower Overall kFA, and higher aPBVC derived from T1 + FLAIR pairs and from the SIENA+LST method (Table 1).Discussion and Conclusion
We demonstrated that choices of software packages and MR contrasts had an impact on the estimates of brain volume in progressive MS individuals. The heterogeneity may come from performance of segmentation; for instance, LesionTOADS segmented ventricles as one ROI, whereas SAMSEG subdivide ventricles into multiple ROIs. These outcomes can lead to differences when computing aPBVC.The proposed brain-wide DTI measures can simplify the statistics for interpreting clinical disability, and the heterogeneous DTI profiles were preserved for individual cases. We showed that changes in aPBVCSIENA+LST,T1+FLAIR and Overall kFA reflected changes in clinical state over time, suggesting that faster disability progression was related to more severe brain atrophy and microstructural deficits. The proposed metrics can be served as potential outcome measures for clinical management, and as information regarding the biological mechanisms of MS progression.
Acknowledgements
We would like to thank Dr Vanessa Wiggermann for her assistance on troubleshooting the image processing on LesionTOADS. This work was supported by Wessex Medical Research and MS Society grant number 996. Computation was supported by Iridis 5, the supercomputer resource at University of Southampton.References
1. Seiberlich, N. et al. Quantitative Magnetic Resonance Imaging. (Academic Press, 2020).
2. Granziera, C. et al. Quantitative magnetic resonance imaging towards clinical application in multiple sclerosis. Brain awab029 (2021). doi:10.1093/brain/awab029
3. Enzinger, C. et al. Nonconventional MRI and microstructural cerebral changes in multiple sclerosis. Nat. Rev. Neurol. 11, 676–686 (2015).
4. Barnes, G. R., Litvak, V., Brookes, M. J. & Friston, K. J. Controlling false positive rates in mass-multivariate tests for electromagnetic responses. Neuroimage 56, 1072–1081 (2011).
5. Gold, R., Linington, C. & Lassmann, H. Understanding pathogenesis and therapy of multiple sclerosis via animal models: 70 years of merits and culprits in experimental autoimmune encephalomyelitis research. Brain 129, 1953–1971 (2006).
6. Kutzelnigg, A. et al. Cortical demyelination and diffuse white matter injury in multiple sclerosis. Brain 128, 2705–2712 (2005).
7. Revesz, T., Kidd, D., Thompson, A. J., Barnard, R. O. & McDonald, W. I. A comparison of the pathology of primary and secondary progressive multiple sclerosis. Brain 117, 759–765 (1994).
8. Rudick, R. A. et al. Assessing disability progression with the Multiple Sclerosis Functional Composite. Mult. Scler. 15, 984–997 (2009).
9. Puonti, O., Iglesias, J. E. & Van Leemput, K. Fast and sequence-adaptive whole-brain segmentation using parametric Bayesian modeling. Neuroimage 143, 235–249 (2016).
10. Cerri, S. et al. A contrast-adaptive method for simultaneous whole-brain and lesion segmentation in multiple sclerosis. Neuroimage 225, 117471 (2021).
11. Shiee, N. et al. A topology-preserving approach to the segmentation of brain images with multiple sclerosis lesions. Neuroimage 49, 1524–1535 (2010).
12. Wiggermann, V., Hernández-Torres, E., Traboulsee, A., Li, D. K. B. & Rauscher, A. FLAIR2: A Combination of FLAIR and T2 for Improved MS Lesion Detection. Am. J. Neuroradiol. 37, 259 LP – 265 (2016).
13. Smith, S. M. Fast robust automated brain extraction. Hum. Brain Mapp. 17, 143–155 (2002).
14. Popescu, V. et al. Optimizing parameter choice for FSL-Brain Extraction Tool (BET) on 3D T1 images in multiple sclerosis. Neuroimage 61, 1484–1494 (2012).
15. Battaglini, M., Smith, S. M., Brogi, S. & De Stefano, N. Enhanced brain extraction improves the accuracy of brain atrophy estimation. Neuroimage 40, 583–589 (2008).
16. Jenkinson, M., Bannister, P., Brady, M. & Smith, S. Improved optimization for the robust and accurate linear registration and motion correction of brain images. Neuroimage 17, 825–841 (2002).
17. Zhang, Y., Brady, M. & Smith, S. Segmentation of brain MR images through a hidden Markov random field model and the expectation-maximization algorithm. IEEE Trans. Med. Imaging 20, 45–57 (2001).
18. De Stefano, N. et al. Establishing pathological cut-offs of brain atrophy rates in multiple sclerosis. J. Neurol. Neurosurg. Psychiatry 87, 93–99 (2016).
Figures
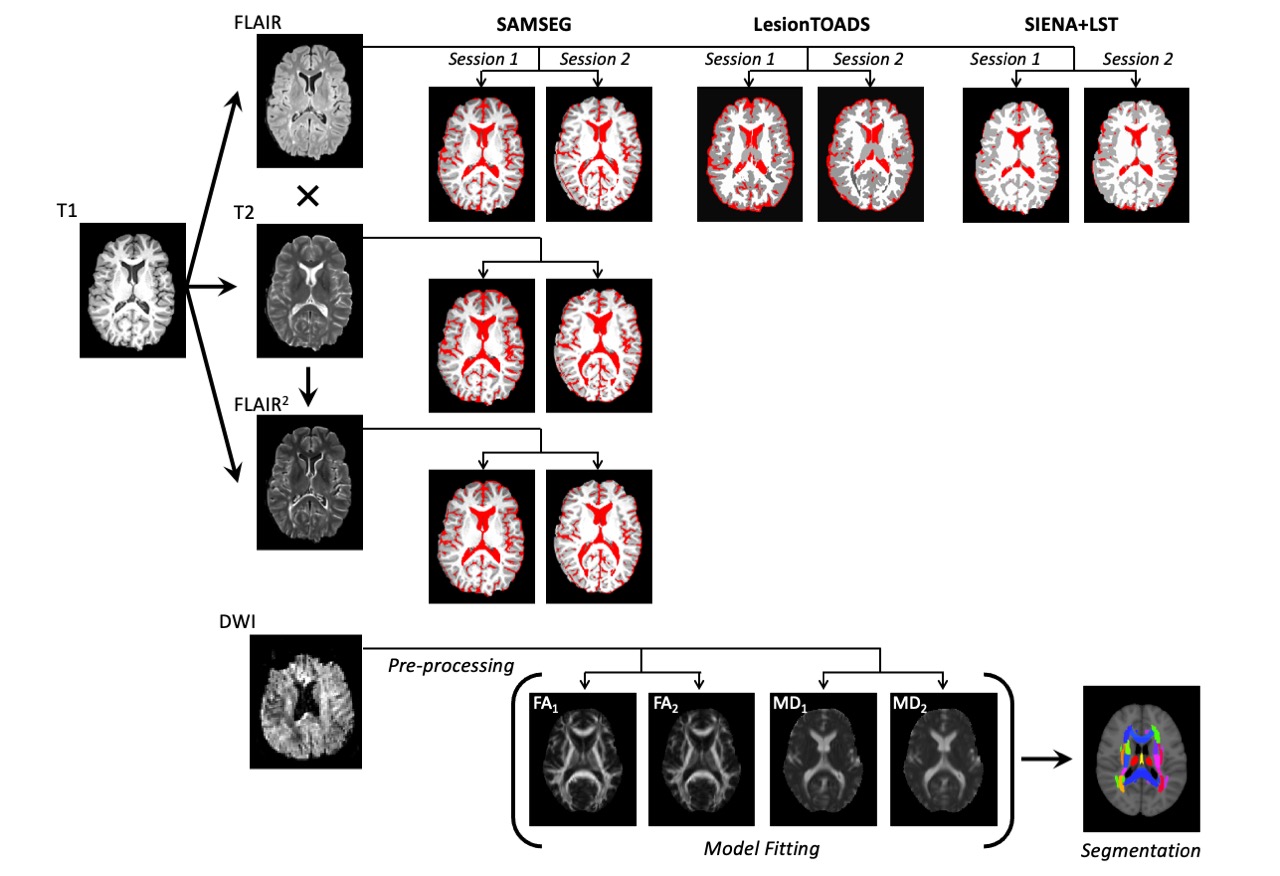
Figure 1. Workflow of the multi-modal framework for estimating annualised percentage brain volume change (aPBVC) using different software packages and MR contrasts, and for estimating brain-wide diffusion-tensor imaging metrics.
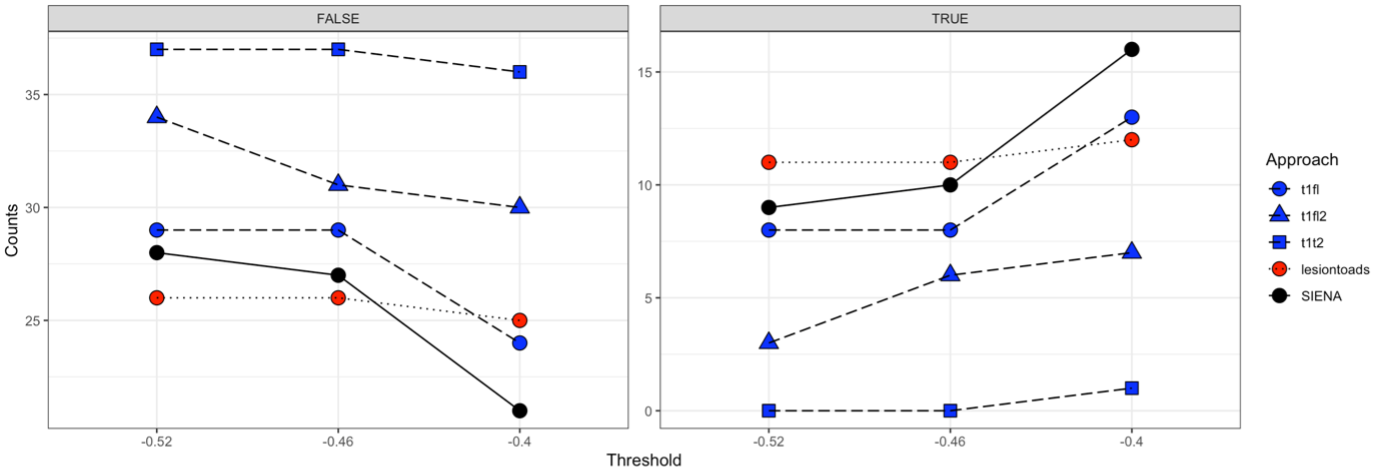
Figure 2. Sensitivity of five approaches to distinguish MS progressors at three thresholds.
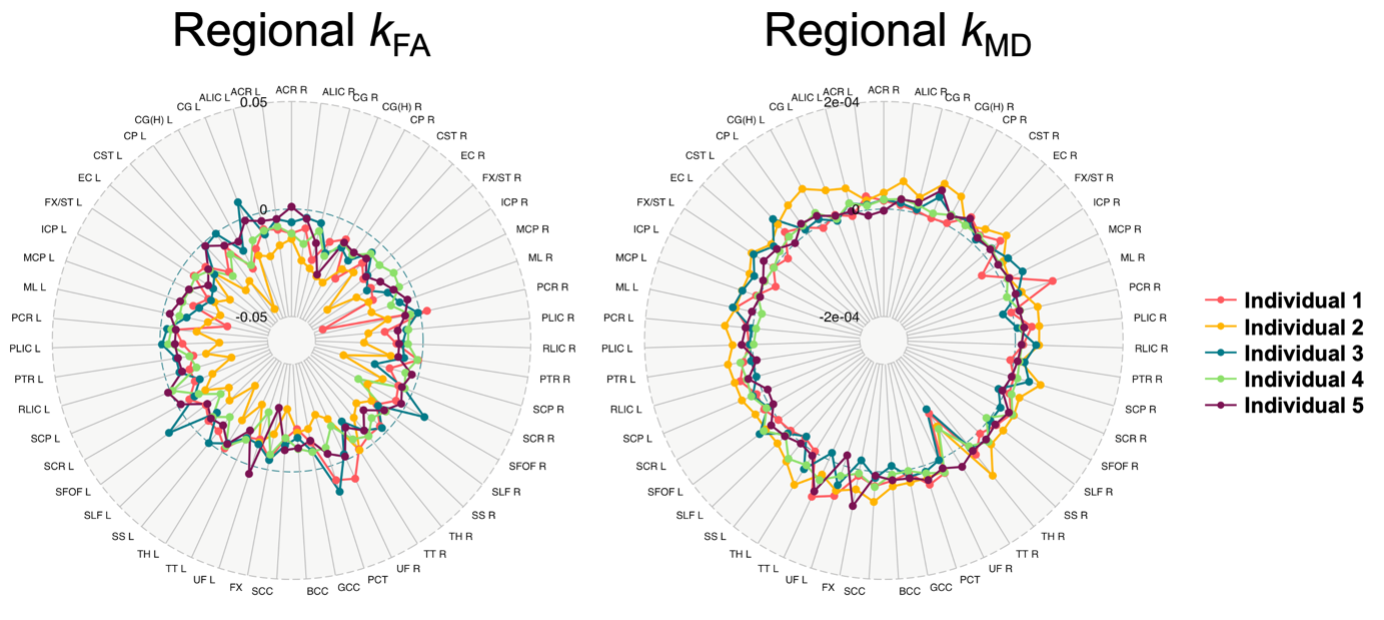
Figure 3. Regional annualised change of fractional anisotropy (kFA) and mean diffusivity (kMD) for five individuals.
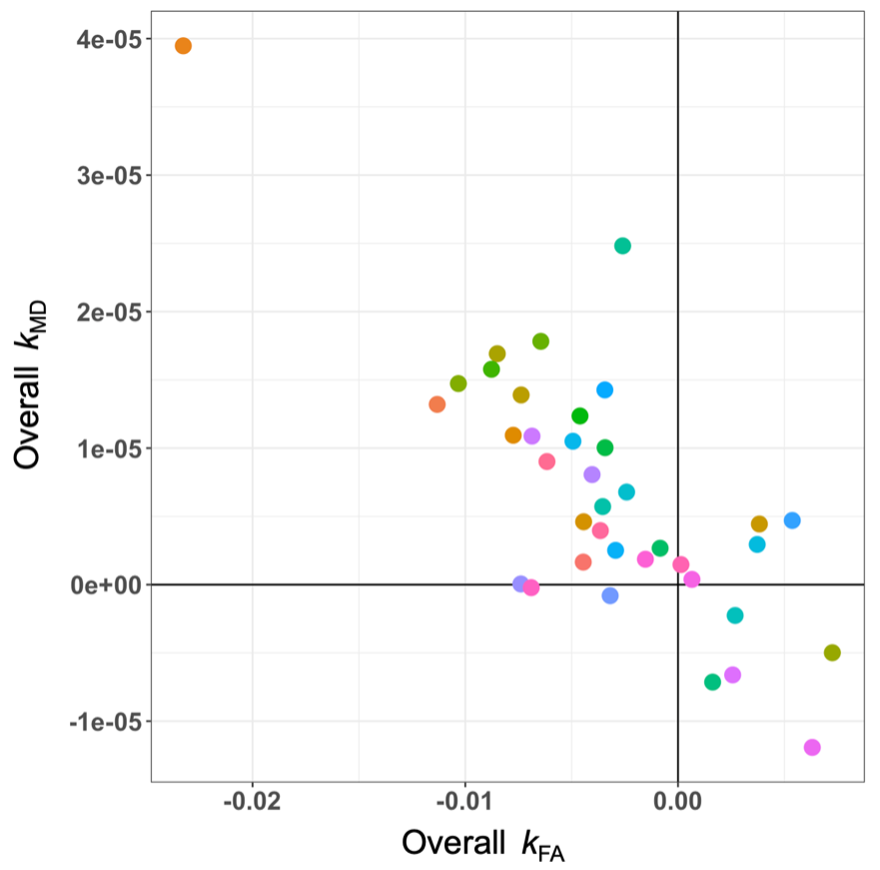
Figure 4. Scatter plot illustrating the unweighted average of fractional anisotropy (Overall kFA) and mean diffusivity (Overall kMD) for all the study participants.
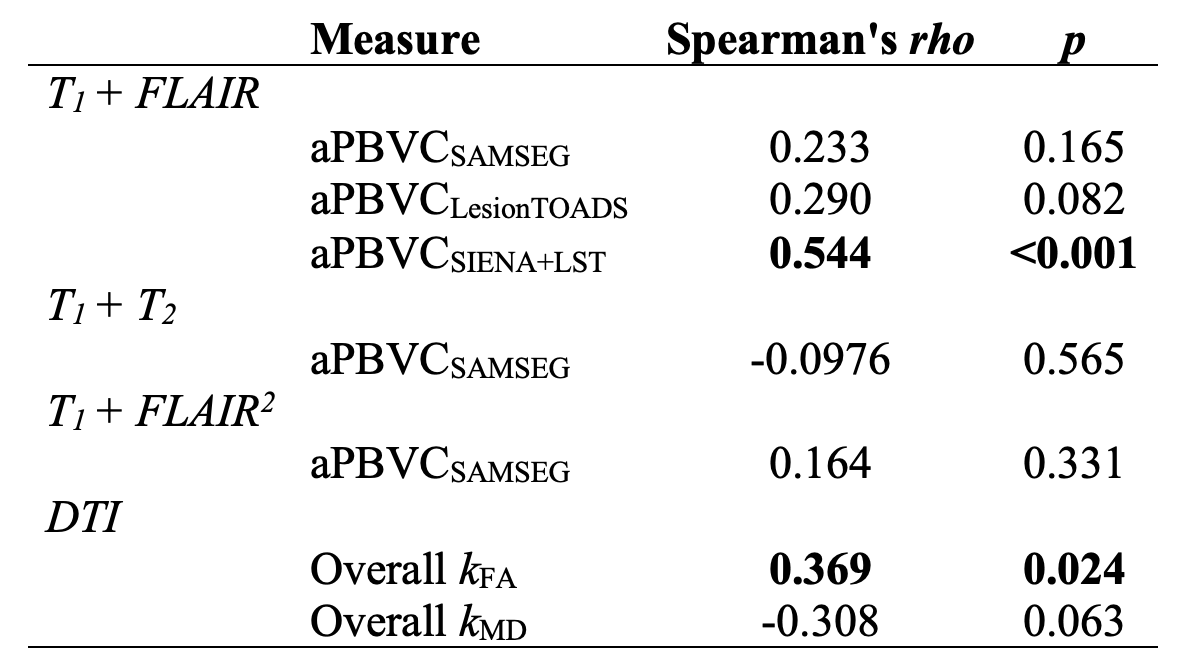
Table 1. Correlations with MS Functional Composites.
DOI: https://doi.org/10.58530/2022/2642