2639
BRAIN VOLUMES IN SICKLE CELL DISEASE ACROSS THE LIFESPAN: ALGORITHM PERFORMANCE AND CORRESPONDENCE WITH BLOOD OXYGEN CONTENT1Pediatric Neurology, Vanderbilt University Medical Center, Nashville, TN, United States, 2Neurology, Vanderbilt University Medical Center, Nashville, TN, United States, 3Radiology, Vanderbilt University Medical Center, Nashville, TN, United States, 4Medicine; Hematology and Oncology, Vanderbilt University Medical Center, Nashville, TN, United States, 5Rodeghier Consulting, Chicago, IL, United States
Synopsis
Brain tissue volumes were calculated in adults and children with sickle cell disease (SCD) across the lifespan for different segmentation algorithms and clinical indicators of disease. Tissue volume reductions in persons with SCD without prior stroke were detected when using FreeSurfer, but not other software, highlighting algorithm bias. Arterial oxygen content was directly related to tissue volumes when using FreeSurfer and SIENAX. Brain tissue volume was not associated with silent cerebral infarcts (SCIs). Findings highlight the subtlety of tissue volume changes in SCD, provide age-specific reference-standards, and motivate an integrated approach of anatomical and functional assessments for informing SCD care.
Introduction
This work endeavored to quantify brain tissue volumes in adults and children with sickle cell disease (SCD), and to understand how volumes vary with quantification algorithm and oxygen delivery. SCD is a hemolytic anemia characterized by sickled red blood cells containing hemoglobin S1. Silent cerebral infarcts (SCIs) are infarcts present on MRI without focal neurological deficits and increase in prevalence in SCD with age, and typically occur in border zone watershed regions2-5. Though it is known that the cerebral blood flow (CBF) scales with SCD severity6, other anatomical and functional imaging biomarkers that portend impairment and SCI development are needed. SCD and volumetric tissue studies have reached differing conclusions: reductions in (i) total brain volume over time7 as well as (ii) gray matter volume (GMV)8 and (iii) white matter volume (WMV)9 cross-sectionally have all been reported, and findings are also complicated by different inclusion criteria and software utilized10,11.Using three software packages (FreeSurfer, SPM and SIENAX) to assess tissue volume, we hypothesized that compared to health controls (HC), persons with SCD have reduced GMV and WMV and this tissue volume reduction correlates with arterial oxygen content. Secondary hypotheses are that software choice impacts findings, and correction for parenchymal blood volume fraction (ml blood / ml brain) is required when comparing participants with different hemodynamic compensation profiles secondary to reduced blood oxygen content.
Materials and Methods
Participants 6-40 years old with SCD (HbSS or HbSβ0-thalassemia) provided informed, written consent and were scanned at 3T (Philips Healthcare). Race- and age-matched controls within three years (HbAA) were recruited. SCD inclusion criteria: compliant on oral hydroxyurea. Exclusion criteria: contraindication to 3T MRI, overt stroke, regular blood transfusions, major neurological condition besides SCD, major structural brain abnormality.Arterial blood oxygen content (CaO2) was calculated using hemoglobin, arterial oxygen saturation, and blood oxygen carrying capacity at scan time. A standard 3D T1-weighted (MPRAGE; TR/TI=8.1/3.8 ms; spatial resolution=1 mm isotropic) sequence was acquired for volume analysis. Axial and coronal 2D FLAIR sequences were acquired for SCI localization. SCIs were defined as lesions with >3mm extent in two planes on FLAIR for all participants. Due to the large difference in CBF (ml blood/100g tissue/min) and CBV (ml blood/ml brain) between SCD and HC participants, a pseudo-continuous arterial spin labeling (pCASL) sequence was collected for CBF estimation and Grubb relationship applied to correct voxels for varying blood volume and tissue fractions using the central volume principle.
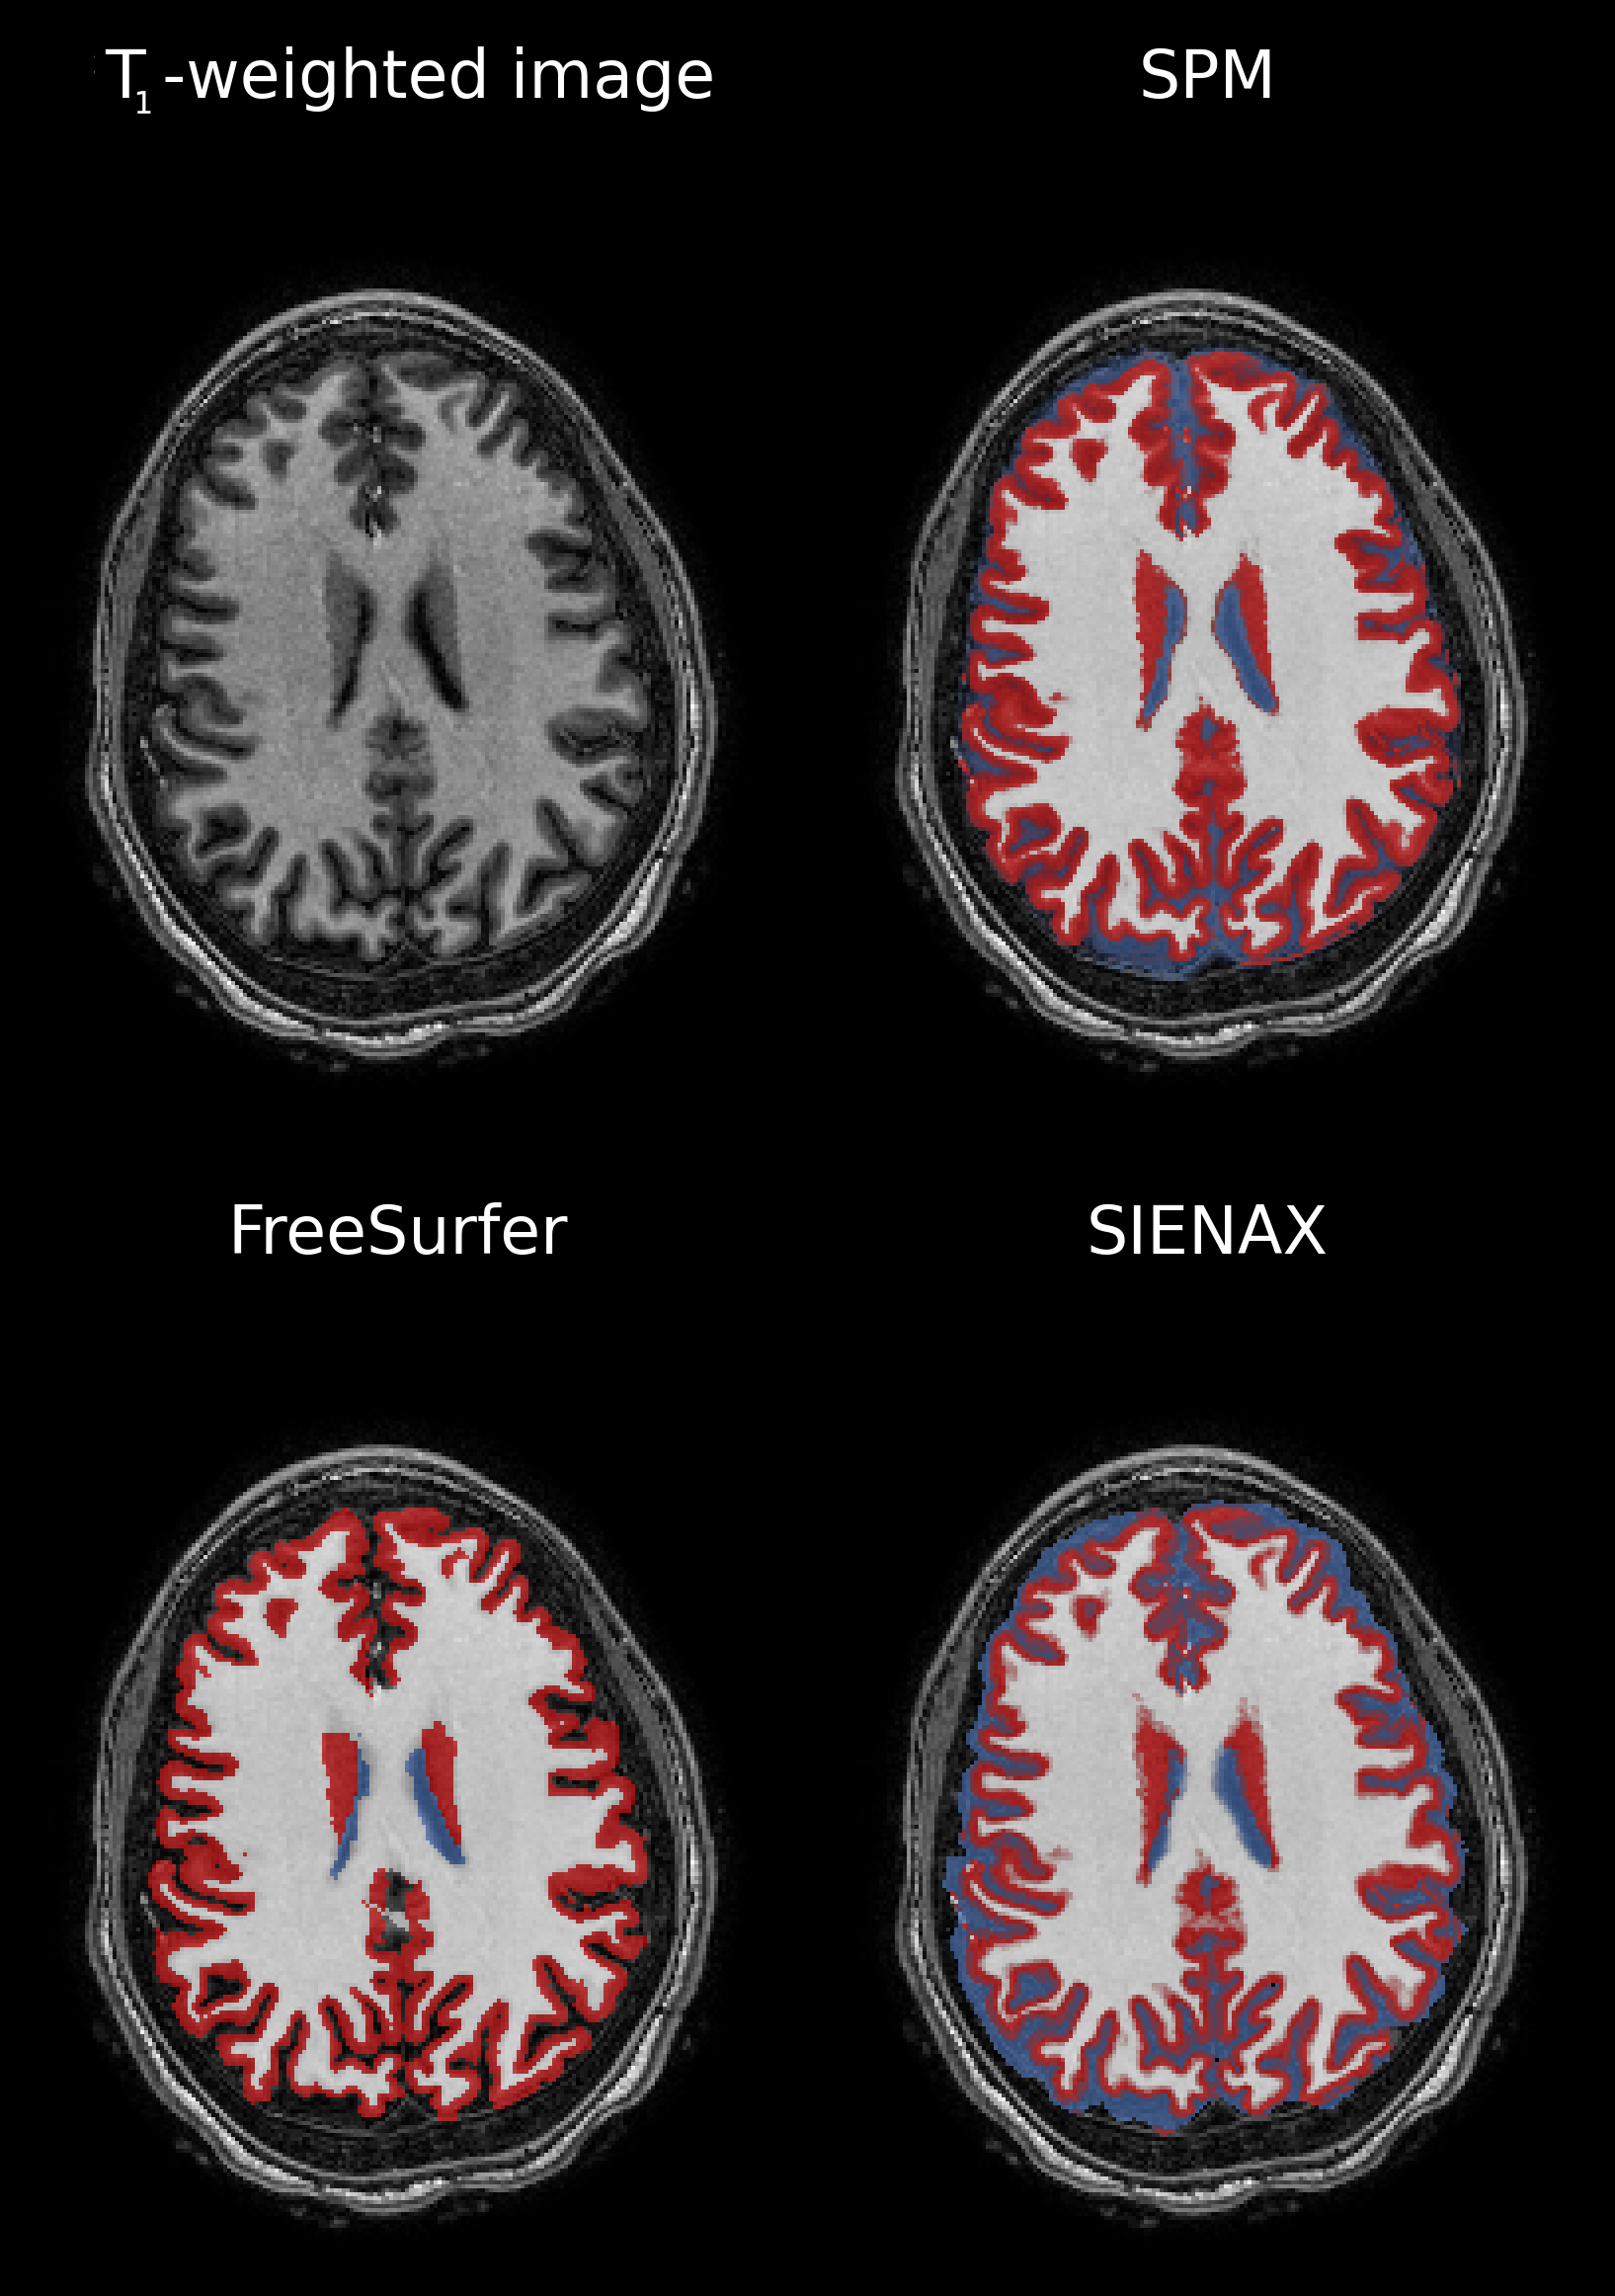
Segmentations were created using SIENAX (from FSL v6.0), SPM v12 and FreeSurfer v7.1.1. Visualizations of segmentations are given in Figure 1. Multivariate linear regression evaluated relationships between tissue volume and disease state (SCD versus HC) and CaO2 for each program. Significance: two-sided p<0.05. GMV and WMV were dependent variables, and independent variables were evaluated in separate regression sets. Regression set 1 evaluated SCD vs volume. Covariates include age, sex, disease state, head size. Regression set 2 evaluated CaO2 vs volume. Covariates include age, sex, CaO2, head size. Regression set 3 evaluated SCI count vs volume, using only SCD participants. Covariates include age, sex, SCI count, head size. One regression per set used (i) GMV or (ii) WMV as dependent variables.
Results
Of 150 participants, 97 had SCD (age=18.5±9.0 years, 53% female) and 53 were HCs (age= 24.2±8.5 years, 55% female). SCIs were present in 33/97 (34%) of SCD participants.In Regression set 1, SCD was associated with reduced GMV and WMV using FreeSurfer (p<0.001). SCD did not predict brain volume with SPM or SIENAX. In Regression set 2, CaO2 was associated with reduced GMV and WMV using FreeSurfer (p<0.001). CaO2 did not predict brain volume using SPM. Using SIENAX, CaO2 predicted WMV (p=0.035) but not GMV. In Regression set 3, SCI count was not a predictor for brain volume regardless of software.
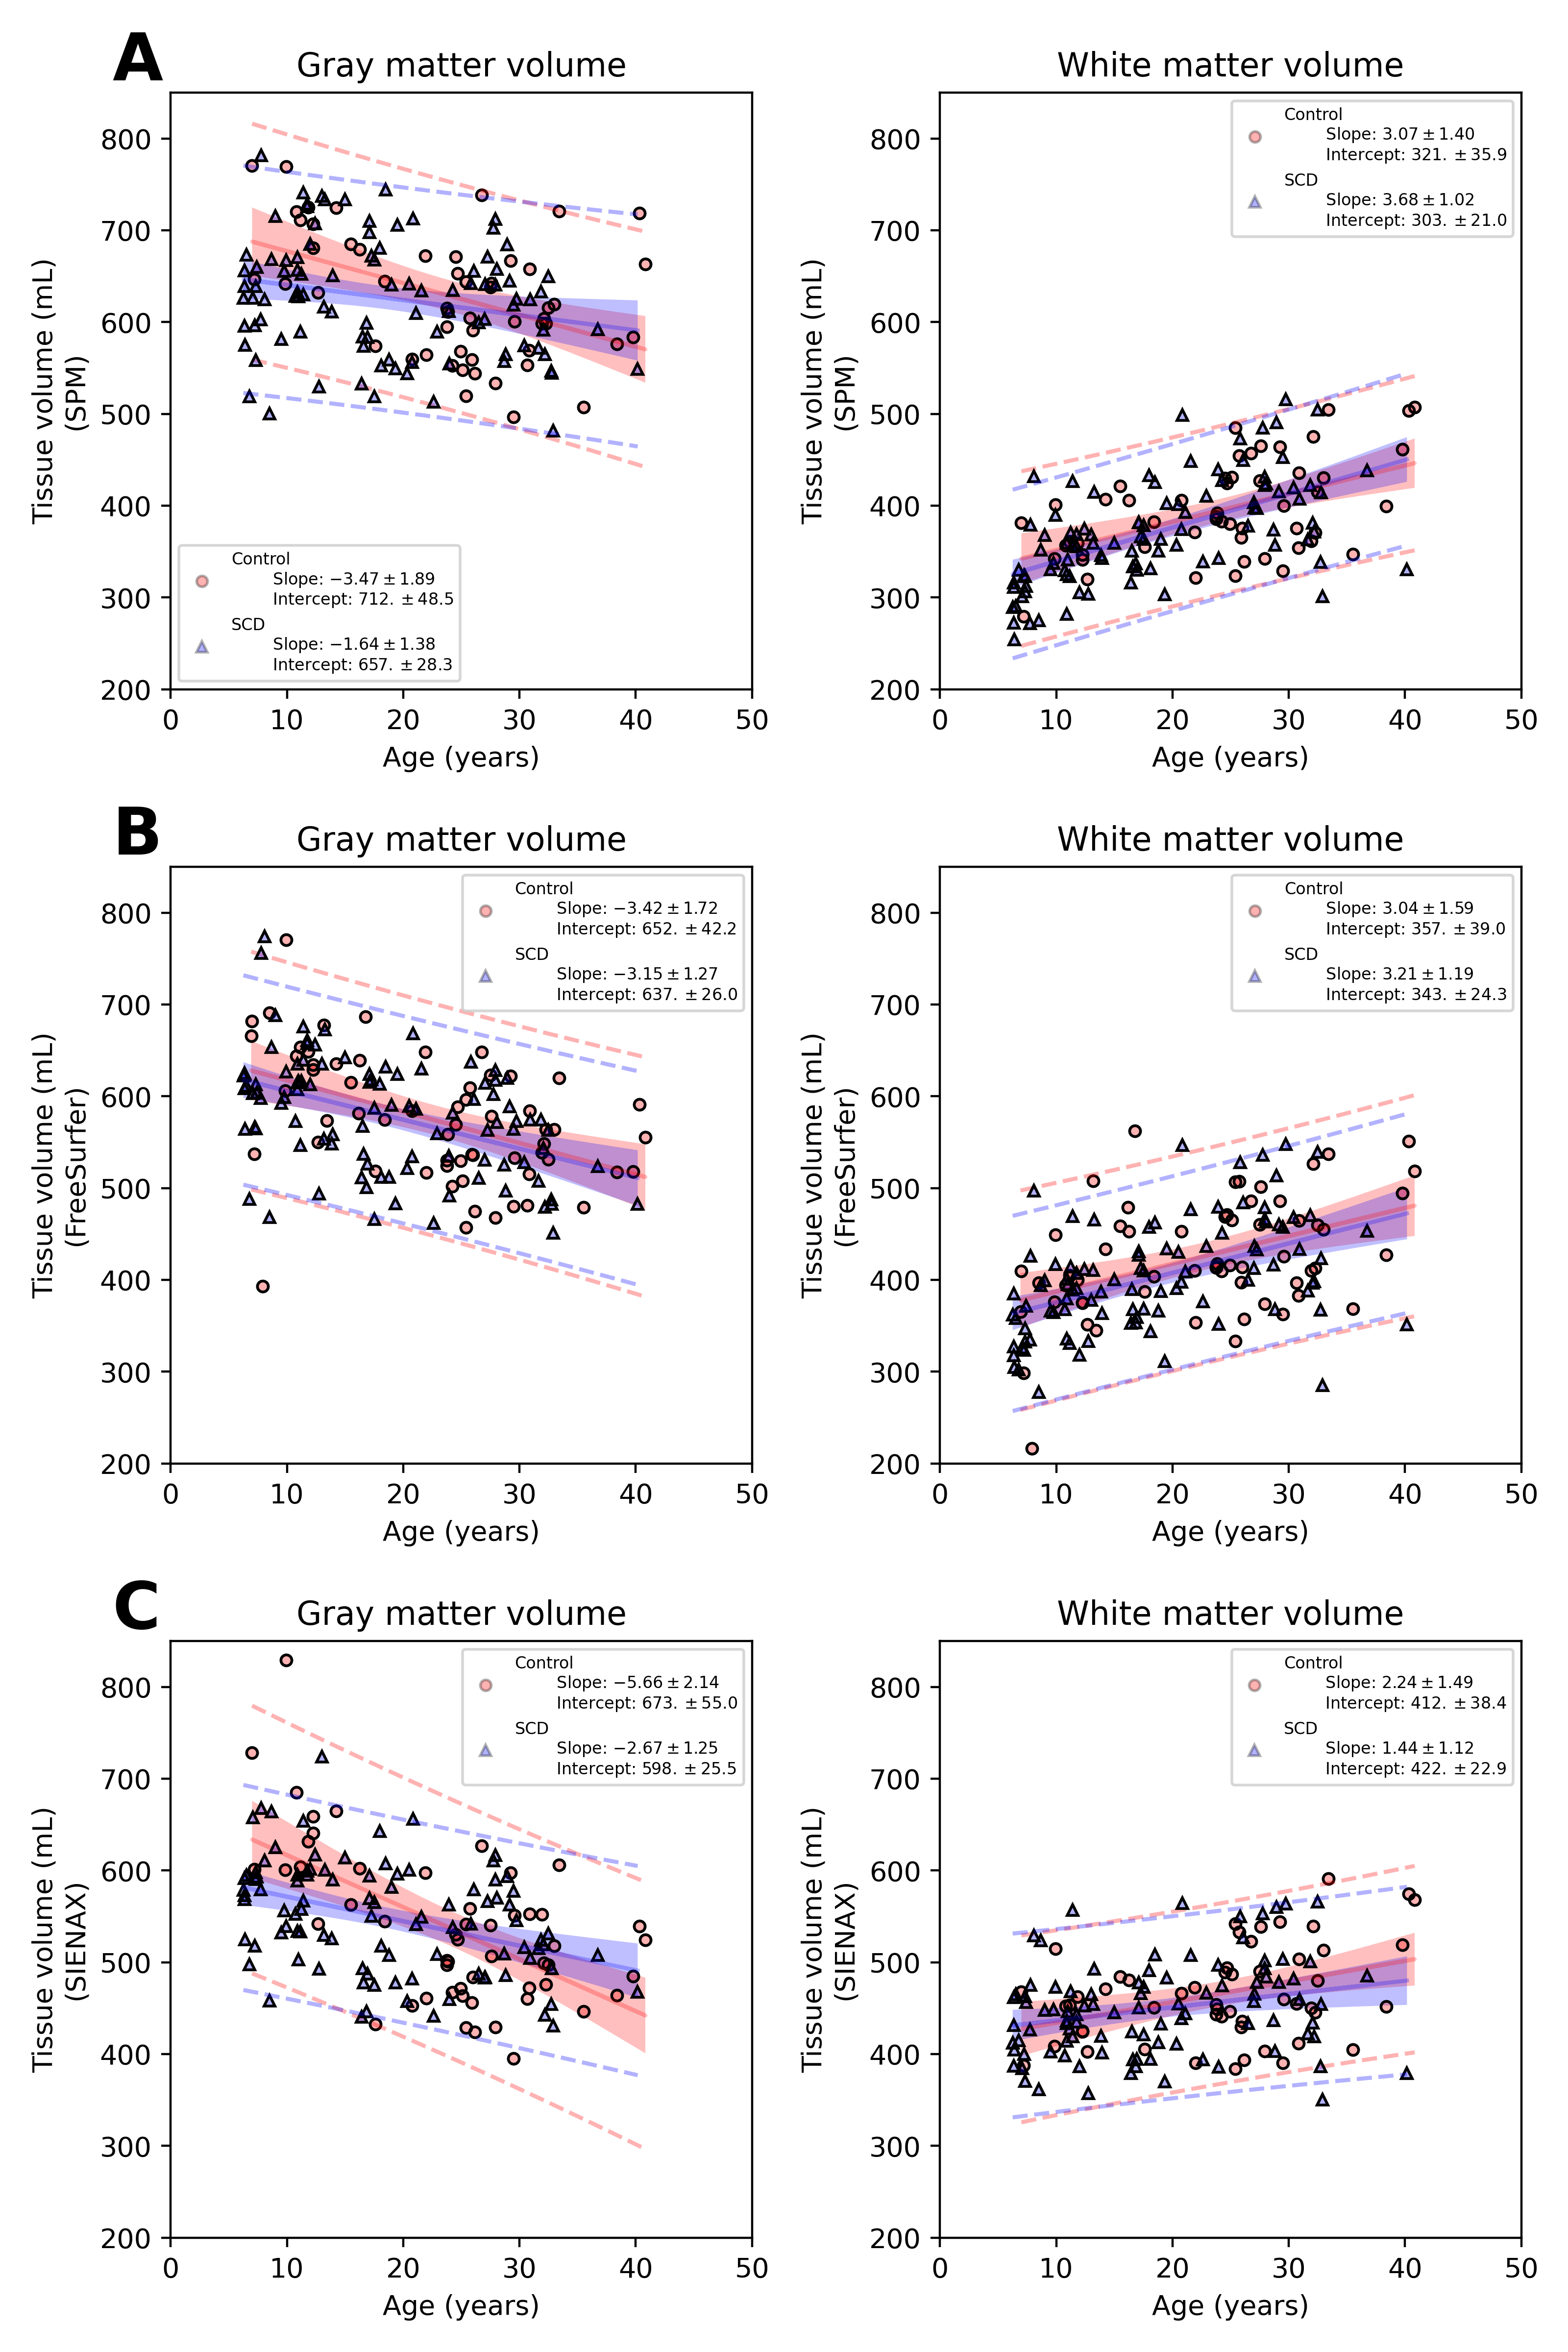
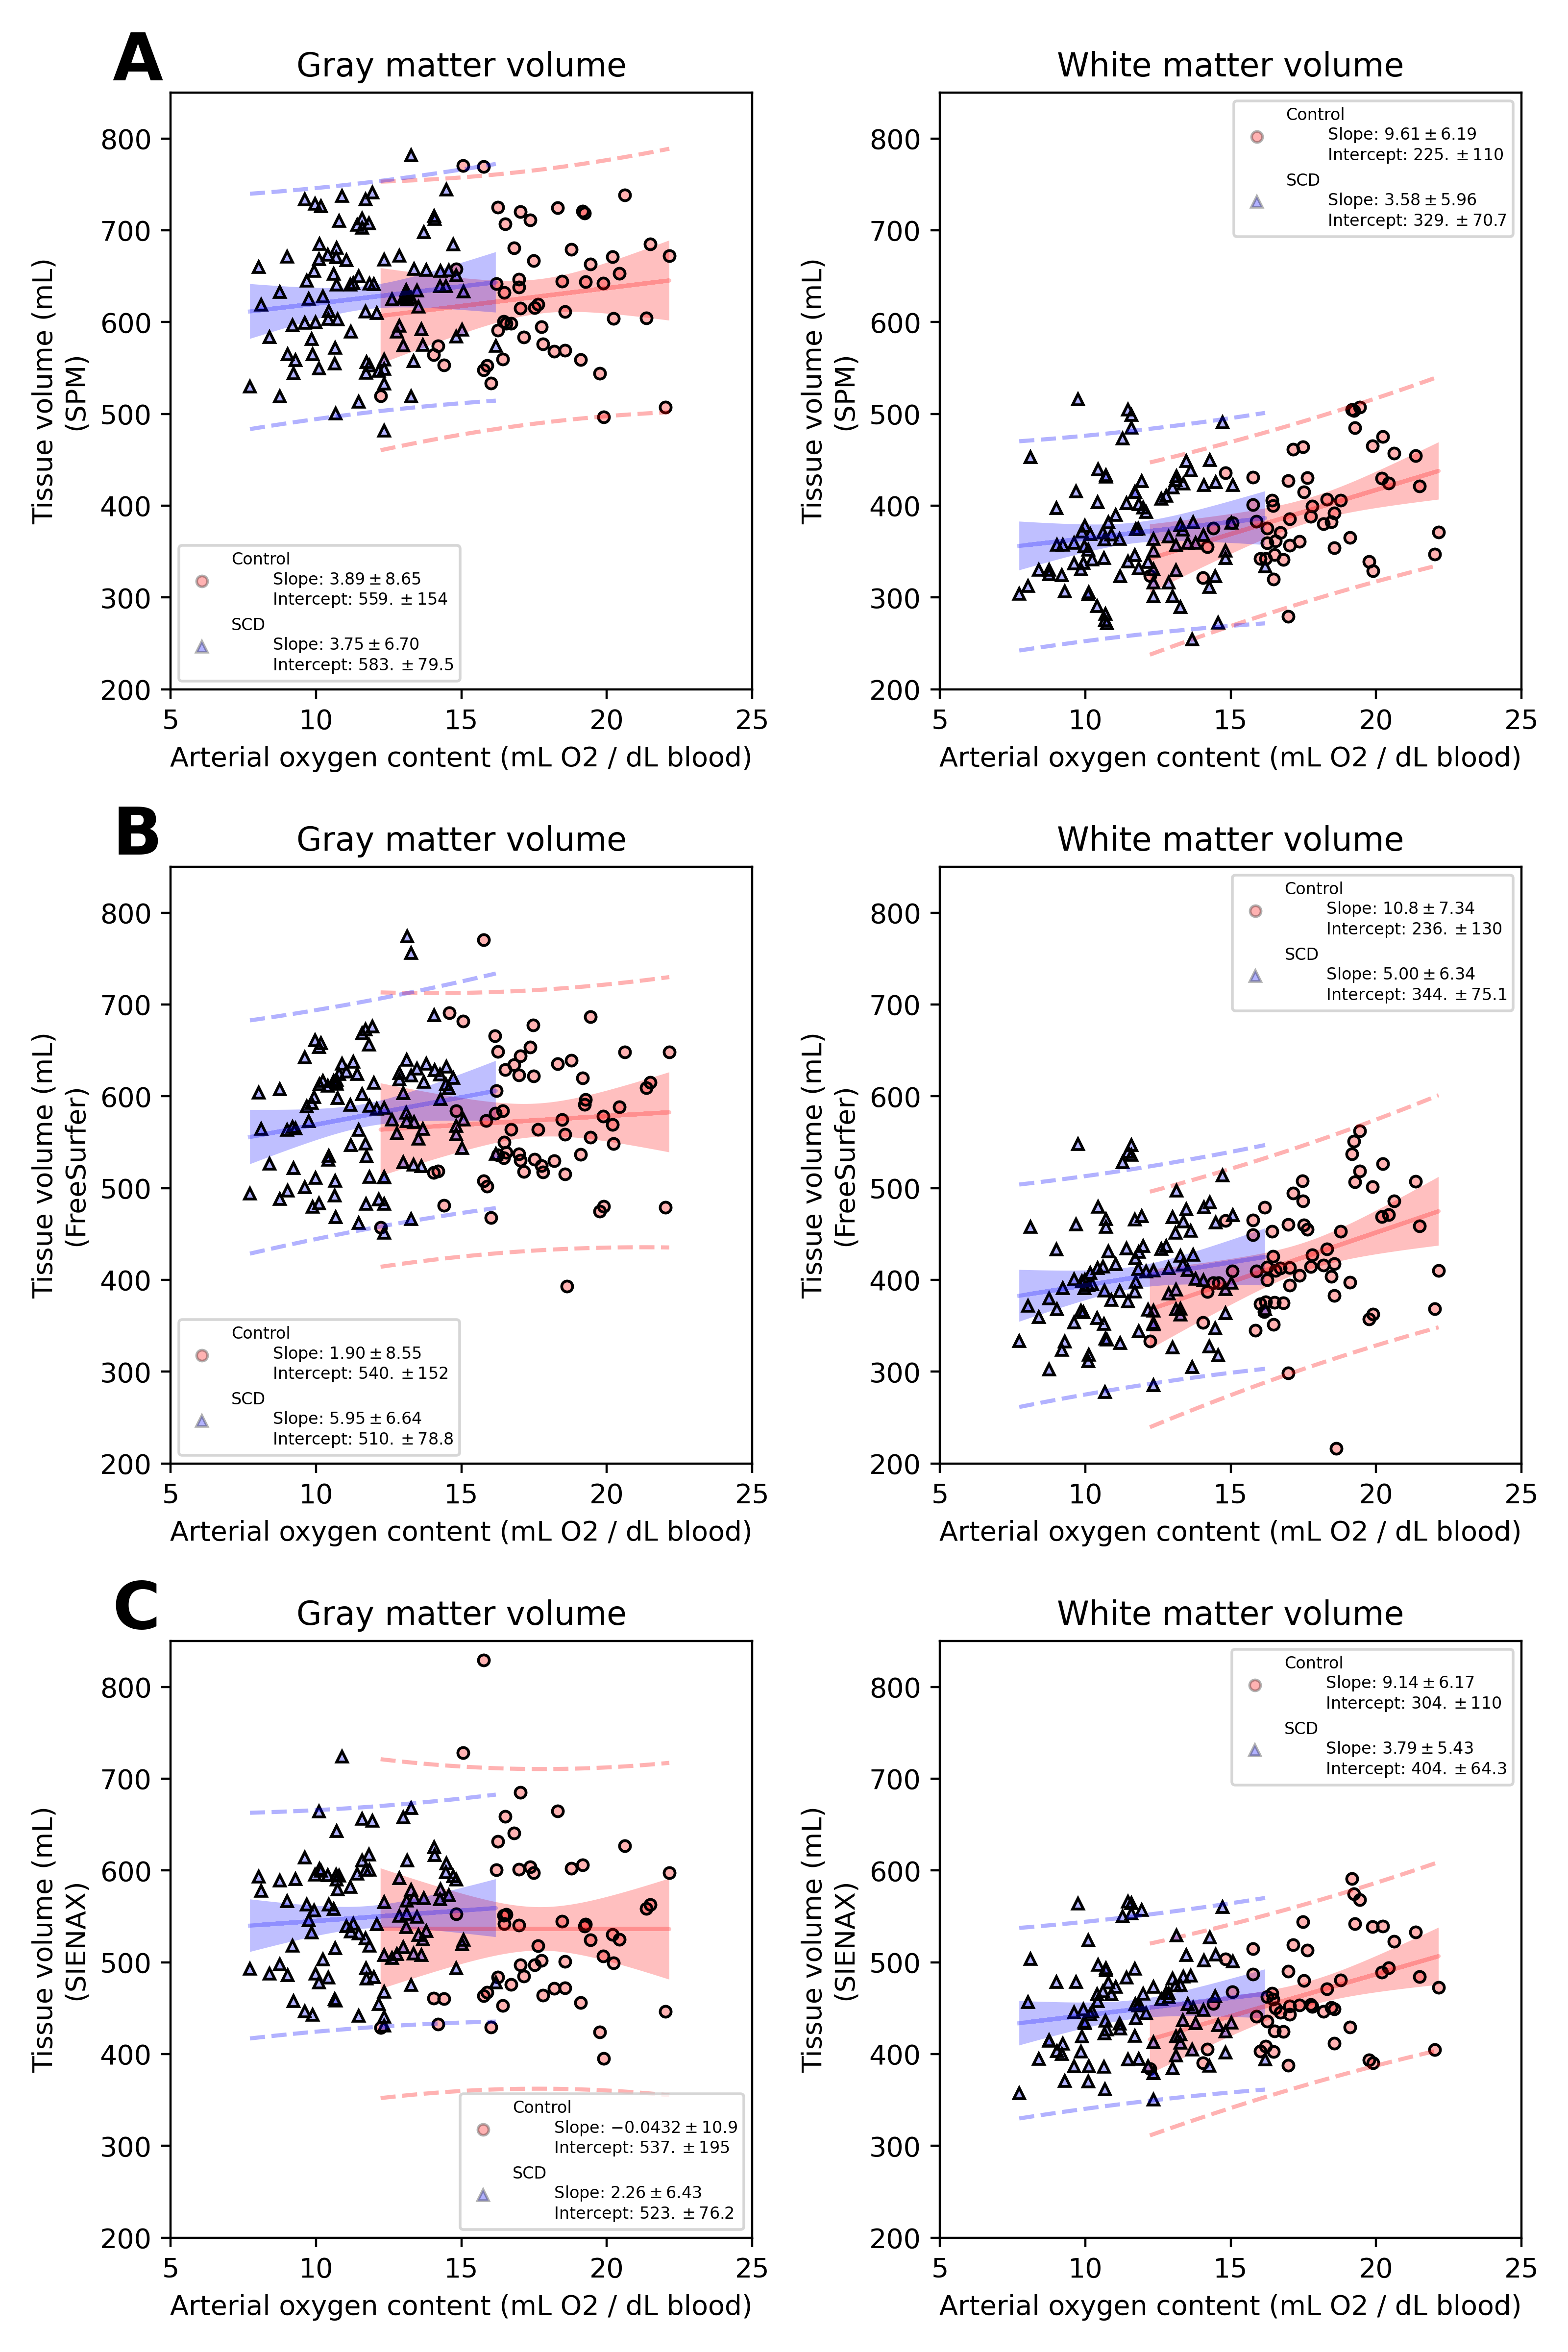
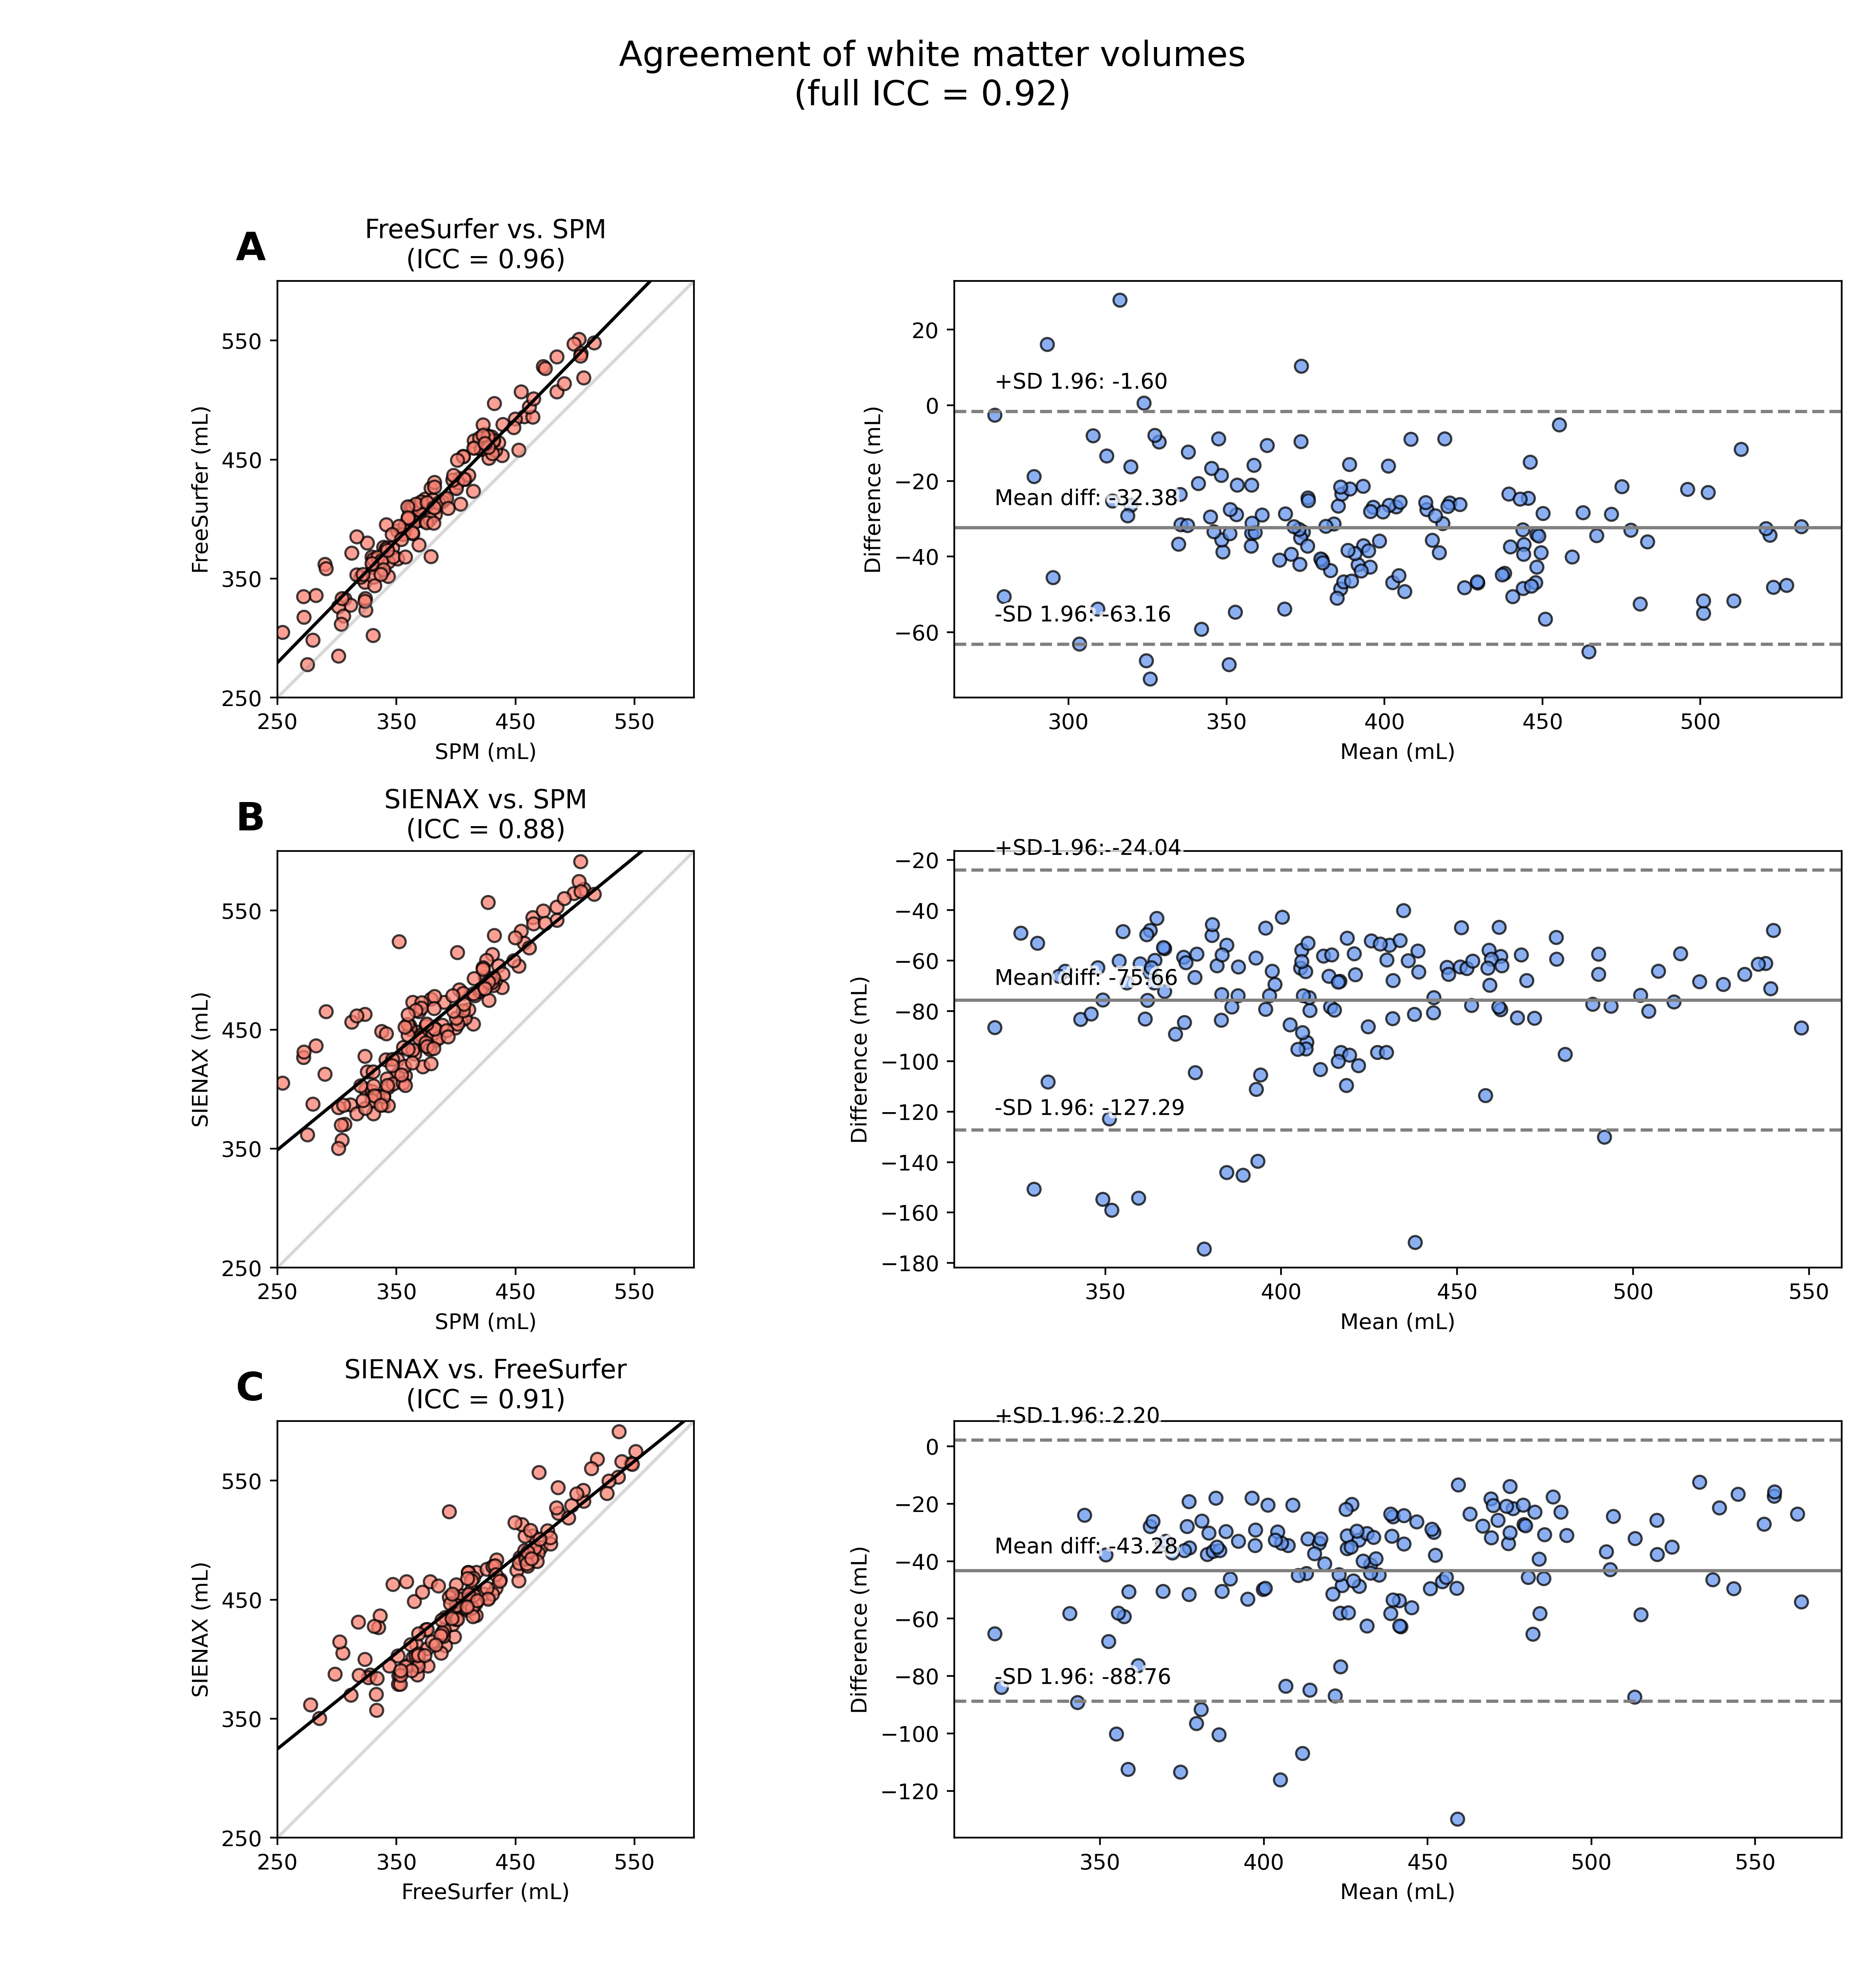
Figures 2-3 summarize correlations between tissue volume and age or CaO2, respectively. Figures 4-5 summarize inter-rater agreement of segmented tissue volumes between the programs; the ICCs between the software evaluated were 0.92 and 0.85 for WMV and GMV, respectively.
Discussion
Results emphasize the effect of segmentation software on brain volume calculations in persons with SCD. Cerebral volume is frequently quantified in older adults with neurodegenerative disorders, where variations in tissue volumes may be large. These findings suggest that in persons with SCD, where volume variation is more subtle, findings are sensitive to software. Only FreeSurfer yielded case-control differences, despite high overall ICC for measures of volume between programs. Regression set 3 suggests tissue atrophy and SCIs in SCD are mediated by different mechanisms, which highlights the additional relevance of functional indicators of hemodynamic compensation in SCD5,9,12. Novel correction of CBV in this study using ASL imagery may also prove important in future studies comparing populations with differing basal vasodilatory tone.Conclusion
Findings highlight the subtlety of tissue volume changes in SCD, provide age-specific reference-standards, and motivate an integrated approach of anatomical and functional assessments for informing SCD care.Acknowledgements
No acknowledgement found.References
[1]F. Piel, M. Steinberg and D. Rees, "Sickle Cell Disease," New England Journal of Medicine, vol. 376, no. 16, pp. 1561-1573, 2017.
[2]A. Kassim, S. Pruthi, M. Day, M. Rodeghier, M. Gindville, M. Brodsky, M. Debaun and L. Jordan, "Silent cerebral infarcts and cerebral aneurysms are prevalent in adults with sickle cell anemia," Blood, vol. 127, no. 16, pp. 2038-2040, 2016.
[3]F. Bernaudin, S. Verlhac, C. Arnaud, A. Kamdem, S. Chevret, I. Hau, L. Coïc, E. Leveillé, E. Lemarchand, E. Lesprit, I. Abadie, N. Medejel, F. Madhi, S. Lemerle and C. Delacourt, "Impact of early transcranial Doppler screening and intensive therapy on cerebral vasculopathy outcome in a newborn sickle cell anemia cohort," Blood, vol. 117, no. 4, pp. 1130-1140, 2011.
[4]R. L. Sacco, S. E. Kasner, J. P. Broderick, L. R. Caplan, J. (. Connors, A. Culebras, M. S. Elkind, M. G. George, A. D. Hamdan, R. T. Higashida, B. L. Hoh, A. L. Valderrama and H. V. Vinters, "An Updated Definition of Stroke for the 21st Century," Stroke, vol. 44, no. 7, pp. 2064-89, 2013.
[5]A. Ford, D. Ragan, S. Fellah, M. Binkley, M. Fields, K. Guilliams, H. An, L. Jordan, R. McKinstry, J.-M. Lee and M. DeBaun, "Silent infarcts in sickle cell disease occur in the border zone region and are associated with low cerebral blood flow," Blood, vol. 132, no. 16, pp. 1714-1723, 2018.
[6]L. Afzali-Hashemi, K. Baas, A. Schrantee, B. Coolen, M. v. Osch, S. Spann, E. Nur, J. Wood, B. Biemond and A. Nederveen, "Impairment of Cerebrovascular Hemodynamics in Patients With Severe and Milder Forms of Sickle Cell Disease," Frontiers in Physiology, vol. 12, 2021.
[7]R. G. Steen, T. Emudianughe, M. Hunte, J. Glass, S. Wu, X. Xiong and W. E. Reddick, "Brain Volume in Pediatric Patients with Sickle Cell Disease: Evidence of Volumetric Growth Delay?," American Journal of Neuroradiology, vol. 26, no. 3, pp. 455-62, 2005.
[8]S. Choi, S. H. O’Neil, A. A. Joshi, J. Li, A. M. Bush, T. D. Coates, R. M. Leahy and J. C. Wood, "Anemia predicts lower white matter volume and cognitive performance in sickle and non-sickle cell anemia syndrome," American Journal of Hematology, vol. 94, no. 10, pp. 1055-1065, 2020.
[9]L. Jordan, M. Gindville, A. Scott, M. Juttukonda, M. Strother, A. Kassim, S.-C. Chen, H. Lu, S. Pruthi, Y. Shyr and M. Donahue, "Non-invasive imaging of oxygen extraction fraction in adults with sickle cell anaemia," Brain, vol. 139, no. 3, pp. 738-750, 2016.
[10]K. N. Mayer, B. Latal, W. Knirsch, I. Scheer, M. v. Rhein, B. Reich, J. Bauer, K. Gummel, N. Roberts and R. O. Tuura, "Comparison of automated brain volumetry methods with stereology in children aged 2 to 3 years," Neuroradiology, vol. 58, pp. 901-910, 2016.
[11]I. Fellhauer, F. G. Zöllner, J. Schröder, C. Degen, L. Kong, M. Essig, P. A. Thomann and L. R. Schad, "Comparison of automated brain segmentation using a brain phantomand patients with early Alzheimer's dementia or mild cognitiveimpairment," Psychiatry Research: Neuroimaging, vol. 233, pp. 299-305, 2015.
[12]W. Li, X. Xu, P. Liu, J. Strouse, J. Casella, H. Lu, P. v. Zijl and Q. Qin, "Quantification of whole-brain oxygenation extraction fraction and cerebral metabolic rate of oxygen consumption in adults with sickle cell anemia using individual T 2 -based oxygenation calibrations," Magnetic Resonance in Medicine, vol. 83, no. 3, pp. 1066-1080, 2020.
Figures