2638
Microstructural changes in the grey matter of patients with visual snow syndrome: an ultra-high field morphological and quantitative MRI study
Myrte Strik1, Meaghan Clough2, Emma J Solly2, Owen B White2, Scott C Kolbe2, and Joanne Fielding2
1Department of Radiology, University of Melbourne, Melbourne, Australia, 2Department of Neuroscience, Monash University, Melbourne, Australia
1Department of Radiology, University of Melbourne, Melbourne, Australia, 2Department of Neuroscience, Monash University, Melbourne, Australia
Synopsis
Visual snow syndrome (VSS) is a neurological disorder characterized by continuous visual disturbances, and accompanied by a range of non-visual symptoms, including tinnitus and migraine. Little is known about the pathological mechanisms underlying VSS. In this study we assessed brain morphometry and microstructure in VSS patients using high-resolution structural (MP2RAGE, 0.75 mm iso) and quantitative (T1 mapping) 7T MRI. In VSS patients, we observed similar morphometry, but widespread changes in the grey matter microstructure (lower T1 values), which followed a caudal-rostral pattern affecting the occipital cortices most profoundly. Migraine did not appear to independently affect these changes.
Introduction
Visual snow syndrome (VSS) is a neurological condition characterized by continuous and dynamic visual disturbance across the entire visual field and a range of non-visual symptoms, including migraine. Little is known about the pathological mechanisms underlying VSS. Here we assessed brain morphometry and microstructure in VSS patients using high-resolution structural and quantitative 7 Tesla MRI.Methods
Forty patients with VSS (22 with migraine) and 43 healthy controls underwent 7T MRI using a whole-body Siemens MAGNETOM 7 Tesla MRI system (Siemens Healthcare, Erlangen, Germany) with a combined single-channel transmit and 32-channel receive head coil (Nova Medical, Wilmington, MA, USA). High-resolution anatomical imaging was acquired using a 3-dimensional T1-weighted sequence (MP2RAGE) with the following imaging parameters: repetition time = 5000 ms, echo time = 3.06 ms, inversion time = 700/2700 ms, flip angle = 4 / 5 degrees, 224 slices, Acceleration Factor = 4, phase encoding direction = anterior-to-posterior, voxel size = 0.75 mm isotropic, image matrix = 330 × 330]. From the MP2RAGE a denoised uniform T1 weighted image and T1 map were derived for volumetric and T1 measurements respectively (Figure 1). Cortical and subcortical regions were segmented using FreeSurfer (version 6.0-patch, https://surfer.nmr.mgh.harvard.edu/). For each participant and each ROI, volumes were derived from the FreeSurfer statistical output (asag.stats or lh/rh.aparc.stats) and T1 values were extracted using a customized MATLAB R2019b (Mathworks, Natick, MA, USA) script.Volumetric and quantitative T1 values were compared between controls and VSS patients. For those regions where significant differences were found (false discovery rate [FDR] corrected for multiple comparisons) further comparisons were made between VSS patients with and without migraine. For VSS patients significant MRI metrics were correlated with clinical variables (number of VSS symptoms, self-rated VSS intensity, perceived disruptiveness of VSS, fatigue, and quality of life) as well as ratings of psychiatric symptoms previously shown to be prevalent in VSS including depression, anxiety, and depersonalisation. Lastly, cortical regions, cortical layers and individual thalamic nuclei were studied.
Results
Compared to controls, VSS patients demonstrated an overall trend towards larger brain and white matter volumes (pFDR>0.05) and significantly lower T1 values for the entire cortex (p<0.001), thalamus (p=0.001) and pallidum (p=0.001) (Figure 2). T1 changes were most evident in caudal regions (occipital cortices) followed by parietal, temporal, and prefrontal cortices (Figure 3). No T1 differences were found in the precentral gyri. In regions of significance difference, no differences were revealed between VSS patients with and without migraine. For the VSS group overall, thalamic T1 correlated with number of VSS symptoms (p=0.019, r=0.390) and perceived disruptiveness of VSS (p=0.010, r=0.424) (pFDR>0.05). T1 values differed between VSS patients and controls for most thalamic nuclei (pFDR<0.05) (Figure 3) and cortical layers (Figure 4).Conclusion
In patients with VSS we observed no changes in morphometry, but widespread changes in grey matter microstructure which followed a caudal-rostral pattern affecting the occipital cortices most profoundly. Migraine did not appear to independently affect these changes. Lower T1 values may potentially result from higher neurite density, myelination, or increased iron levels in the VSS brain. Further investigation of these changes may enhance our understanding of the pathogenesis of VSS, ultimately leading to new treatment strategies.Acknowledgements
The authors acknowledge the facilities, scientific and technical assistance from the National Imaging Facility, a National Collaborative Research Infrastructure Strategy capability, at the Melbourne Brain Centre Imaging Unit, The University of Melbourne. The authors would like to thank Professor Carsten Murawski and Mr Juan Pablo Franco from the Brain, Mind and Markets Laboratory at the University of Melbourne for contributing healthy control data for this study. This work was supported by the MASSIVE HPC facility (www.massive.org.au).References
No reference found.Figures
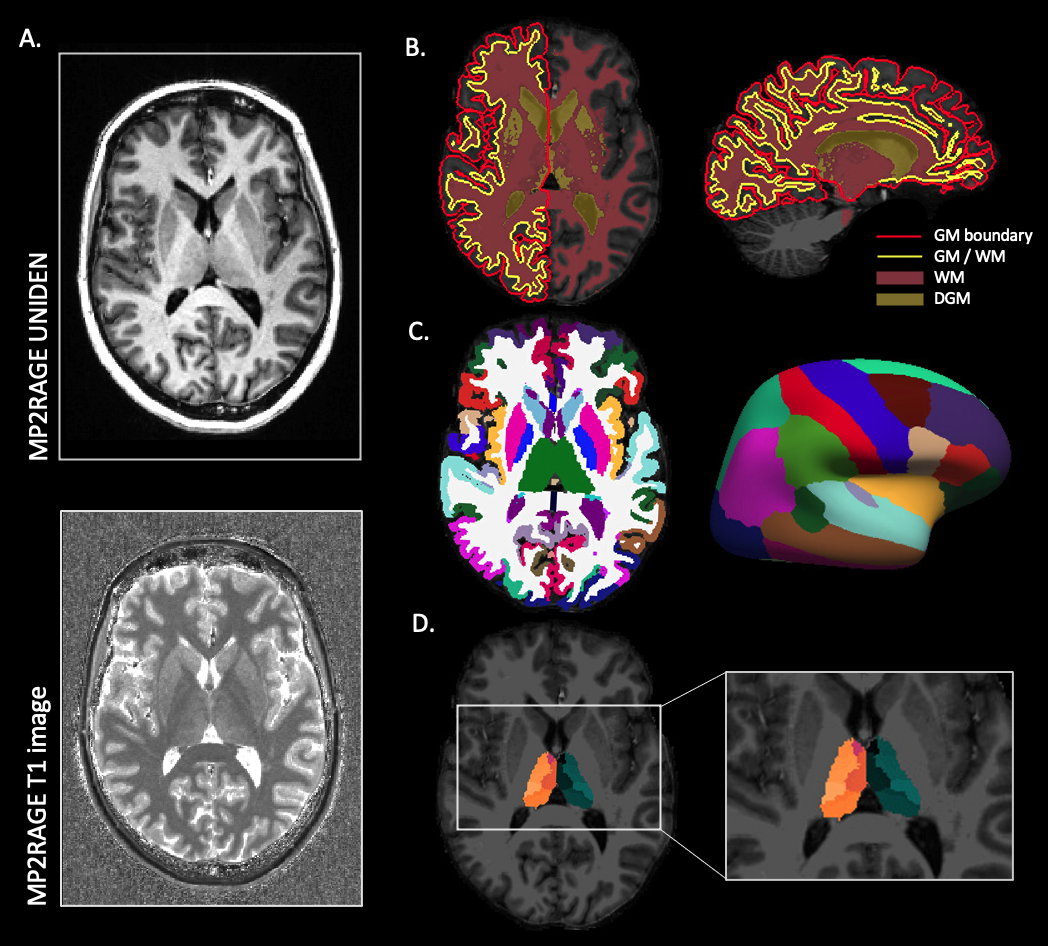
Figure 1. Anatomical processing pipeline. A) From the MP2RAGE image a uniform denoised image (UNIDEN) and T1 map were acquired. B) The UNIDEN image was used for segmentation of cortical grey matter (GM), deep grey matter (DGM), white matter (WM), as well as parcellations of C) cortical and subcortical regions and D) thalamic nuclei. From these (sub)cortical parcellations volumetrics were calculated and T1 values were extracted.
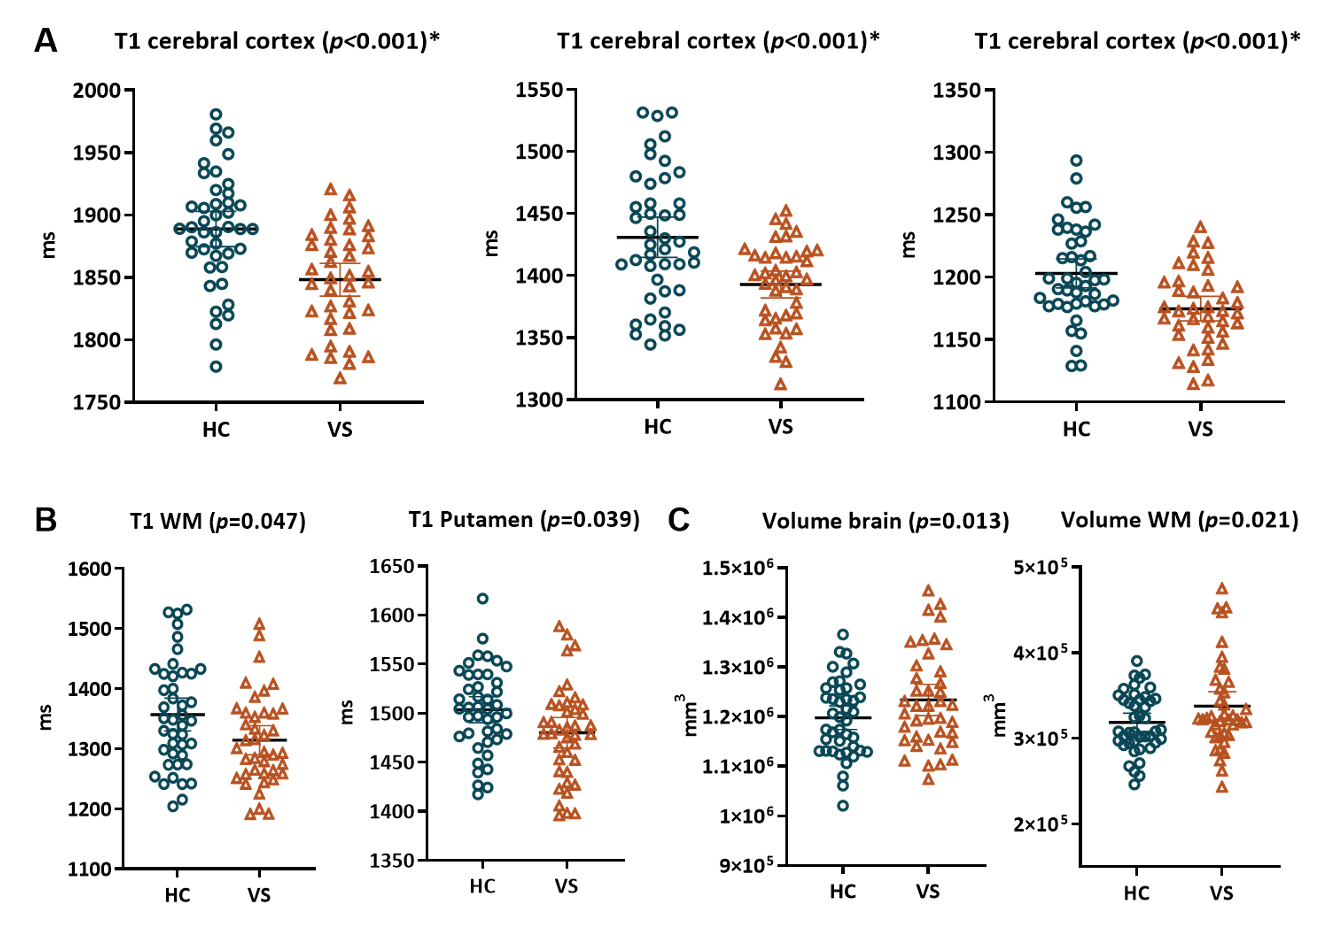
Figure 2. Brain volumetrics and quantitative T1 value differences between controls and VSS patients. A) VSS patients demonstrated significantly lower T1 values for the entire cerebral cortex, thalamus, and pallidum (pFDR < 0.05), compared to controls. B) Shorter white matter (WM) and putamen T1 values and C) larger brain and WM volumes were found, but these comparisons did not survive multiple comparison corrections.
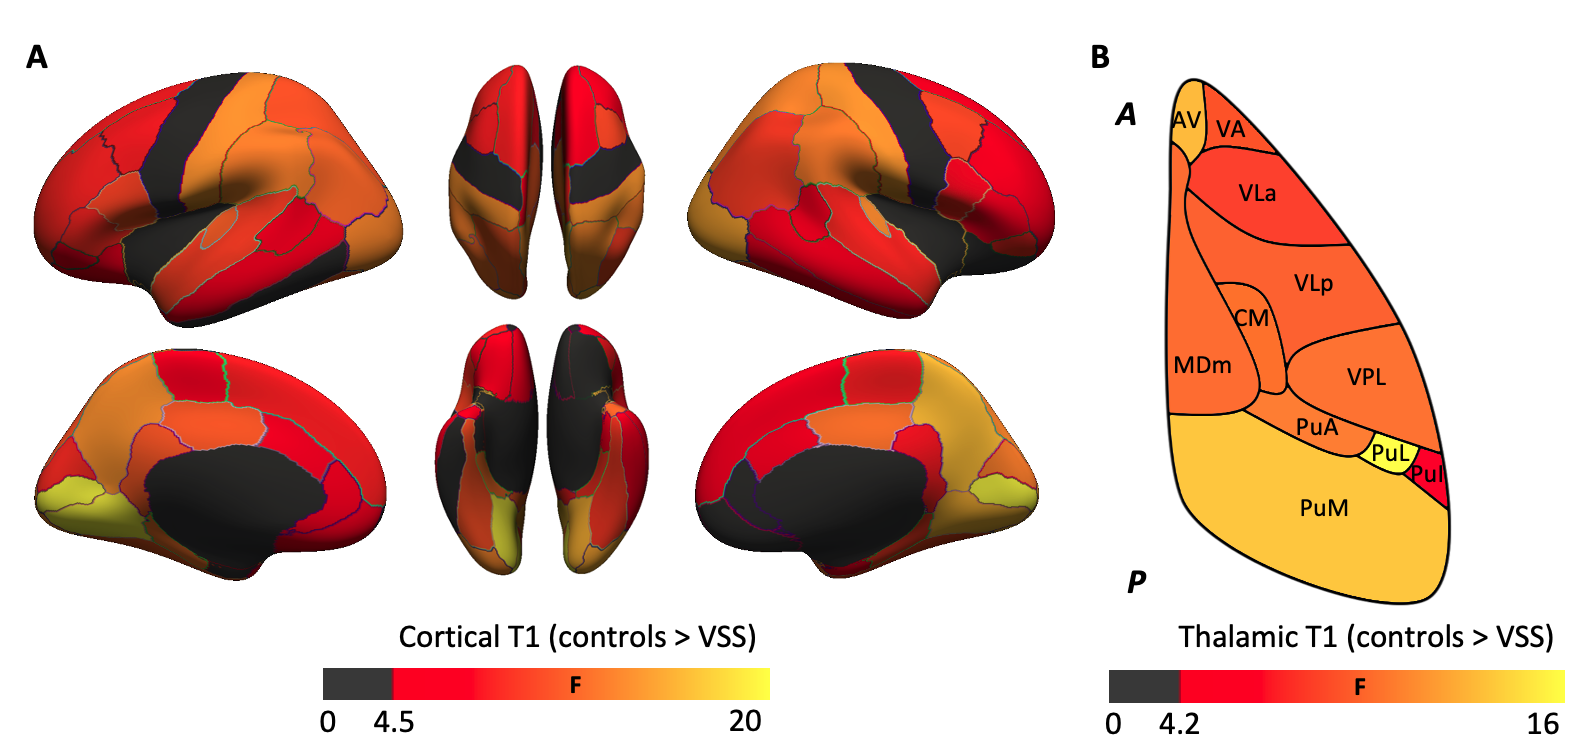
Figure 3. VSS patients displayed reduced T1 values in most cortical and thalamic regions. A) A notable caudal to rostral gradient was observed in the strength of effect with occipital regions showed the greatest difference, followed by parietal, temporal, and prefrontal cortices. B) Although less striking compared to cortex, the thalamus also displayed a caudal (posterior (P)) to rostral (anterior (A)) effect size gradient with strongest effect in lateral pulvinar (PuL).
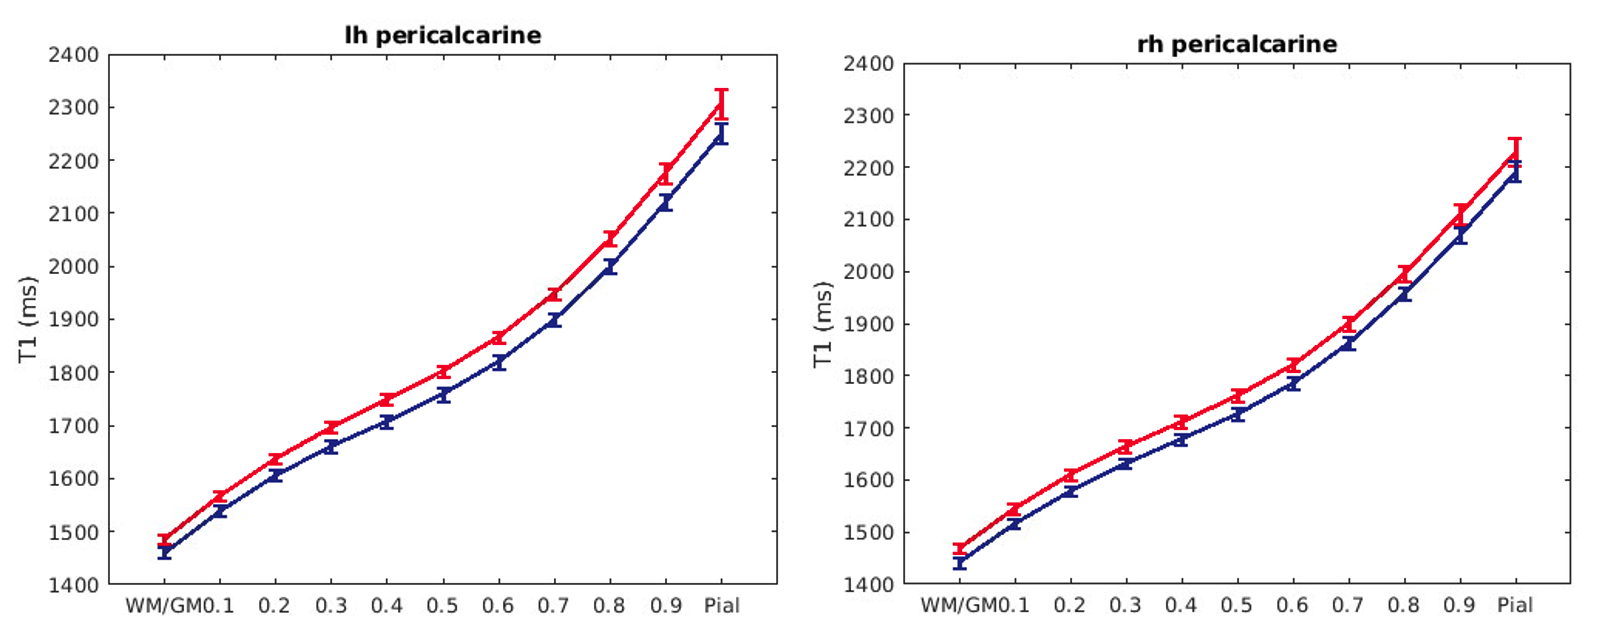
Figure 4. T1 values in the cortical layers. These plots visualize T1 values (mean +/- CI) for multiple layers in the pericalcarine cortex in the left (lh) and right (rh) hemisphere for controls (in red) and VSS patients (in blue). Compared to controls, T1 values are shorter in VSS patients across the cortical layers.
DOI: https://doi.org/10.58530/2022/2638