2626
Comparison of Gradient Induced Peak E-fields on Simplified and Realistic Body Models
Koray Ertan1,2, Paolo Decuzzi2, Peter B Roemer3, and Brian Rutt1
1Department of Radiology, Stanford University, Stanford, CA, United States, 2Laboratory of Nanotechnology for Precision Medicine, Italian Institute of Technology, Genoa, Italy, 3Roemer Consulting, Lutz, FL, United States
1Department of Radiology, Stanford University, Stanford, CA, United States, 2Laboratory of Nanotechnology for Precision Medicine, Italian Institute of Technology, Genoa, Italy, 3Roemer Consulting, Lutz, FL, United States
Synopsis
Either peak E-fields on simple geometries with uniform interior properties as suggested by IEC or coupled E-field and neurodynamic simulations on realistic body models can be employed in PNS optimal gradient coil design. Magneto quasi-static simulations were performed to compare the magnitude and location of the peak E-fields in uniform interior body models with smoothed or realistic surface features to fully heterogeneous Virtual Family models. Although peak E-fields are higher on the heterogeneous body models due to complex tissue interfaces, simplified and/or homogeneous models represent a more practical and robust approach predicting population-wide PNS performance.
Introduction
Peripheral nerve stimulation (PNS) limits all modern gradient systems. One PNS-mitigating approach is to reduce the imaging region size, as for example with head gradient coils. Additionally, PNS thresholds depend on body dimensions, location and orientation, tissue and nerve distributions. There are two main approaches for predicting PNS thresholds at the design stage. Firstly, the IEC 60601-2-33 safety standard outlines the use of E-field calculations for predicting PNS thresholds1. We introduced a computationally efficient method for calculating E-fields on simplified uniform body models2,3 and showed that peak surface E-fields averaged over a large population of models predict the experimentally measured population-mean PNS threshold parameters to within ~20%. This method has been successfully and efficiently employed to design minimum electric-field gradient coils that should increase population-mean PNS thresholds substantially4. Alternatively, E-field simulations coupled with neurodynamic simulations on a very small number of realistic models have been employed to design gradient coils with improved PNS performance5,6. In the present work, our aim was to understand the link between these two methods by evaluating E-fields in both simplified and complex realistic models. E-field simulations were performed to examine the magnitude and location of the peak E-fields in uniform-interior body models with either simplified/smooth or realistic surface features, compared to fully realistic heterogeneous-interior body models (Virtual Family7).Methods
Biot-Savart simulations were performed to calculate the magnetic field profiles of a prototype head gradient coil (H3) for each of X-Y-Z axes. E-fields induced by the gradient coil were simulated using a magneto-quasistatic solver in Sim4Life (ZMT MedTech AG, Zurich). E-field simulations were performed on five realistic VF models (Duke, Ella, Yoonsun, Jeduk and Glenn)7. Simulations were performed for these realistic models with fully heterogeneous tissue distributions (heterogeneous), and for the same model shapes with uniform interior electrical properties (homogeneous). E-field simulations were also performed for simplified/smooth-featured models with uniform interiors; geometrical details of these simplified models are provided in Fig.12. The geometrical parameters of the simplified models were adjusted for best-fit to each VF model; this allowed for more controlled comparison of E-fields. E-fields on the surface of various tissue types such as skin, subcutaneous adipose tissue (sat), bone, muscle, fat, nerve were extracted while internal-air voxels was filtered out. All simulations are performed with 1.5 mm resolution.Results
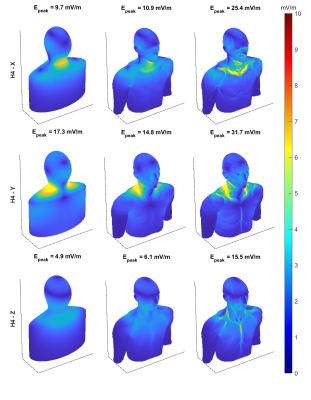
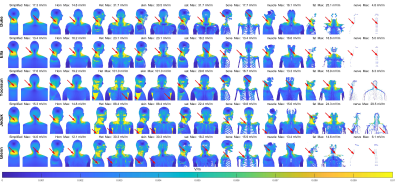
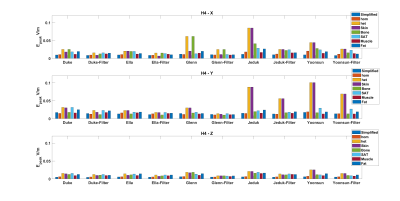
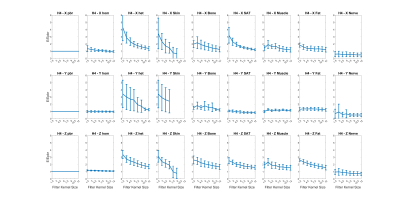
Fig.2 shows the E-field distributions induced by the H3 head gradient coil on simplified, homogeneous and heterogeneous Duke model for all three axes. Peak-E fields are highest for y-axis and lowest for z-axis, which matches expectations based on PNS measurements. Furthermore, the heterogeneous model has higher peak E-field than simplified and homogeneous models for all gradient axes. Fig.3 shows A/P and R/L maximum intensity projections for E-fields induced by the H3-Y coil for all models, for simplified, homogeneous, heterogeneous models, with the latter separately shown for specific tissue types. Locations of spatial peak E-fields are marked with red arrows. It can be observed that E-field spatial distributions and locations of E-field peaks are similar for simplified, homogeneous and heterogeneous models, with some exceptions involving the armpit areas of Yoonsun, Jeduk and Glenn; higher spatial resolution in such areas may be required to avoid these outliers / errors. Additionally, spatial distributions of E-fields on tissues with relatively larger volume such as sat, fat and muscle are similar to the simplified and homogeneous models for all five models. Fig.4 shows the peak E-fields on simplified, homogeneous, heterogeneous as well as different tissues for both original and spatially smoothed E-fields. It can be seen that peak E-fields are dramatically higher in the skin tissues of Yoonsun and Jeduk; this is explained by the five times higher spatial resolution of these two compared to the other models. Fig.5 provides the average ratio of peak E-fields on homogeneous and heterogeneous models to simplified models, showing that the amplitude of peak E-fields on homogeneous models are very similar to those on simplified models for all axes. In general, as the kernel size of the spatial low-pass filter is increased, the ratio of peak E-field on the heterogeneous models to peak E-field on simplified model decreases toward unity. Lastly, the highest variation in peak E-field ratio across different models occurs in the skin tissue.Discussion and Conclusion
E-fields on simplified models predict those on realistic models, in terms of peak amplitude and spatial localization. A/P asymmetry will provide even closer match in future work. Peak E-fields are higher in heterogeneous models compared to corresponding homogeneous and simplified models as expected because of the complex tissue interface features of fully realistic models. Those hot-spots are usually local and disappear as E-fields are spatially smoothed. The variability of peak E-fields is higher across heterogeneous models than across models with uniform interiors. Accurate simulation of E-fields near anatomically complex regions is challenging, requiring both very high model resolution and very computationally complexity. There are relatively few realistic models available, so generalizing to entire population is challenging. Therefore, E-field calculation on simplified or realistic models with uniform interior properties represents a more practical and robust approach to predicting population-wide PNS performance and designing PNS-optimal gradient technologies.Acknowledgements
We acknowledge research support from the National Institutes of Health (NIH R01 EB025131 and NIH U01 EB025144). We acknowledge ZMT Zurich MedTech AG for their Sim4Science support. KE acknowledges the support of a research fellowship from the MINDED program, a Marie Skłodowska-Curie COFUND Action.References
[1] IEC, Medical electrical equipment – Part 2-33: Particular requirements for the basic safety and essential performance of magnetic resonance equipment for medical diagnosis. International Electrotechnical Commissioin 2015 60601-2-33 Edition 3.2. [2] Roemer, Peter B., et al. "Electric field calculation and peripheral nerve stimulation prediction for head and body gradient coils." Magnetic Resonance in Medicine (2021). [3] Ertan, Koray, et al. " Electric Field Calculation and PNS Prediction for Head and Body Gradient Coils." Proceedings of the 29th Annual Meeting of ISMRM, Virtual, 2018. [4] Roemer, Peter B., and Brian K. Rutt. "Minimum electric‐field gradient coil design: Theoretical limits and practical guidelines." Magnetic resonance in medicine 86.1 (2021): 569-580. [5] Davids, Mathias, et al. "Predicting magnetostimulation thresholds in the peripheral nervous system using realistic body models." Scientific reports 7.1 (2017): 1-14. [6] Davids, Mathias, et al. "Optimization of MRI gradient coils with explicit peripheral nerve stimulation constraints." IEEE transactions on medical imaging 40.1 (2020): 129-142. [7] Gosselin, Marie-Christine, et al. "Development of a new generation of high-resolution anatomical models for medical device evaluation: the Virtual Population 3.0." Physics in Medicine & Biology 59.18 (2014): 5287.Figures
Figure 1: Simplified homogeneous body model has 5
different sub-volumes such as top of the head (semi ellipsoid), neck-head
transition $$(R_x=((R_{x2}+R_{x1} ))/2-
((R_{x2}-R_{x1}))/2 cos((z-z_3)/L_3 π)), ((R_{y2}+R_{y1} ))/2- ((R_{y2}-R_{y1} ))/2 cos((z-z_3)/L_3 π)))$$,
body-neck transition $$(R_x=((R_{x1}+R_{x0} ))/2-
((R_{x1}-R_{x0} ))/2 cos((z-z_2)/L_2 π)), ((R_{y1}+R_{y0} ))/2- ((R_{y1}-R_{y0} ))/2 cos((z-z_2)/L_2 π)))$$, body
(elliptic cylinder) and body end (ellipsoid).
Model is symmetric in L-R and A-P directions.

Figure 2: 3D view of the E-fields on the simplified,
homogeneous and heterogeneous Duke models for all three axes. Peak E-fields for
unit slew rate is shown on top of each figure. Note that color map is saturated
at 10mV/m.

Figure 3: Maximum intensity projections of E-fields are
provided for H4 – Y gradient on simplified body models, homogeneous realistic
body models and heterogeneous body models. Each row shows E-fields induced
E-fields distributions are also plotted on skin, sat, bone, muscle, fat and
nerve tissues. Note that peak E-field locations are shown with red arrows.

Figure 4: Bar graph of the peak E-fields on
the simplified models, homogeneous realistic body models and heterogeneous body
models induced by all 3 gradient axes. Peak E-fields on each tissue type is
also provided. The electric field distributions are also smoothed using kernel dimension
of 4.5 mm in all directions. The results of smoothed results are labeled as
<model_name>-Filter.

Figure 5: Peak E-field results on homogeneous
realistic model, heterogeneous realistic model as well as various tissue types
are normalized relative to peak E-fields on simplified body models. Each row
shows the results for different gradient axis (X-Y-Z). Peak E-field results are also provided as a
function of the diameter of the smoothing kernel. Note that filter kernel size
of 1.5 mm corresponds to unfiltered case. Error bar shows the standard deviation across 5 realistic
body models.
DOI: https://doi.org/10.58530/2022/2626