2620
Investigation of metabolic changes in the hippocampus following spinal cord injury applying a metabolite-cycling semi-LASER technique1Spinal Cord Injury Center, Balgrist University Hospital, Zurich, Switzerland, 2Magnetic Resonance Methodology, Institute of Diagnostic and Interventional Neuroradiology, University of Bern, Bern, Switzerland, 3Translational Imaging Center, sitem-insel, Bern, Switzerland, 4Neurophysics Department, Max Plank Institute, Leipzig, Germany
Synopsis
This work uses magnetic resonance spectroscopy data obtained in the hippocampus of 28 patients with traumatic spinal cord injury (SCI) to investigate SCI-induced metabolic changes. Structural magnetic resonance imaging was performed for hippocampal volumetric assessment. Eighteen healthy controls underwent the same imaging protocol. Study participants underwent a functional assessment by testing the visuospatial and verbal memory performance to check for cognitive impairments. In SCI patients without cognitive impairments, hippocampal metabolites did not differ from healthy controls. This study does not support evidence of degeneration and inflammation in the hippocampus of animal models of SCI that show impaired spatial memory performance.
Introduction
Traumatic spinal cord injury (SCI) is a life-changing event and results in neurodegeneration at the lesion site and remote from the lesion site1-4. Previous animal studies have reported SCI-induced changes in the hippocampus5-10, such as chronic inflammation9,10 and neurodegeneration9,10. Moreover, spatial memory performance, for which the right hippocampus plays a critical role11, was impaired in rodents with SCI9,10. However, pathological mechanisms within the human hippocampus after SCI are understudied. Magnetic resonance spectroscopy (MRS) is a suitable technique to quantitively investigate the underlying molecular mechanisms of pathophysiological changes in the hippocampus12,13. However, applying MRS in the hippocampus is challenging due to its small size and deep location in the brain14. Using non-water-suppressed MRS based on the metabolite-cycling (MC) technique has shown substantial benefit for MRS of small volumes15. In this work, semi-LASER was thus combined with MC for optimal sensitivity in recording MRS data in the hippocampus of a cohort of SCI and age- and sex-matched healthy controls to assess metabolic changes after SCI. A potential relationship between metabolite changes, hippocampal volume and changes in memory performance was also investigated.Methods
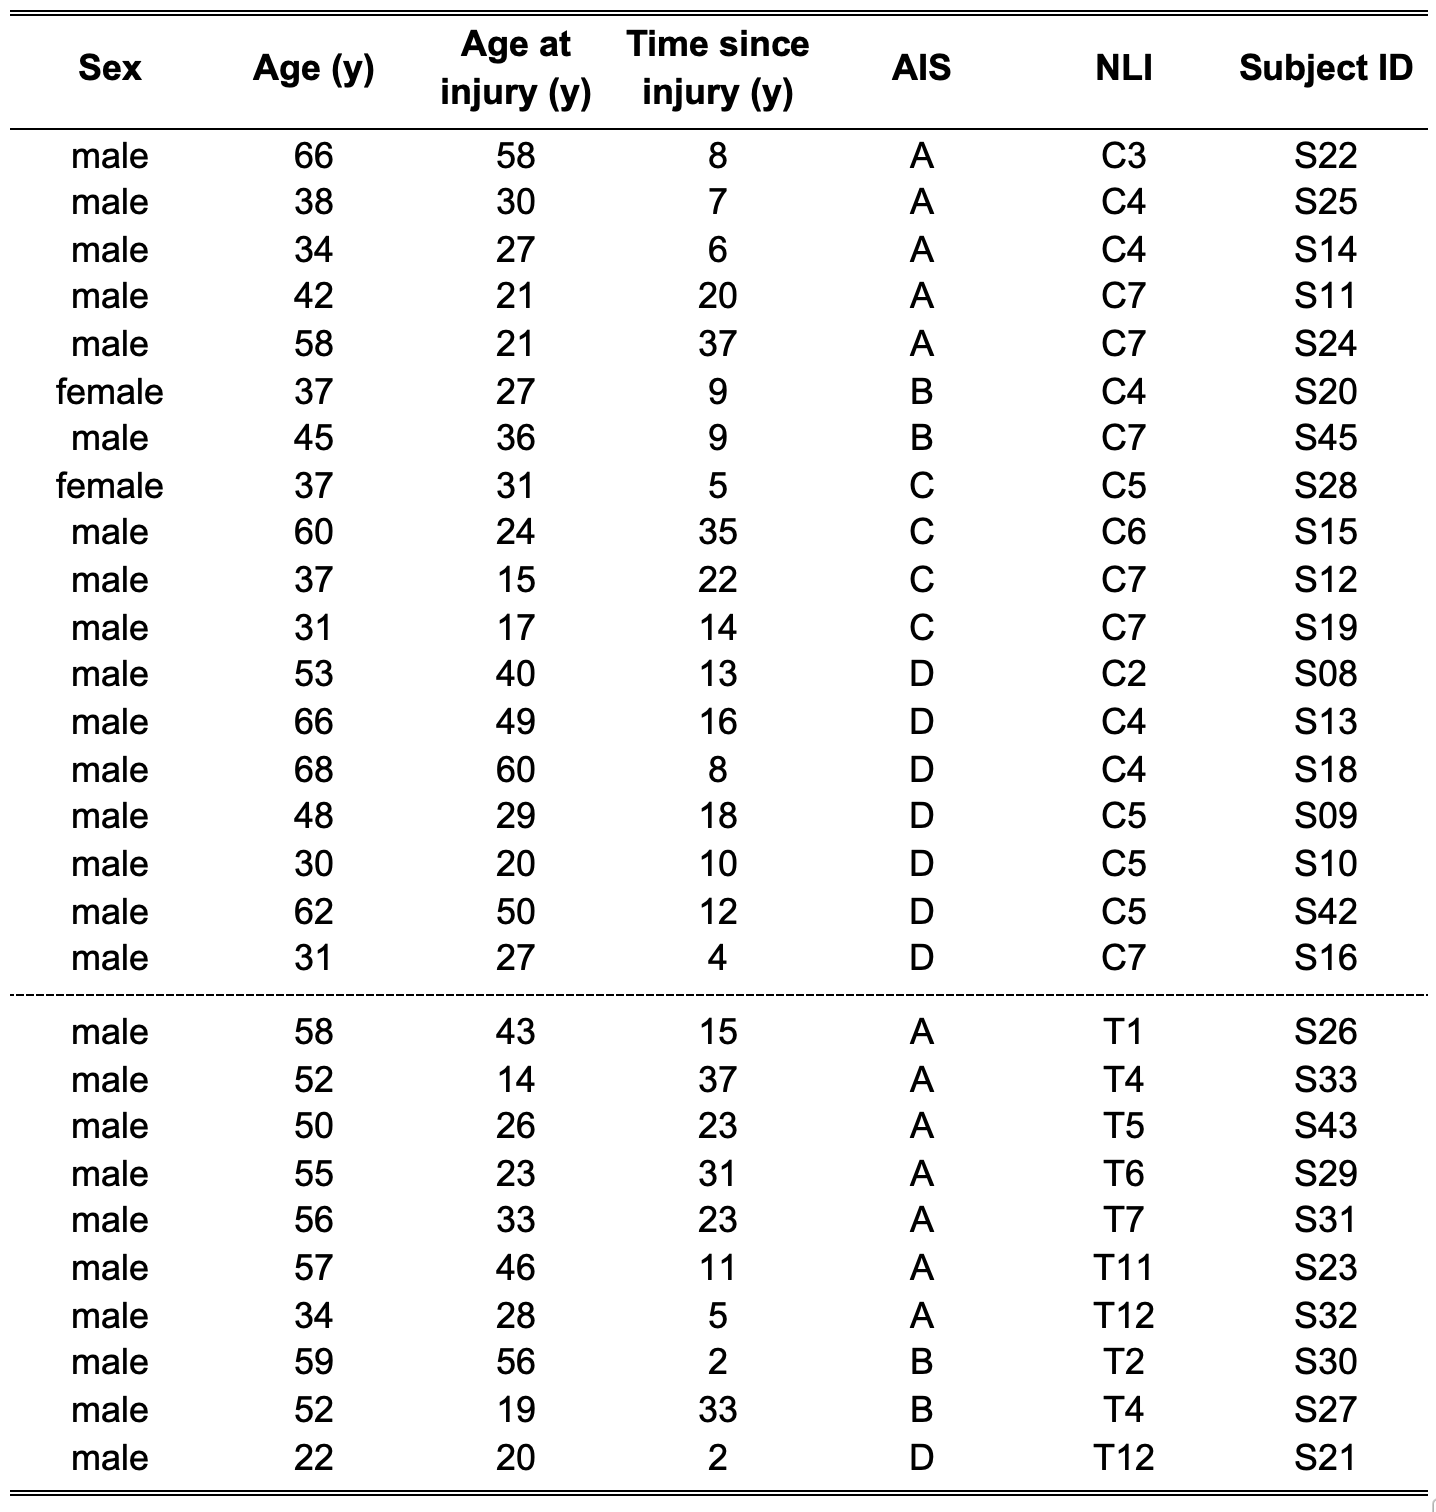
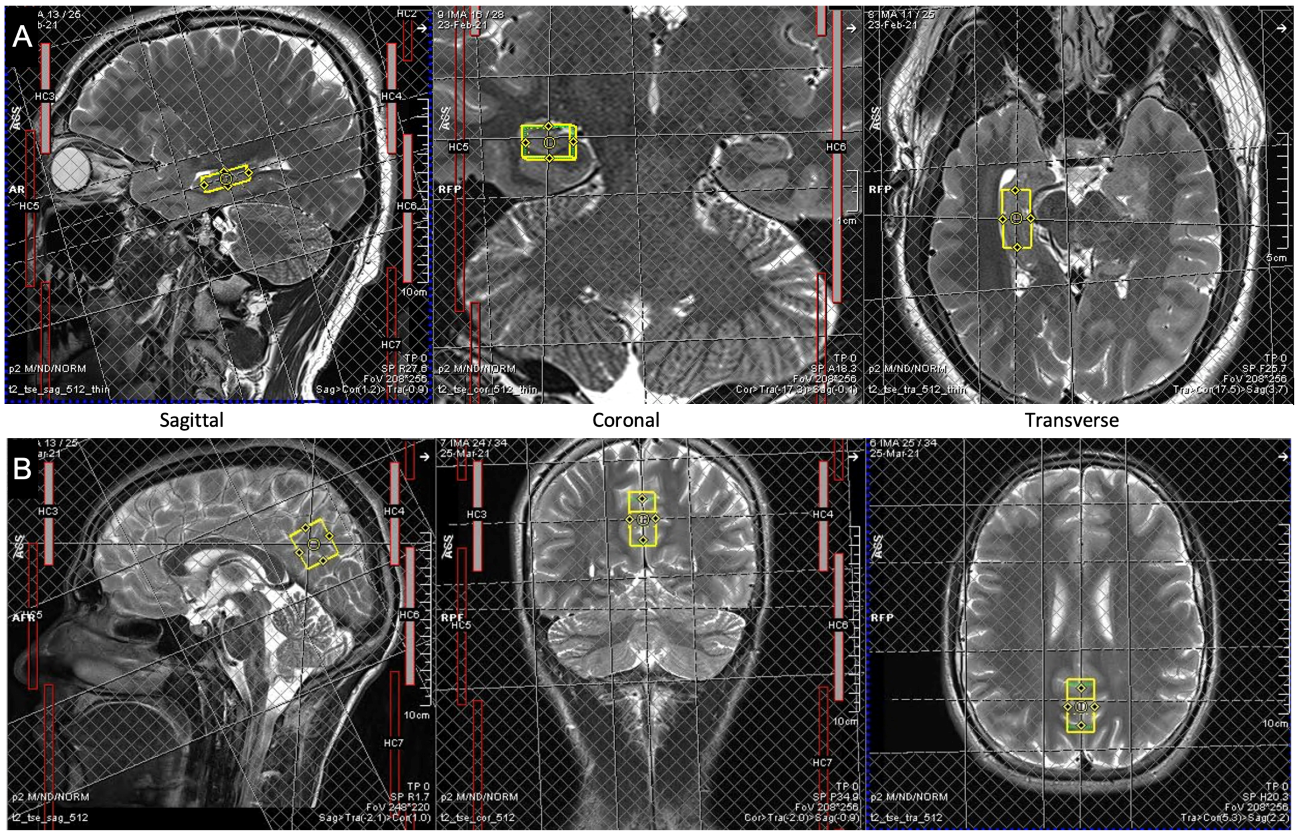
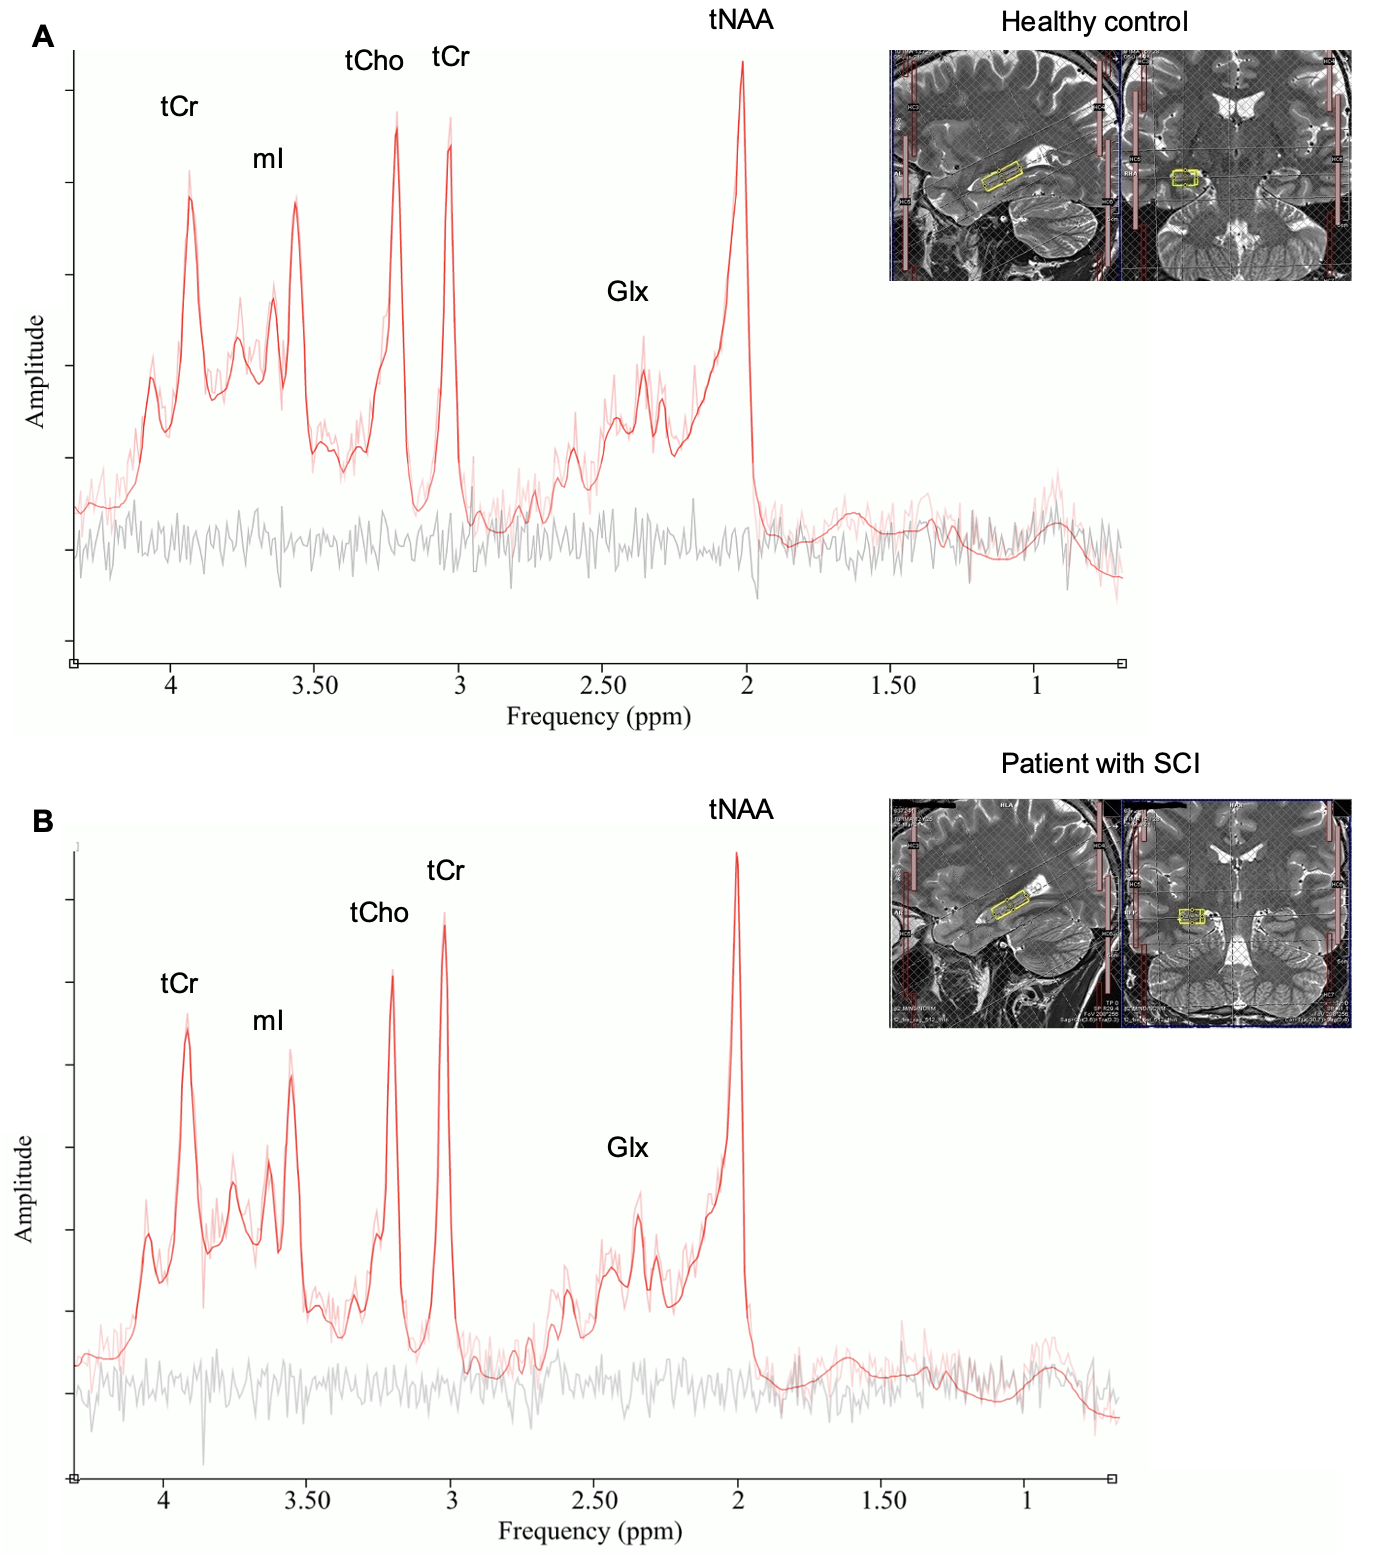
Twenty-eight patients with chronic traumatic SCI (> 6 months post-injury, age [mean ± SD] 48 ± 13 years, 18 tetraplegics, 10 paraplegics, 12 injuries classified as AIS A, 16 injuries classified as AIS B-D) were compared to 18 healthy controls (age [mean ± SD] 49 ± 13 years) that were matched regarding age, sex, and education (Tab. 1). 1H MRS and magnetic resonance imaging (MRI) measurements were carried out on a Prisma 3T scanner (Siemens Healthcare, Erlangen, Germany) with a 64-channel receive head and neck coil. Single-voxel MRS was performed in the right hippocampus (dimensions: 25x12x8 mm3, 2.4 mL) and in a reference region in the posterior parietal lobe (20x14x22 mm3, 6.2 mL) (Fig. 1) with a custom-made semi-LASER16,17 MC technique (TE = 35 ms, TR = 2500 ms). The reference region served as an internal control to identify hippocampus-specific metabolite changes after SCI. In total, 256 acquisitions were acquired per subject for both voxels of interest. The acquired spectra were preprocessed according to a motion compensation (MoCom) scheme18 and fitted with the software FitAID19 using a linear combination model. Absolute metabolite concentrations were quantified with parenchymal water signal as an internal reference20, which was obtained from the identical voxels with a water-unsuppressed echo series (TE = 35, 1000, 50, 400, 200, 75, and 140 ms, TR = 6000 ms). Analyzed metabolites included total N-acetylaspartate (tNAA, N-acetylaspartate plus N-acetylaspartylglutamate), myo-inositol, total choline (tCho, glycerophosphorylcholine plus phosphocholine), total creatine (tCr, creatine plus phosphocreatine), and Glx (glutamate plus glutamine). Mean metabolite concentrations were compared between SCI patients and healthy controls. MPRAGE whole brain and upper cervical cord images were acquired for macrostructural analysis using voxel-based morphometry (VBM) with voxel-wise statistical analysis21 in the right hippocampus. For the functional assessment, visuospatial and verbal memory performance were assessed with the visuospatial and verbal memory test (VVM)22 at immediate and intermediate recall (~90 min after memorizing). Mean memory performance for both subtests at both points in time was compared between SCI patients and healthy controls. The threshold for statistical significance was set to p<0.05 for all performed statistical analyses.Results & Discussion
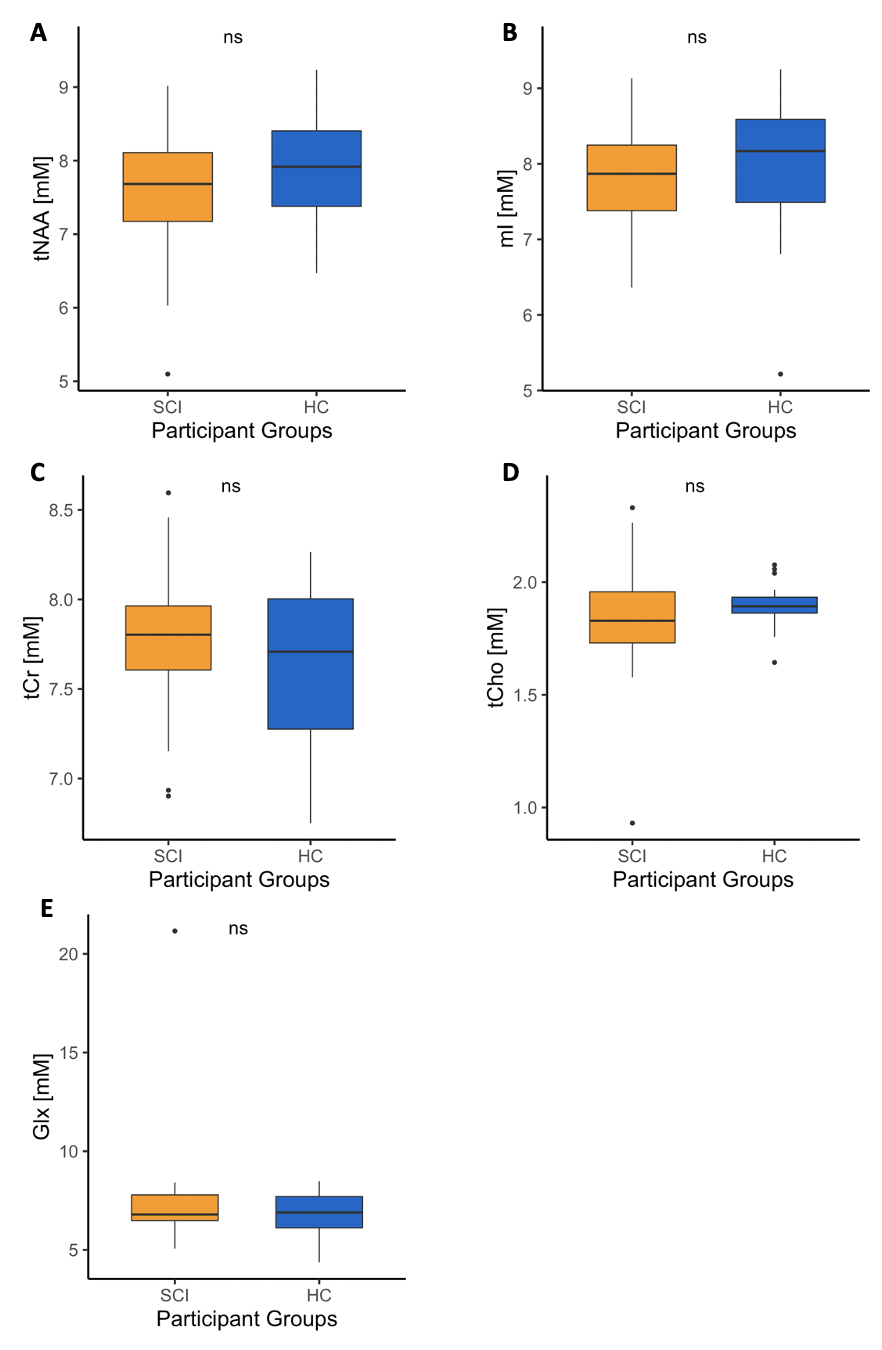
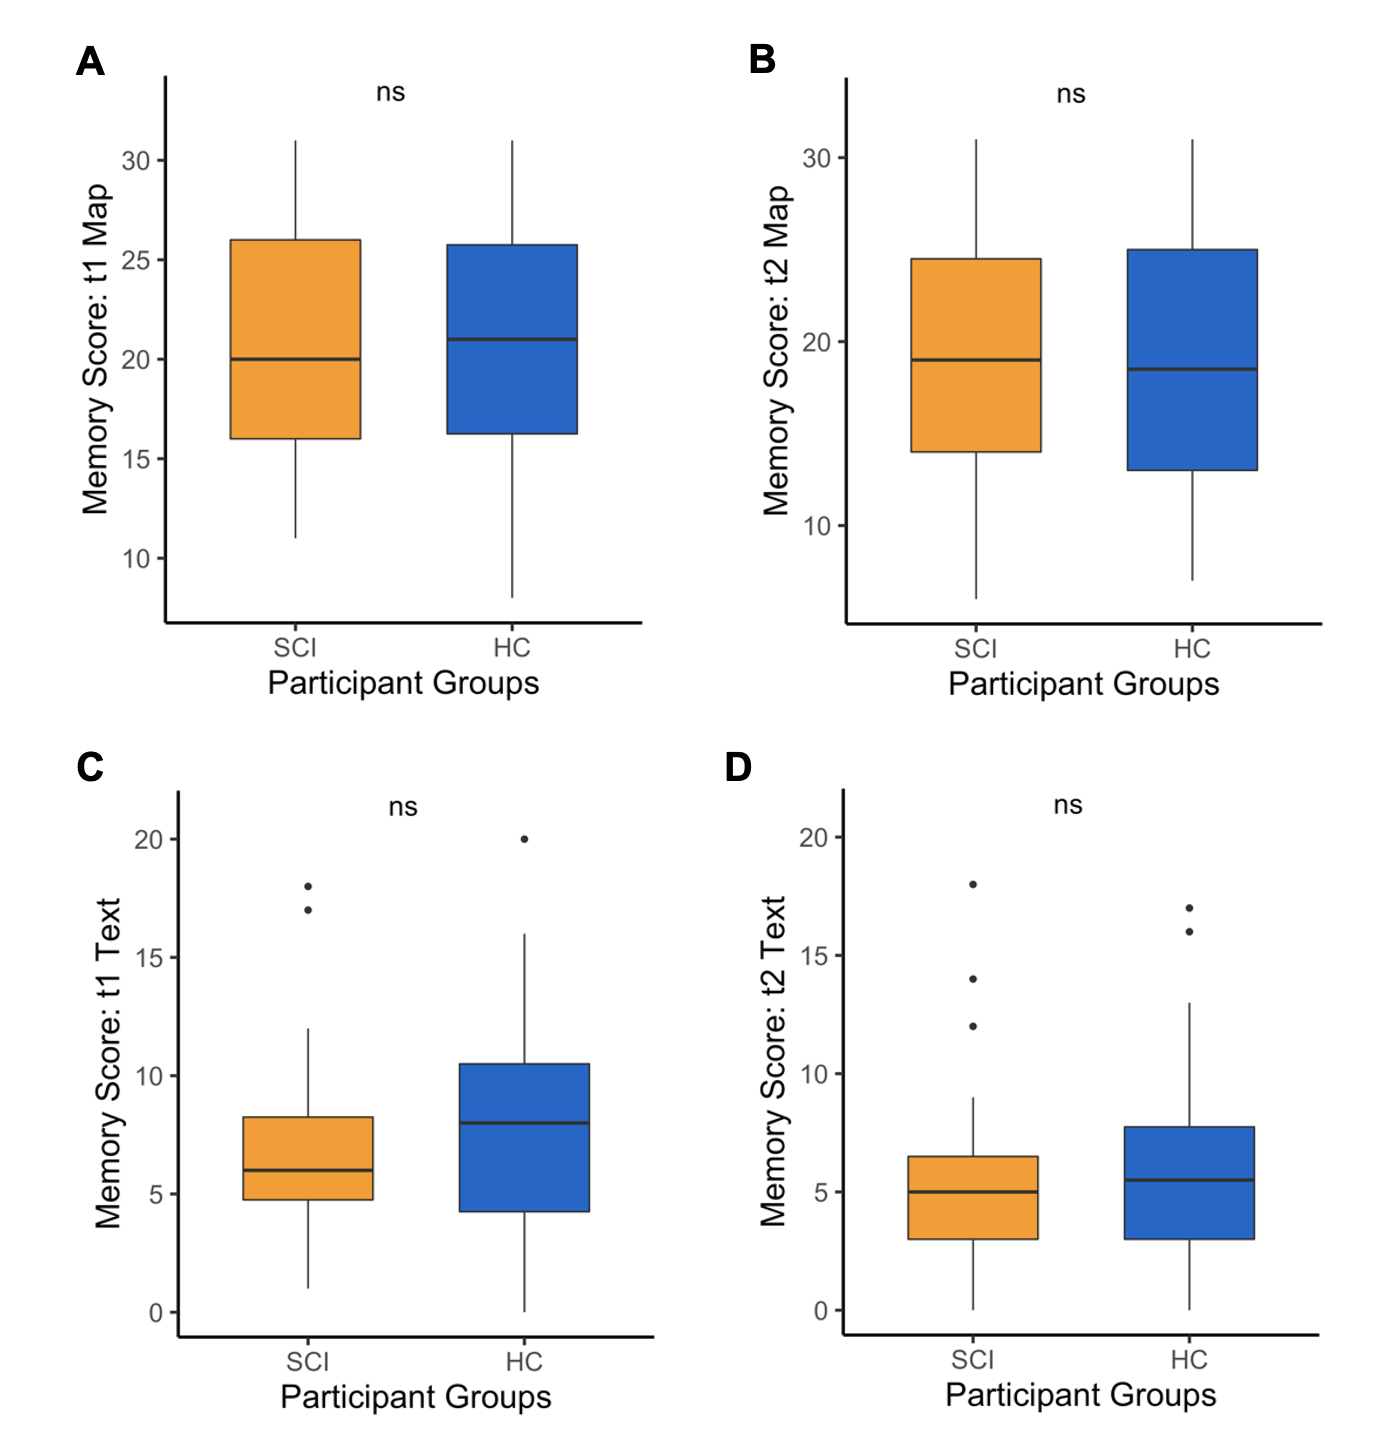
Very tight cohort data was obtained for the concentrations of the main metabolites in both groups of participants (Fig. 2). Cohort variance for all metabolites seems as good here with short TE MC semi-LASER with 256 acquisitions as in an earlier study14 using up to 9 times more averages. Nevertheless, between-group analysis showed no significant differences in the mean concentrations of all reported metabolites in the right hippocampus (Fig. 3). Therefore, metabolite concentrations appear largely unaffected in the right hippocampus in patients with chronic SCI. As markers of specific molecular processes, NAA can be considered a neuronal marker13 and myo-inositol often serves as a gliosis marker13. Therefore, the absence of a significant difference in all mean metabolite concentrations suggests that there is no ongoing neurodegeneration and/or neuroinflammation in the right hippocampus in chronic SCI. No significant differences were observed in the reference region either. Macrostructural analysis with VBM did also not result in a significant difference in the volume of the right hippocampus between the two cohorts indicating that there is no severe hippocampus atrophy. Finally, the functional tests (Fig. 4) did not show any significant differences in the mean performance for the visuospatial and verbal memory for immediate and intermediate recall. These results suggest that the spatial memory, for which the right hippocampus is important11, might not be impaired in patients with chronic SCI. Importantly, the presented results are consistent across the three approaches (metabolite concentrations, macrostructure, and cognitive function).Conclusion
• Short TE semi-LASER combined with MC is well suited for MRS of hippocampus reflected in tight cohort data, thus allowing relatively short acquisition times given the small volumes of interest.• No significant alterations were found for patients with chronic SCI, neither for metabolic, structural nor performance measures.
Acknowledgements
We would like to thank all study participants for their precious time to contribute in this study.References
1. Freund P, Weiskopf N, Ward NS, et al. Disability, atrophy and cortical reorganization following spinal cord injury. Brain 2011; 134(Pt 6): 1610-22.2. Freund P, Curt A, Friston K, Thompson A. Tracking changes following spinal cord injury: insights from neuroimaging. Neuroscientist 2013; 19(2): 116-28.
3. Grabher P, Callaghan MF, Ashburner J, et al. Tracking sensory system atrophy and outcome prediction in spinal cord injury. Annals of neurology 2015; 78(5): 751-61.
4. Freund P, Weiskopf N, Ashburner J, et al. MRI investigation of the sensorimotor cortex and the corticospinal tract after acute spinal cord injury: a prospective longitudinal study. The lancet neurology 2013; 12(9): 873-81.
5. Felix MS, Popa N, Djelloul M, et al. Alteration of forebrain neurogenesis after cervical spinal cord injury in the adult rat. Frontiers in neuroscience 2012; 6: 45.
6. Jure I, Pietranera L, De Nicola AF, Labombarda F. Spinal cord injury impairs neurogenesis and induces glial reactivity in the hippocampus. Neurochemical research 2017; 42: 2178-90.
7. Chang CM, Lee MH, Wang TC, Weng HH, Chung CY, Yang JT. Brain protection by methylprednisolone in rats with spinal cord injury. Neuroreport 2009; 20(10): 968-72.
8. Zangbar HS, Shahabi P, Vafaee MS, et al. Hippocampal neurodegeneration and rhythms mirror each other during acute spinal cord injury in male rats. Brain research bulletin 2021; 172: 31-42.
9. Wu J, Zhao Z, Sabirzhanov B, et al. Spinal cord injury causes brain inflammation associated with cognitive and affective changes: role of cell cycle pathways. Journal of neuroscience 2014; 34(33): 10989-1006.
10. Wu J, Stoica BA, Luo T, et al. Isolated spinal cord contusion in rats induces chronic brain neuroinflammation, neurodegeneration, and cognitive impairment. Involvement of cell cycle activation. Cell cycle 2014; 13(15): 2446-58.
11. Burgess N, Maguire EA, O’Keefe J. The human hippocampus and spatial and episodic memory. Cell press 2002; 35(4): 625-41.
12. Ross AJ, Sachdev PS. Magnetic resonance spectroscopy in cognitive research. Brain research reviews 2004; 44(2-3): 83-102.
13. Duarte JM, Lei H, Mlynárik V, Gruetter R. The neurochemical profile quantified by in vivo 1H NMR spectroscopy. Neuroimage 2012; 61(2): 342-62.
14. Allaili N, Valabregue R, Auerbach EJ, et al. Single-voxel (1)H spectroscopy in the human hippocampus at 3 T using the LASER sequence: characterization of neurochemical profile and reproducibility. NMR Biomed 2015; 28(10): 1209-17.
15. Hock A, MacMillan EL, Fuchs A, et al. Non-water-suppressed proton MR spectroscopy improves spectral quality in the human spinal cord. Magn Reson Med 2013; 69(5): 1253-60.
16. Lin M, Kumar A, Yang S. Two-dimensional J-resolved LASER and semi-LASER spectroscopy of human brain. Magnetic resonance in medicine 2014; 71(3): 911-20.
17. Scheenen TW, Klomp DW, Wijnen JP, Heerschap A. Short echo time 1H-MRSI of the human brain at 3T with minimal chemical shift displacement errors using adiabatic refocusing pulses. Magnetic resonance in medicine 2008; 59(1): 1-6.
18. Döring A, Adalid V, Boesch C, Kreis R. Diffusion-weighted magnetic resonance spectroscopy boosted by simultaneously acquired water reference signals. Magnetic resonance in medicine 2018; 80(6): 2326-38.
19. Chong DG, Kreis R, Bolliger CS, Boesch C, Slotboom J. Two-dimensional linear-combination model fitting of magnetic resonance spectra to define the macromolecule baseline using FiTAID, a Fitting Tool for Arrays of Interrelated Datasets. Magnetic resonance materials in physics, biology and medicine 2011; 24(3): 147-64.
20. Near J, Harris AD, Juchem C, et al. Preprocessing, analysis and quantification in single-voxel magnetic resonance spectroscopy: experts' consensus recommendations. NMR in biomedicine 2021; 34(5): e4257.
21. Ashburner J, Friston KJ. Voxel-based morphometry - the methods. Neuroimage 2000; 11(6 Pt 1): 805-21.
22. Pearson. VVM (D.Schellig, B.Bächtle, 2001). 2020. https://www.pearsonclinical.de/vvm-1.html (accessed 17.08. 17.08.2021).
Figures