2618
A meta-analysis of GABA and Glutamate response in functional magnetic resonance spectroscopy
Duanghathai Pasanta1,2, Georg Oeltzschner3, Talitha Ford4, David J. Lythgoe5, and Nicolaas A. Puts1,6
1Department of Forensic and Neurodevelopmental Sciences, Sackler Institute for Translational Neurodevelopment, Institute of Psychiatry, Psychology, and Neuroscience, King's College London, London, United Kingdom, 2Department of Radiologic Technology, Faculty of Associated Medical Sciences, Chiang Mai University, Chiang Mai, Thailand, 3Russell H. Morgan Department of Radiology and Radiological Science, Johns Hopkins University School of Medicine, Baltimore, MD, United States, 4Cognitive Neuroscience Unit, School of Psychology, Deakin University, Geelong, Australia, 5Department of Neuroimaging, King’s College London, London, United Kingdom, 6MRC Centre for Neurodevelopmental Disorders, King's College London, London, United Kingdom
1Department of Forensic and Neurodevelopmental Sciences, Sackler Institute for Translational Neurodevelopment, Institute of Psychiatry, Psychology, and Neuroscience, King's College London, London, United Kingdom, 2Department of Radiologic Technology, Faculty of Associated Medical Sciences, Chiang Mai University, Chiang Mai, Thailand, 3Russell H. Morgan Department of Radiology and Radiological Science, Johns Hopkins University School of Medicine, Baltimore, MD, United States, 4Cognitive Neuroscience Unit, School of Psychology, Deakin University, Geelong, Australia, 5Department of Neuroimaging, King’s College London, London, United Kingdom, 6MRC Centre for Neurodevelopmental Disorders, King's College London, London, United Kingdom
Synopsis
Functional magnetic resonance spectroscopy (fMRS) can be used to investigate the neurometabolic responses to external stimuli in-vivo, but findings to date are inconsistent. We performed a systematic review and meta-analysis on 49 human fMRS studies on Glutamate, Glx (Glutamate + Glutamine) and GABA. Small to moderate effect sizes of 0.29-0.47 (p < 0.05) were observed for Glu/Glx regardless of stimulus domain but not for GABA. Results suggest Glu/Glx and GABA responses vary with time course and are unique to stimulus domain or task. This analysis will inform study design in future work.
INTRODUCTION
Functional magnetic resonance spectroscopy (fMRS) is a potential powerful tool to investigate the neurochemicals dynamic in response to various type of interventions and stimulations. However, there is limited consensus on the paradigms, stimulus domains, and response functions associated with neurochemical dynamics; studies vary in effect size, and there continues to be a discussion on suitable acquisition duration and analytical approach. We aim to inform these unknowns by performing a meta-analysis of existing 1H-fMRS studies of GABA and Glutamate (either as Glu or as Glx; Glutamate+Glutamine) in the healthy brain. In this meta-analysis, we systematically summarise and analyse reported metabolite level changes based on fMRS paradigms and stimulus domains from existing studies.METHODS
Data extractionA systematic search was performed according to PRISMA guidelines1 focused on functional MRS studies of GABA and Glu/Glx. Forty-nine eligible studies were included (Fig.1). Standardized mean differences in metabolite levels between paradigm conditions and 95% confidence intervals (Hedge’s G) was calculated from extracted data using the Meta-Essentials2. MRS reporting quality assurance was performed following MRS-Q checklists3,4.
Data analysis
Extracted effect sizes were pooled using the robust variance estimation method in R-package robumeta6 to account for non-independence of effect size as multiple experiments and time-points were reported in each individual study. Effect sizes were first pooled based on type of data extracted (mean or percentage change from the baseline (change scores))7, then divided into sub-groups based on paradigm (block or event-related), and stimulus domain. If only one study with multiple outcomes was included for subgroup analysis, the R-package meta8 was used. Results were considered statistically significant at p < 0.05, and at p < 0.01 when the degrees of freedom < 4 for RVE t-tests to account for Type-I error9.
RESULTS
Quality assessmentMost studies included were assessed to be of high quality through the MRS-Q (Fig.2A). 36.7% (n = 18/49) of the studies were identified as ‘low-quality’, mostly due to an insufficient number of transients or small voxel size (see Discussion). Fig. 2B and 2C summarize studies by brain region investigated for Glx/Glu and GABA and additionally reports on studies by stimulus domains.
Glu/Glx and GABA level across studies
Across 49 studies, mean Glu and Glx increased significantly [compared to the respective control condition] in fMRS studies (Hedge’s G = 0.371 and 0.292 respectively). The percentage change in Glu was positive on average (Hedge’s G = 0.473) (Fig.3A). We found no significant change in GABA across 20 included studies.
Glu/Glx and GABA level by type of paradigm
When effect sizes were differentiated between the type of paradigm regardless of brain region and stimulus domain, block designs showed lower variation in effect size and a significant overall positive change in Glu/Glx (Hedge’s G = 0.286 to 0.365). A reduction in GABA was observed for event-related designs (but not block designs); Hedge’s G = -0.756) (Fig.3B).
Glu/Glx and GABA level by stimulus domain
Figure 4 shows metabolite level changes compared between stimulation domains. Mean Glu/Glx changes were significantly positive during cognitive stimulation (Hedge’s G = 0.398). Percentage change in Glu/Glx were positive during learning (Hedge’s G = 0.287). Mean GABA level was positively increased during motor (Hedge’s G = 0.322) and exercise (Hedge’s G = 0.465), while percentage change of GABA was negative during transcranial direct-current stimulation (Hedge’s G = -0.122). Stress stimulation was associated with a significant negative change of both Glu/Glx (Hedge’s G = -0.413) and GABA (Hedge’s G = -0.869). There was no average significant change related to visual stimulation for both Glu/Glx and GABA.
Glu/Glx and GABA level by time course
Figure 5 illustrates effect sizes in relation to time of data acquisition during fMRS. The results show different fluctuation patterns in GABA/Glu/Glx for different stimulus domains relative to the time of stimulation.
DISCUSSION
Results show a wide range effect size variability and directionality in fMRS of GABA and Glu/Glx. The observed changes strongly depend on the type of paradigm and the stimulus domain. Time-resolved fluctuation patterns suggest a potential response delay for different brain regions or stimulus domains, and between GABA and Glu/Glx. This delay may explain the variation of effect sizes observed in event-related designs and associate with different parts of the neurometabolite response10, which may also explain differences in directionality of findings.Currently available quality assurance and reporting metrics (MRS-Q and MRSinMRS) were designed for static MRS3,11, and do not take into account functional approaches where a reduced number of transients for averaging are often used and modelled. Notably, many studies used small voxel sizes compared to consensus recommendation3, in particular for spectral editing of GABA12, making the current findings less reliable. The variation in effect sizes observed is likely due to different approaches used, typical for an emerging technique such as fMRS.
CONCLUSION
Establishing fMRS paradigms and parameters that evoke metabolic responses with high reliability and reproducibility is of great interest to investigate healthy and atypical brain function. Here, we establish effect sizes and directionality of the GABA and Glu response in all currently available fMRS studies, with the aim to improve consensus and reproducibility of fMRS research and show the importance of standardised reporting and minimal best practice for fMRS.Acknowledgements
The work was supported in part by Chiang Mai University, Chiang Mai, Thailand.References
1. Tricco AC, Lillie E, Zarin W, et al. PRISMA extension for scoping reviews (PRISMA-ScR): checklist and explanation. Ann Intern Med. 2018;169(7):467-473.2. Suurmond R, van Rhee H, Hak T. Introduction, comparison, and validation of Meta-Essentials: A free and simple tool for meta-analysis. Res Synth Methods. 2017;8(4):537-553.
3. Peek AL, Rebbeck T, Puts NA, Watson J, Aguila MER, Leaver AM. Brain GABA and glutamate levels across pain conditions: A systematic literature review and meta-analysis of 1H-MRS studies using the MRS-Q quality assessment tool. NeuroImage. 2020;210:116532.
4. Puts N, Peek A. MRS-Q. Published online January 22, 2020.
5. Fisher Z, Tipton E. robumeta: An R-package for robust variance estimation in meta-analysis. ArXiv150302220 Stat. Published online March 7, 2015. http://arxiv.org/abs/1503.02220 Accessed October 31, 2021.
6. 9.4.5.2 Meta-analysis of change scores. https://handbook-5-1.cochrane.org/chapter_9/9_4_5_2_meta_analysis_of_change_scores.htm Accessed November 5, 2021.
7. Schwarzer G. meta: An R package for meta-analysis. R News. 2007;7(3):40-45.
8. Tanner-Smith EE, Tipton E, Polanin JR. Handling Complex Meta-analytic Data Structures Using Robust Variance Estimates: a Tutorial in R. J Dev Life-Course Criminol. 2016;2(1):85-112.
9. Moher D, Shamseer L, Clarke M, et al. Preferred reporting items for systematic review and meta-analysis protocols (PRISMA-P) 2015 statement. Syst Rev. 2015;4(1):1.
10. Mullins PG. Towards a theory of functional magnetic resonance spectroscopy (fMRS): A meta-analysis and discussion of using MRS to measure changes in neurotransmitters in real time. Scand J Psychol. 2018;59(1):91-103.
11. Lin A, Andronesi O, Bogner W, et al. Minimum Reporting Standards for in vivo Magnetic Resonance Spectroscopy (MRSinMRS): Experts’ consensus recommendations. NMR Biomed. 2021;34(5):e4484.
12. Puts NAJ, Edden RAE. In vivo magnetic resonance spectroscopy of GABA: A methodological review. Prog Nucl Magn Reson Spectrosc. 2012;60:29-41.
Figures
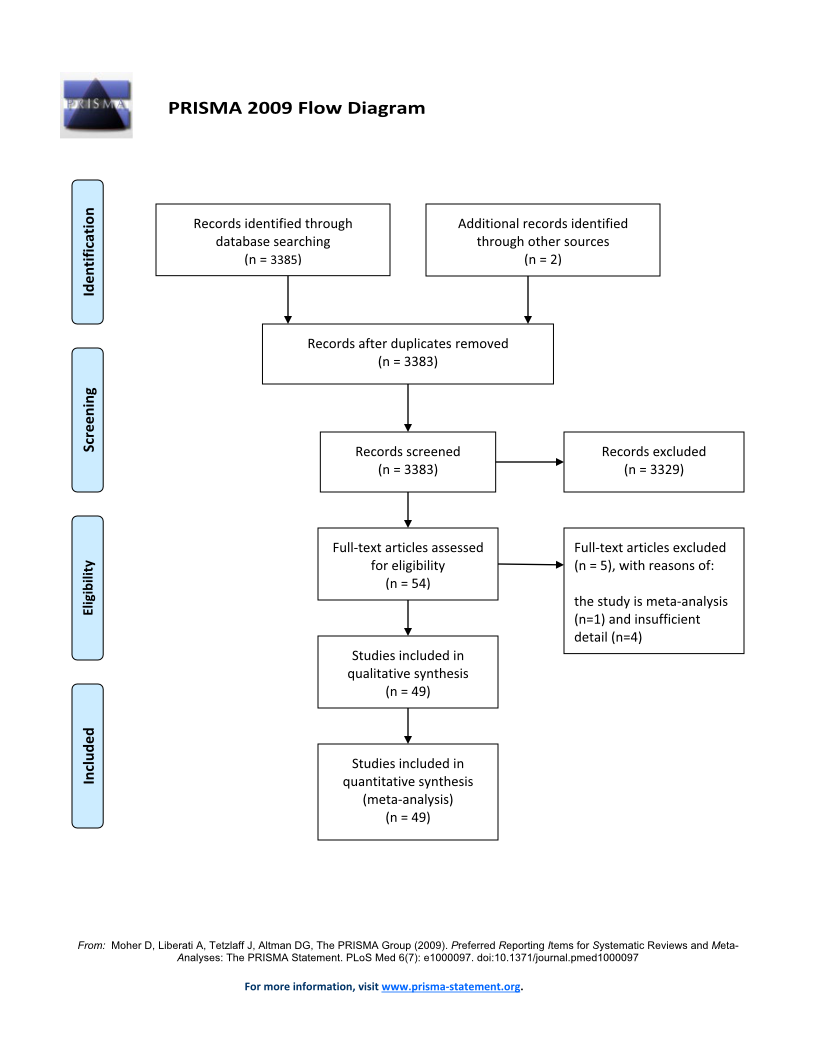
Figure 1: PRISMA flow diagram5. The initial search resulted in 3,385 studies. Following the removal of duplicates, a total of 3,383 studies are eligible for abstract screening. A total of 54 studies were included in the full-text screening, resulting in the inclusion of 49 studies in the meta-analysis.
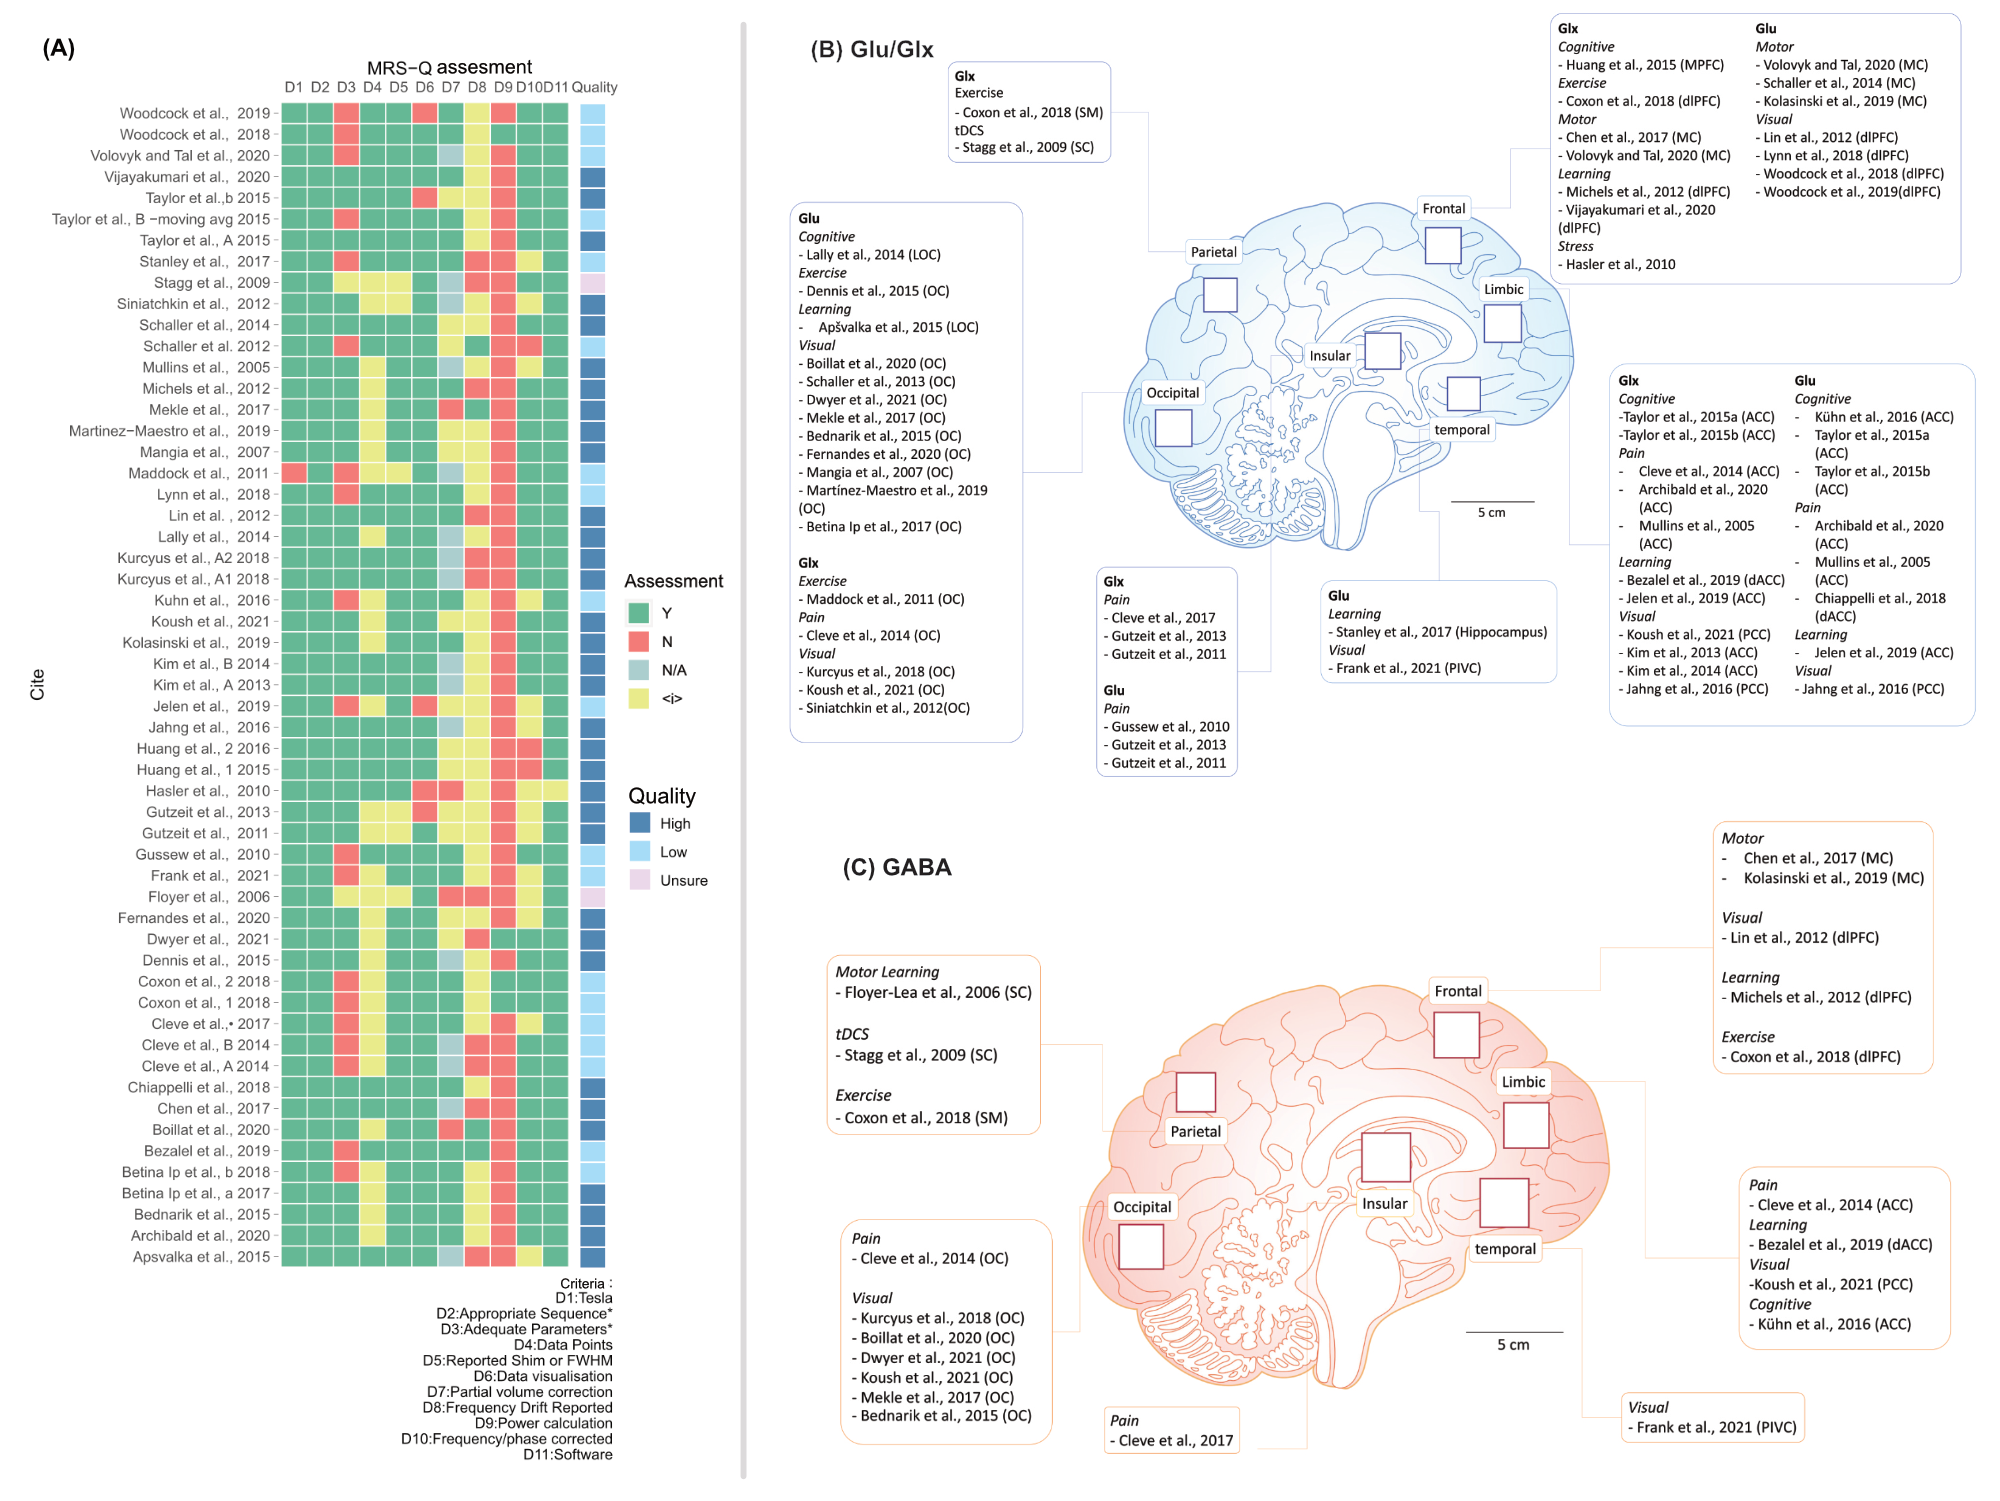
Figure 2: (A) Traffic light plot of MRS methodological quality. (B) Brain regions, stimulus domains and average voxel sizes of included fMRS studies of Glu/Glx. (C) Brain regions, stimulus domains and average voxel sizes of included fMRS studies of GABA. Voxel sizes are for illustration purposes only and do not reflect study parameters.
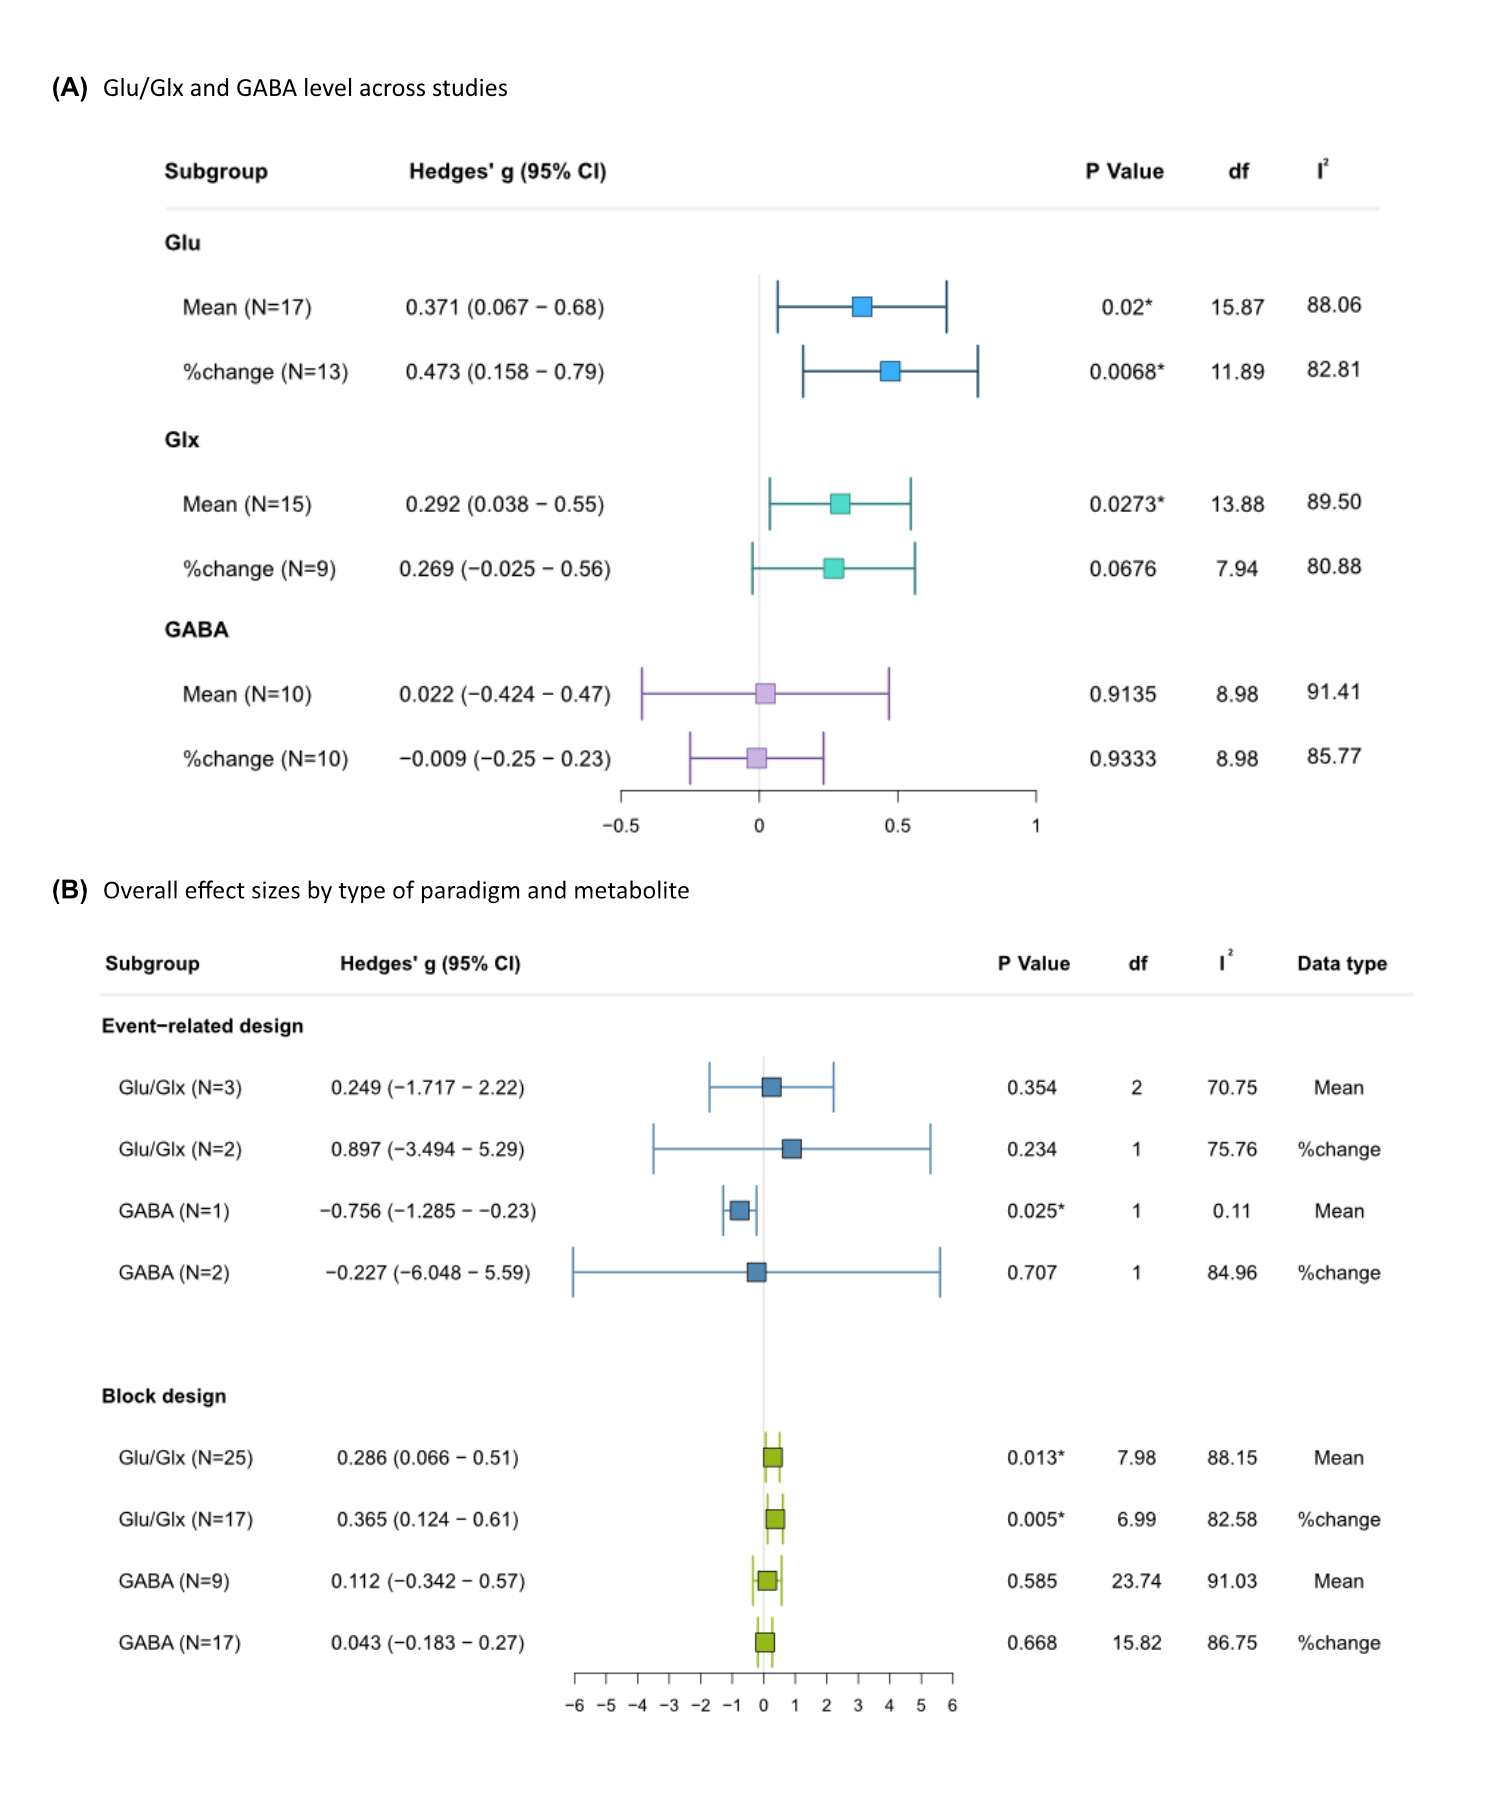
Figure 3: (A) Overall effect sizes by type of data and metabolite irrespective of stimulus domains. (B) Overall effect sizes by type of paradigm and metabolite. N: number of studies included; I2: I2 index for heterogeneity. *Statistically significant at p <0.05, and at p <0.01 when the degrees of freedom < 4 for RVE t-tests.

Figure 4: Overall effect sizes by type of stimulus and metabolite. N: number of studies included; I2: I2 index for heterogeneity. * Statistically significant at p <0.05, and at p <0.01 when the degrees of freedom < 4 for RVE t-tests.
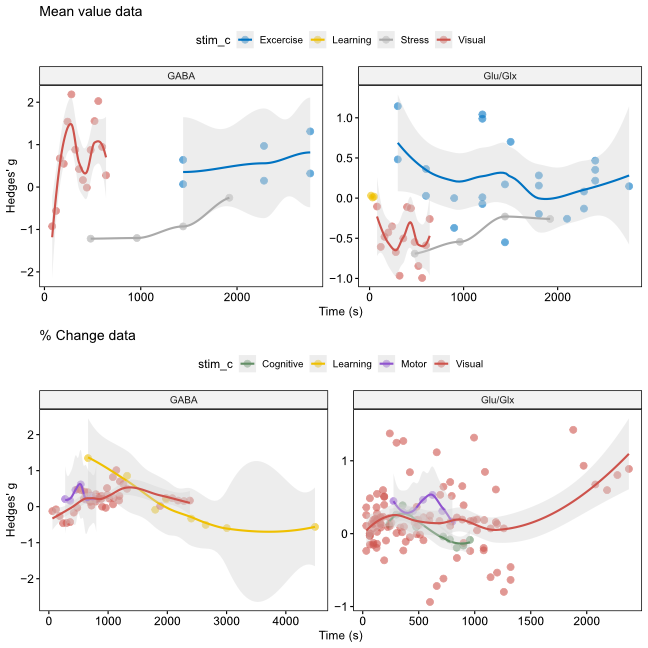
Figure 5: Effect size of each study in relation to time of data acquisition during fMRS.
DOI: https://doi.org/10.58530/2022/2618