2617
Uncertainties and bias in quantification by deep learning in magnetic resonance spectroscopy
Rudy Rizzo1,2, Martyna Dziadosz1,2, Sreenath Pruthviraj Kyathanahally3, and Roland Kreis1,2
1Magnetic Resonance Methodology, Institute of Diagnostic and Interventional Neuroradiology, University of Bern, Bern, Switzerland, 2Translational Imaging Center, sitem-insel, Bern, Switzerland, 3Department Systems Analysis, Integrated Assessment and Modelling, Data Science for Environmental Research group, Dübendorf, Switzerland
1Magnetic Resonance Methodology, Institute of Diagnostic and Interventional Neuroradiology, University of Bern, Bern, Switzerland, 2Translational Imaging Center, sitem-insel, Bern, Switzerland, 3Department Systems Analysis, Integrated Assessment and Modelling, Data Science for Environmental Research group, Dübendorf, Switzerland
Synopsis
Deep Learning has introduced the possibility to speed up quantitation in Magnetic Resonance Spectroscopy. However, questions arise about how to access and relate to prediction uncertainties. Distributions of predictions and Monte-Carlo dropout are here used to investigate data and model related uncertainties, exploiting ground truth knowledge (in-silico set up). It is confirmed that DL is a dataset-biased technique, showing higher uncertainties toward the edges of its training set. Surprisingly, metabolites present in high concentrations suffer from comparable high uncertainties as when present in low concentrations. Evaluating and respecting fitting uncertainties is equally crucial for DL and traditional approaches.
Introduction
Supervised Deep Learning (DL) utilizes neural networks to discover and represent essential features embedded in large data sets and to determine complex nonlinear mappings between inputs and outputs1, and thus, does not require any prior knowledge or formal assumptions. However, it is typically found to be biased on datasets it has been trained for2. DL for Magnetic Resonance Spectroscopy (MRS) quantification has been increasingly explored in recent years3,4,5 and shown to speed up quantitation, but questions arose regarding the reliability aspects of DL algorithms.Uncertainty measures provide information about how confident a given algorithm was in performing a given task on a given dataset. This information in turn can be used to leverage the decision-making process of a user (e.g., how much to trust the estimated concentration of a metabolite) or to enable optimizations of the acquisition technique or the algorithm employed to estimate results (e.g., focusing on areas of high uncertainty6). Traditional MRS model fitting relies on a strong mathematical background regarding how to access uncertainties: the Cramer Rao Lower Bounds (CRLBs)7 estimate uncertainties as function of the model (presumed to be true), and noise level of the data. It is fundamental to access a CRLB-comparable uncertainty measure for MRS metabolite quantification by DL8. Neural network uncertainties originate from noise inherent in the data (aleatoric uncertainty) and uncertainty in the model parameters (epistemic uncertainty)9,10. A proposed method to target aleatoric uncertainties based on SNR, linewidth and degree of spectral overlap has been already introduced but it relies only on CNN architectures capable to isolate metabolite basis sets3.
In the current work, metrics based on bias and spread of predicted distribution of concentrations are used to explain aleatoric uncertainties, which can be extended to any network. Epistemic uncertainties are explored via Monte-Carlo dropout11. In-silico simulations guarantee knowledge of Ground Truth (GT).
Methods
Two Bayesian-hyperparameterized12 shallow Convolutional Neural Networks13 (CNN) that use high-frequency-resolved realizations of spectrograms14,15 calculated via an in-house script (details in Fig.1) are trained and tested with two datasets (one with independent noise realizations, the other noiseless spectra). 16 metabolites with concentrations varying independently and uniformly between 0 and twice a normal reference concentration from literature15 are simulated. A constant downscaled water reference is added at 0.5ppm to ease quantitation. Macro-molecular background (MMBG), shim and SNR mimic in vivo acquisitions and were independently and uniformly varied (time-domain water-referenced SNR 5-40, shim 2-5Hz, MMBG16 amplitude ±33%), Fig.1. Relative concentrations are provided as output, but referencing to an estimated water content yields absolute concentrations.Aleatoric uncertainties are evaluated via bias of the DL predictions from ground truth and spread of these predictions, both as estimated for 20 different bins that cover the whole GT concentration range of each metabolite (called Bin-Spread-Function in Fig.2).
Monte-Carlo dropout consisted of testing the trained model 100 times with activated dropout layers. Thus, the network structure slightly changes for each prediction (i.e., a different set of neurons is switched off) although preserving its weights. The 100 predictions yield a distribution (called Point-Spread-Function in Fig.2) for any sample in the test set. Bias and spread of these distributions are then calculated for every test sample, averaged for every GT value, and used as epistemic uncertainties. They highlight the susceptibility of predictions to model variation.
Results & Discussion
Fig.3 reports predictions vs. GT values and Fig.4 maps aleatoric and epistemic uncertainties as function of GT values, both for 8 metabolites trained and tested for realistic or noiseless cases.- Prediction bias for low SNR cases (Fig.3): predicted concentrations should be unbiased, thus returning uniform distributions for uniform test data. However, our CNN-predictions for real-world simulations tend towards the mean of the training data. Predictions at the boundaries of the testing range are folded back towards the mean value in case of strong uncertainty (i.e., low metabolite SNR), given the lack of knowledge outside the boundary. Noiseless simulations show a significantly reduced bias.
- Prediction bias influenced by restrained training set concentration ranges: epistemic uncertainties indicate higher variability of predictions at the boundaries of the concentration ranges which is paired with higher biases for aleatoric uncertainties. In the noiseless scenario is evident how the point-spread-function is affected by larger spread at the edges (i.e., U-shape). Training and testing with noise shows the same trend if relative SNR is high enough.
Conclusions
- Deep Learning algorithms can provide measures of uncertainties.
- Four measures for aleatoric and epistemic uncertainties are provided, partly representing accuracy and precision of predictions. They do scale with metabolite SNR, but hint towards bias and increased uncertainty at the edges of the explored parameter space for (these) DL methods in many cases, even at infinite SNR.
- Deep Learning does not require feature selection by the user but the potential intrinsic biases at training set boundaries act similarly to soft constraints in traditional modeling leading estimated values to the normal expected concentration range, which is dangerous in a clinical context that requires the algorithm to be un-biased to outliers (i.e., pathological data).
- Further investigation to access more stable predictions are needed: testing only on smaller concentration ranges, where uncertainties are limited (i.e., around training set mean value) combined with training sets with high SNR.
Acknowledgements
This work is supported by the Marie-Sklodowska-Curie Grant ITN-39 237 (Inspire-Med).References
- LeCun, Y. et al. Deep Learning. Nature, 521 , 436-444 (2015).
- Gyori, N.G. et al. Training data distribution significantly impacts the estimation of tissue microstructure with machine learning. Magn. Reson. Med. 00, 1-16 (2021).
- Lee, H.H. et al. Deep Learning-based target metabolite isolation and big data-driven measurement uncertainty estimation in proton magnetic resonance spectroscopy of the brain. Magn. Reson. Med. 00, 1-18 (2020).
- Gurbani, S.S. et al. Incorporation of a spectral model in a convolutional neural network for accelerated spectral fitting. Magn. Reson. Med. 81, 3346-3357 (2018).
- Hatami, N. et al. Magnetic Resonance Spectroscopy Quantification using Deep Learning. arXiv:1806.07237v1 (2018).
- Jungo, A. et al. Assessing Reliability and Challenges of Uncertainty Estimations for Medical Image Segmentation. arXiv:1907.03338v2 (2019).
- Bolliger, C.S. et al. On the use of Cramér-Rao minimum variance bounds for the design of magnetic resonance spectroscopy experiments. Neuroimage. 83, 1031-1040 (2013).
- Landheer, K. et al. Are Cramer-Rao lower bounds an accurate estimate for standard deviations in in vivo magnetic resonance spectroscopy? NMR Biomed. e4521 (2021).
- Gal, Y. Uncertainty in Deep Learning, University of Cambridge (2016).
- Kendall, A. What uncertainties do we need in bayesian deep learning for computer vision? arXiv:1703.04977v2 (2017).
- Gal, Y. et al. Dropout as a Bayesian Approximation: Representing Model Uncertainty in Deep Learning. arXiv:1506.02142v6 (2016).
- Snoek, J. Practical Bayesian otimization of Machine Learning Algoirthms. 25th International Conference on Neural Information Processing System. (2012).
- Espi, M. et al. Exploiting spectro-temporal locality in deep learning based acoustic event detection. J Audio Speech Music Proc. 26 (2015).
- Kyathanahally, S.P., Doering A., Kreis R. Deep Learning approaches for detection and removal of ghosting artifacts in MR Spectroscopy. MRM 80:851-863 (2018).
- Malgorzata, M. et al. Region-specific aging of the human brain as evidenced by neurochemical profiles measured noninvasively in the posterior cingulate cortex and occipital lobe using 1H magnetic resonance spectroscopy at 7T. Neuroscience. 354, 168-177 (2017).
- Hoefemann, M. et al. Optimizing acquisition and fitting conditions for 1H MR spectroscopy investigations in global brain pathology. NMR Biomed. 32, e4161 (2019).
Figures
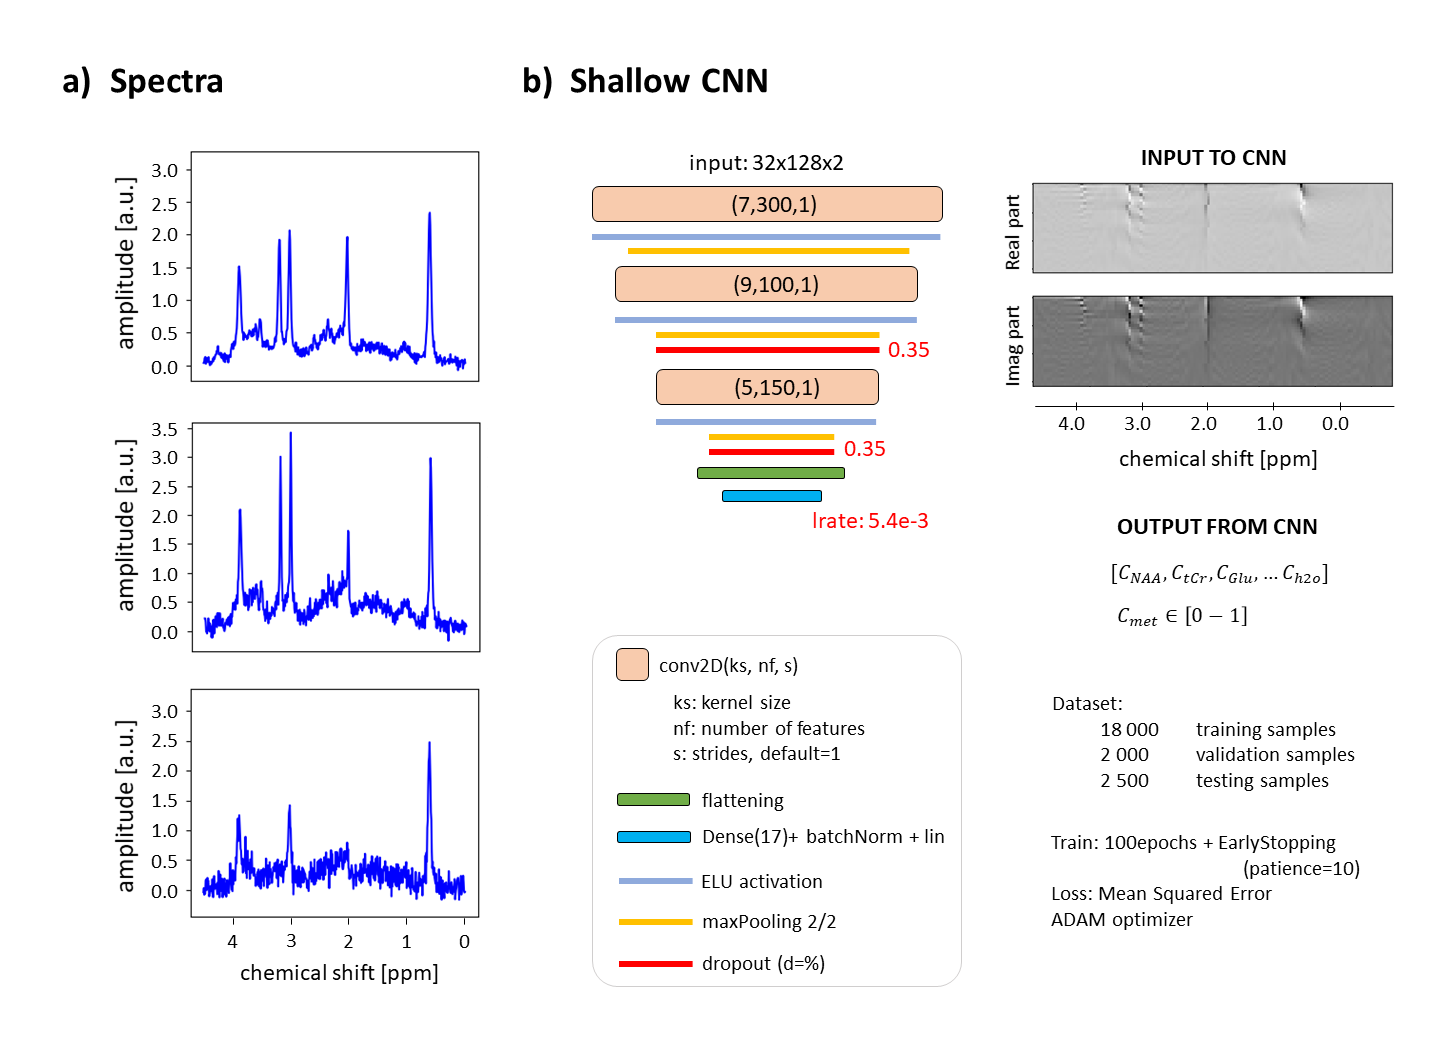
Fig.1: a) samples of noisy spectra from
dataset. b) Shallow CNN architectural details with sample of input spectrogram.
Dataset sizes and training details reported.
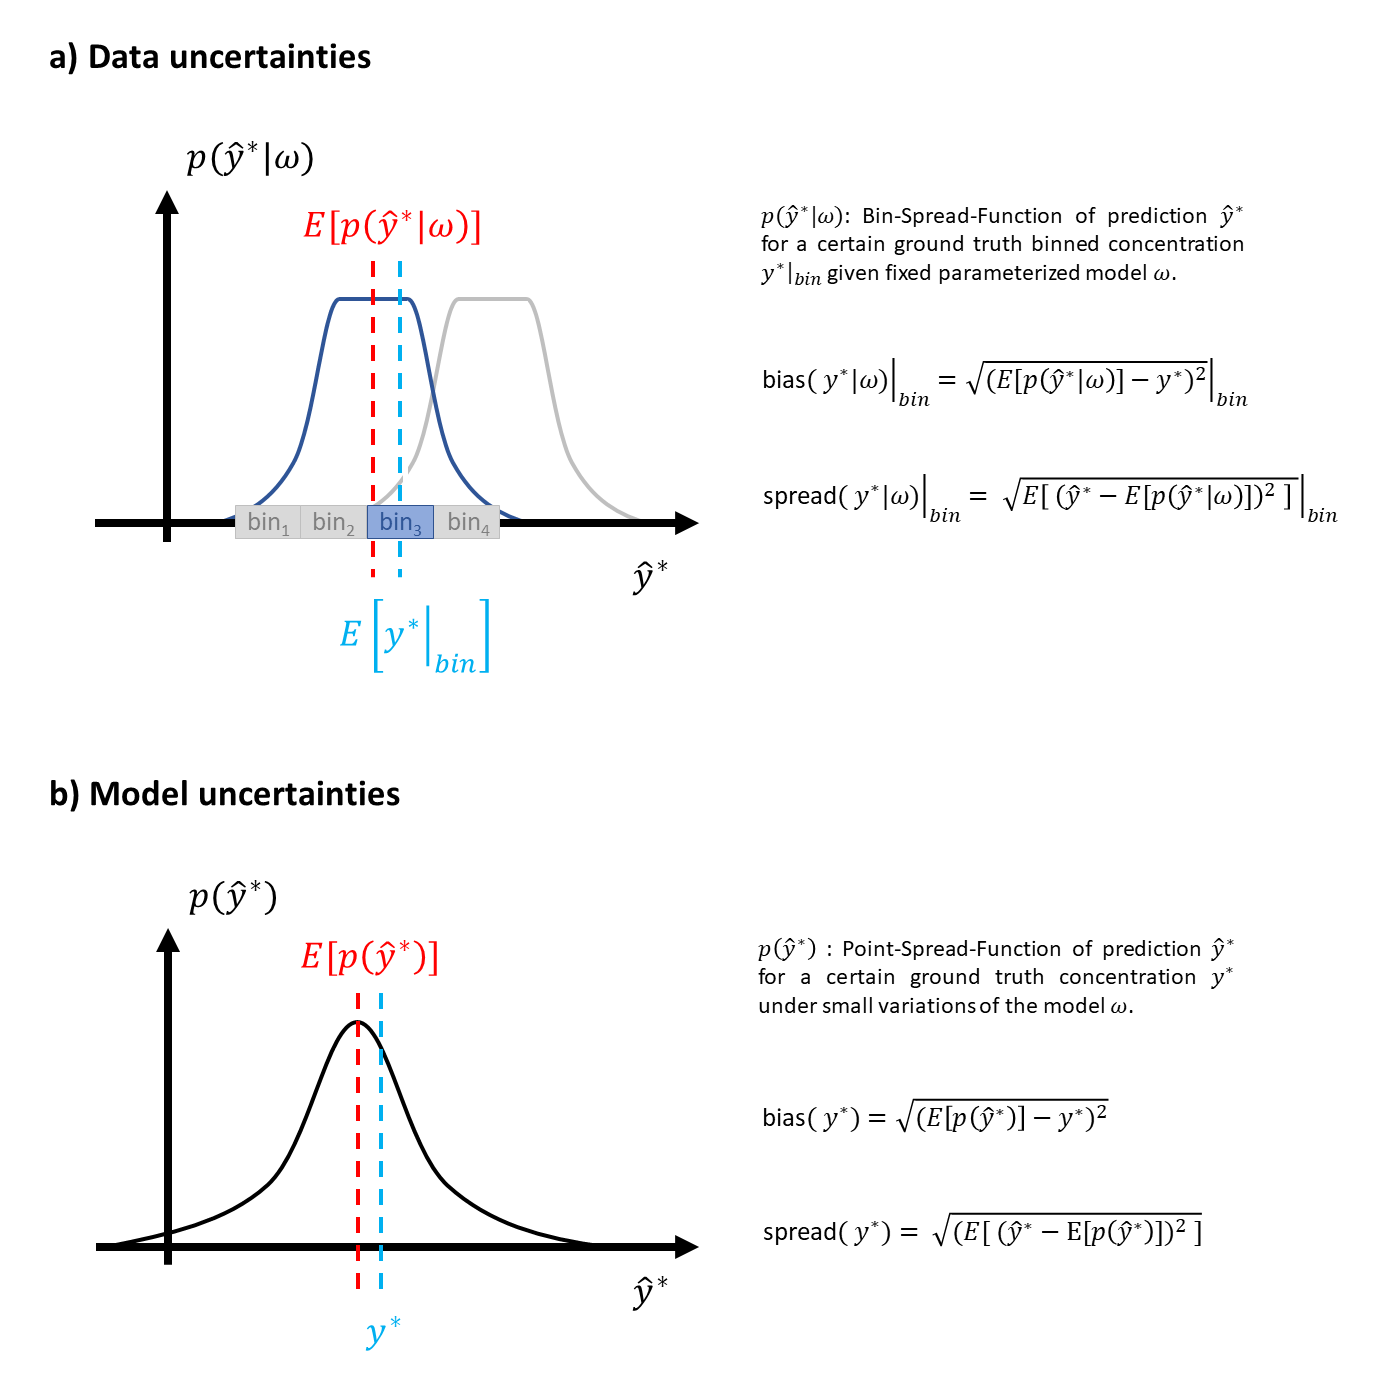
Fig.2: Distribution
of uncertainties: a) aleatoric and b) epistemic uncertainties. Bias represents
deviation from ground truth. Spread represents variability of predictions
around their center, the expected value (E[·] stands
for expected value of the distribution).
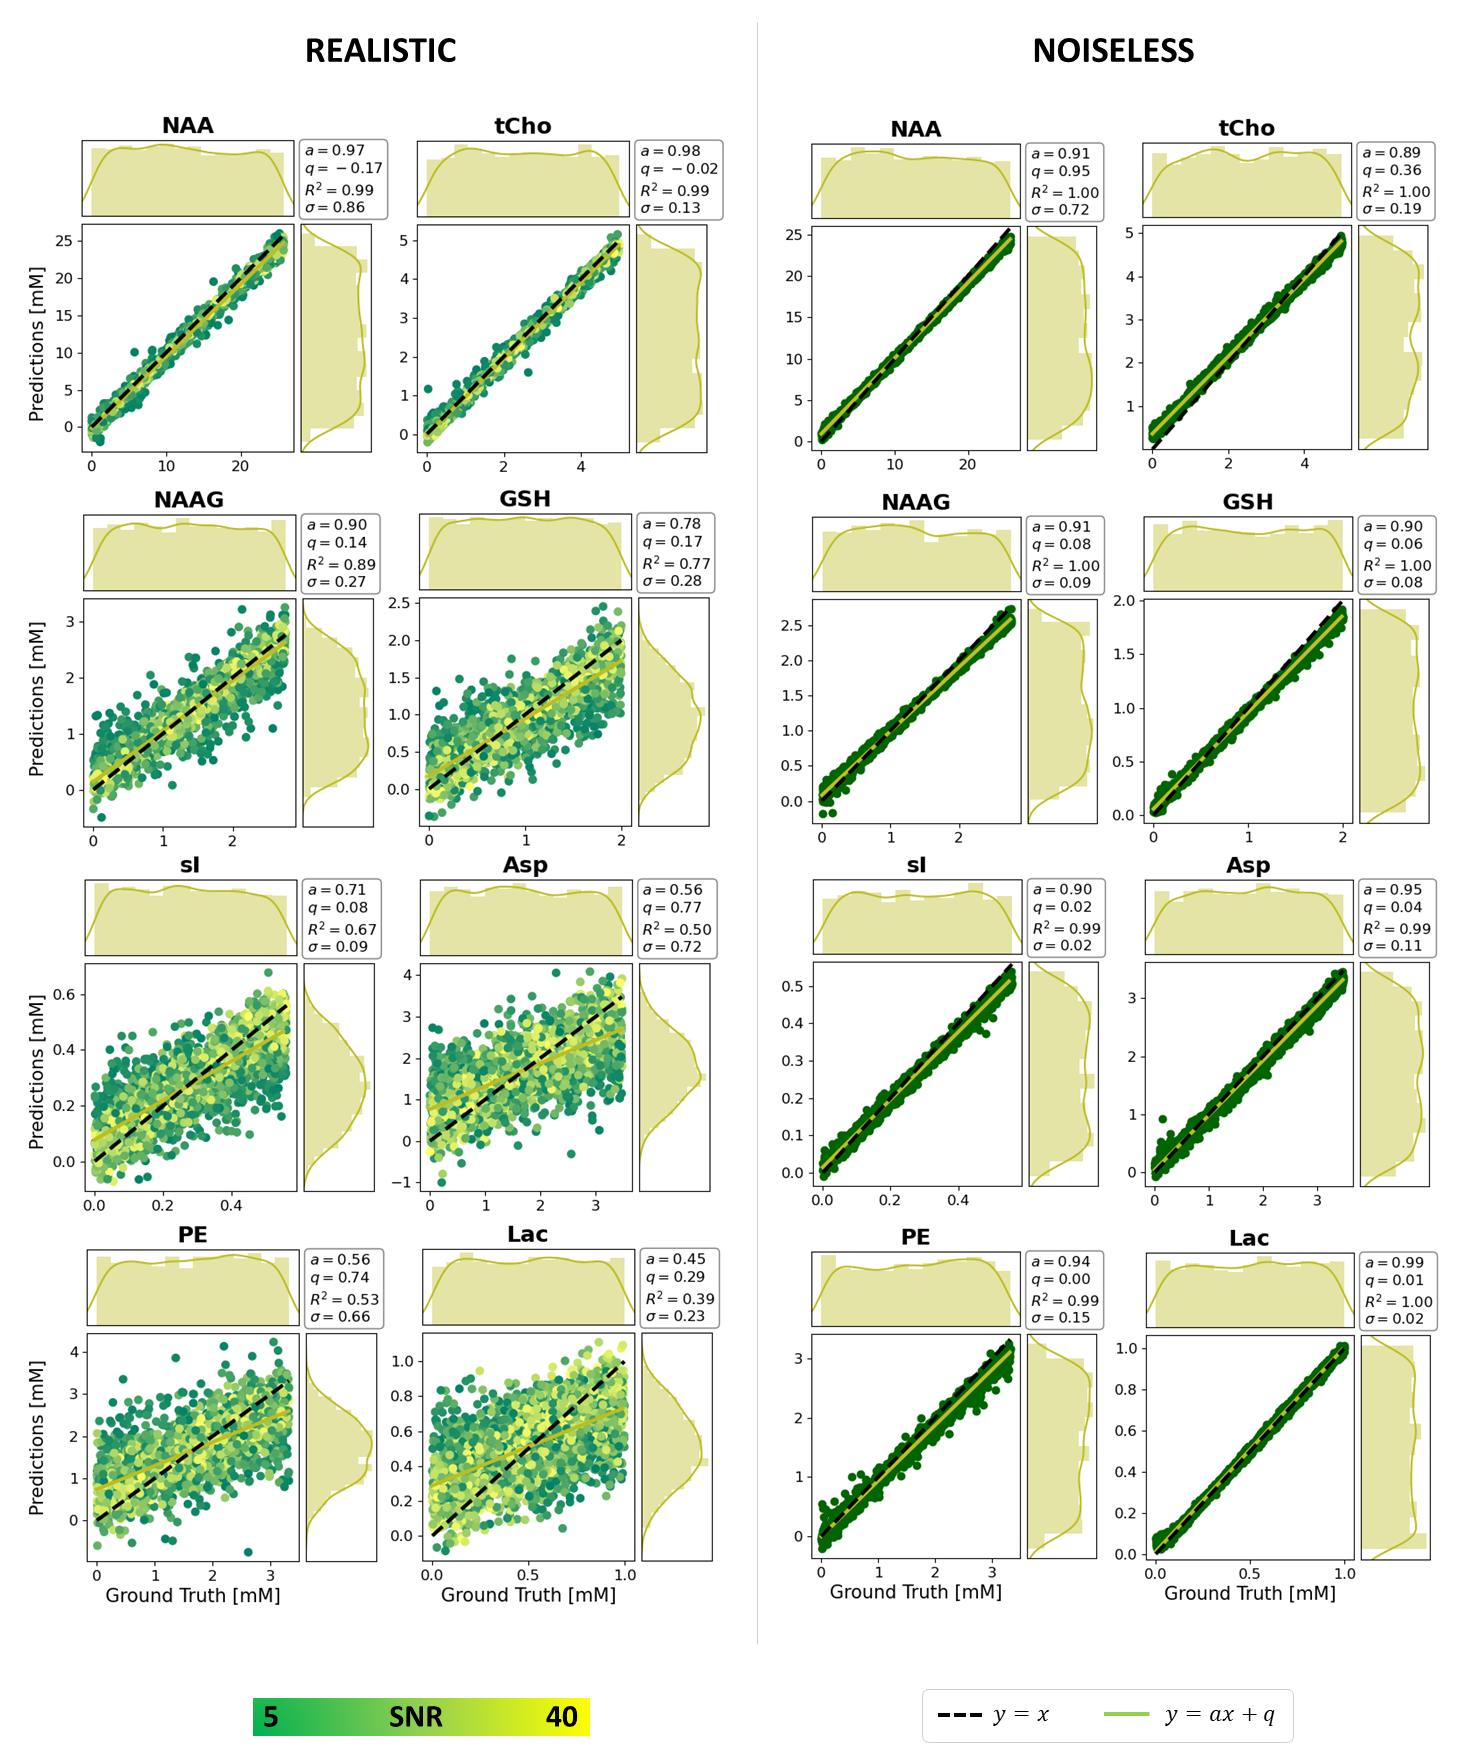
Fig.3: Maps and
marginal distributions of GT vs. predictions for 8 metabolites, 2 datasets
(realistic, noiseless). RMSE (σ) is reported as overall measure of variability
but ill-suited to represent prediction quality. A regression model (y = ax +
q) is also provided to judge prediction quality. R2 measures how good a linear model explains the overall
data. Mis-predictions can be monitored
either by decrease on a and R2, or by visual biases in distributions of
predictions (bell-shape).
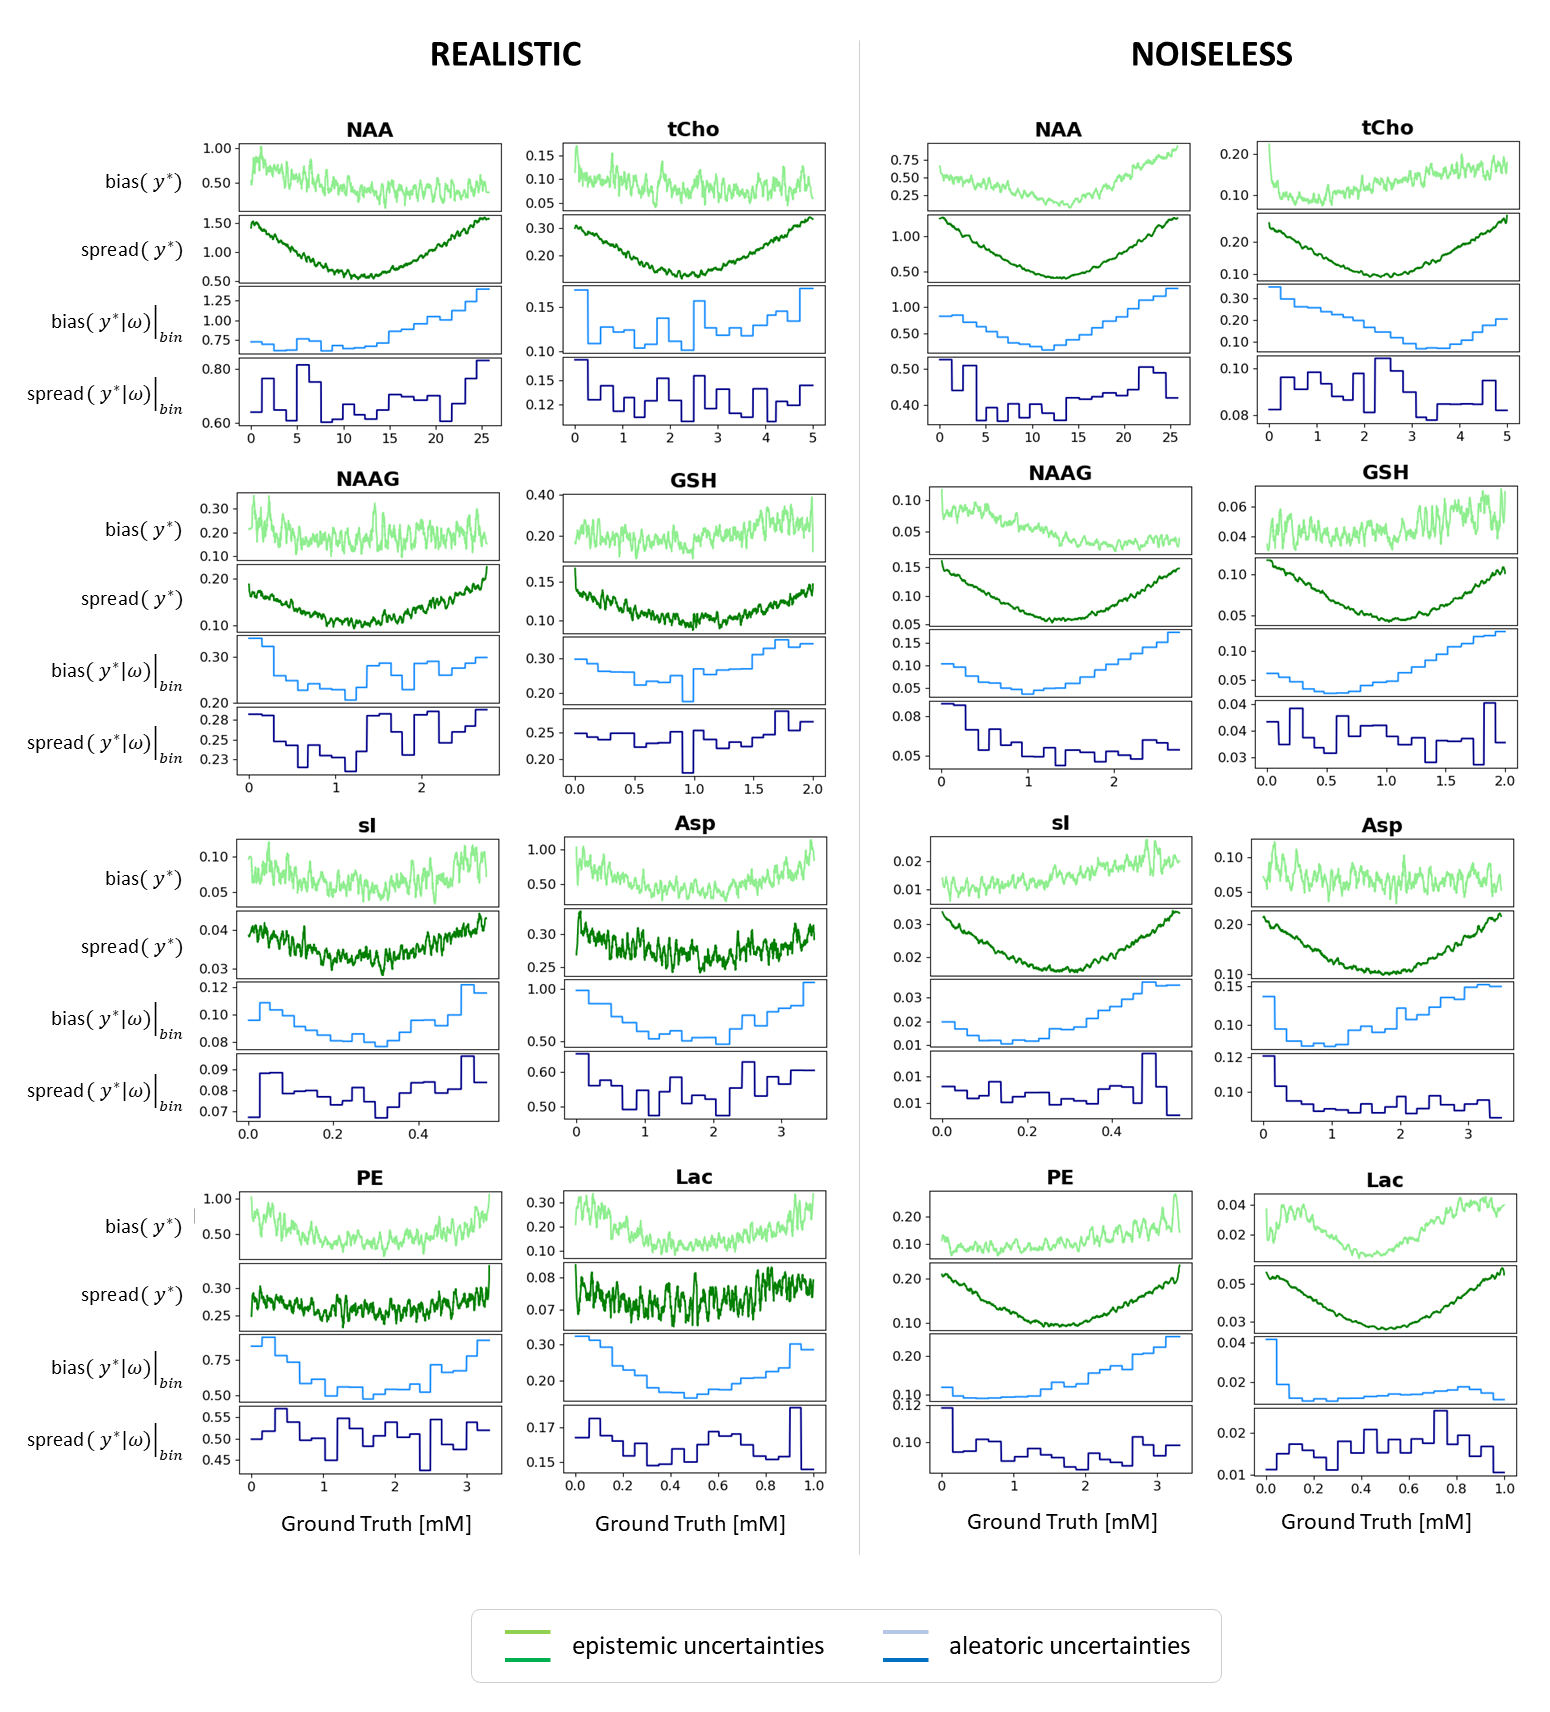
Fig.4: Bias and spread of
epistemic (green) and aleatoric (blue) uncertainties vs. GT values. Epistemic
spread displays a symmetric U-shape representing lower stability of predictions
with model variations at the concentration boundaries. Epistemic bias and aleatoric
spread show variable patterns with maxima mostly at the boundaries. Aleatoric
spread shows little variation. Realistic simulations show systematic trends
less clearly given the low relative SNR with additional variance.
DOI: https://doi.org/10.58530/2022/2617