2615
Detection of GABA dynamics with edited functional MR spectroscopy at 3 Tesla: a comparison of modelling strategies
Laura Beghini1,2, Francesca Saviola2, Stefano Tambalo2, and Jorge Jovicich2
1Department of Physics, Norwegian University of Science and Technology, Trondheim, Norway, Trondheim, Norway, 2CIMeC, Center for Mind/Brain Sciences, University of Trento, Rovereto (Trento), Italy, Trento, Italy
1Department of Physics, Norwegian University of Science and Technology, Trondheim, Norway, Trondheim, Norway, 2CIMeC, Center for Mind/Brain Sciences, University of Trento, Rovereto (Trento), Italy, Trento, Italy
Synopsis
There is increased interest in measuring brain GABA dynamics with MR spectroscopy, yet there is no consensus about robust and fast ways to do this. In this study, we evaluated how averaging affects GABA estimates when using different modelling strategies (Gannet, Osprey). Our results show that 60 MEGA-PRESS averages give valid concentration estimates, consistent with literature reports. Moreover, Gannet gives a GABA+/Cr measurement which should be more sensitive to concentration variations across regions and give lower temporal variability at rest relative to the GABA+/tCr measure in Osprey.
Introduction
In-vivo quantification of GABA dynamics using functional MR spectroscopy (fMRS) may help understanding of human brain function and provide insight into GABA-related disorders[1,2]. The most common spectroscopy technique for detecting GABA in-vivo is J-difference editing, which uses narrow bandwidth pulses to selectively excite target spins[3]. However, editing pulses also excite the signal from macromolecules (MM), which is therefore co-edited. Different fitting methods[4] and models[5] in multiple softwares are available for fitting the GABA signal, the MM, or the GABA+ signal (GABA plus MM). In this study, we: (i) evaluate the stability of the GABA+ quantification during rest when varying the acquisition time-window (i.e., number of averages) comparing Gannet and Osprey fitting methods; (ii) set a minimum number of averages (window) for a valid concentration estimate; (iii) measure expected differences[6,7] in GABA+/Cr ratio between PCC and DLPFC within the defined window, to further validate the result obtained in (ii); (iv) quantify, with the window, the intensity of GABA+ temporal fluctuations during rest in the posterior cingulate cortex (PCC) and right dorsolateral prefrontal cortex (DLPFC).Materials and Methods
Three healthy controls (2 males; age 37±17 years) underwent 3T MRI and fMRS (MAGNETOM Prisma, Siemens Healthcare, Erlangen, Germany) using a 64-channel head/neck receiver RF coil. Structural T1-weighted MPRAGE (TR=5s, TEs=2.88ms, voxel-size=1mm3 iso) and GABA-edited MEGA-PRESS (TR=2s, TE=68ms, editing pulses=1.9/7.5ppm, voxel size=3cm3, VAPOR water suppression, 320 averages)[8] data were acquired during rest. The voxel was positioned using an automated procedure (AVP)[9] in MNI coordinates (mm) for PCC [0, -54, 26] and right DLPFC [32, 24, 22] (Fig. 1). Before each MRS acquisition, a water reference was acquired with the same MEGA-PRESS protocol, deactivating the water suppression sequence (32 averages). MRS data were analyzed using Gannet[10] (v 3.1.5) and Osprey[11] (v 1.0.1). For the first aim, the data were processed iteratively, adding a MEGA-PRESS average (edit-ON and edit-OFF) to the previous at every iteration. The coefficients of variation (CV=SD/mean) in time were computed for each modelling strategy, to evaluate the measurement stability. For the second aim, we compared our Gannet results with Mikkelsen et al.[8] (data collected in PCC with the same acquisition protocol, scanner and software) and our Osprey results with Zöllner et al.[5] (data collected in PCC with the same acquisition protocol, and software settings). The optimal time-window was then fixed and used to address the third aim, where GABA concentrations were derived by moving the window in time at steps of 10 MEGA-PRESS. The Z-test was computed to compare the concentration estimate for the two voxel positions. For the fourth aim GABA fluctuations were quantified with the CVs on the moving-window analysis results. The analysis in Osprey was run twice: (1) deactivating the MM modelling (Osprey), giving GABA/Cr estimates; (2) using the GABA soft model with 0.55 baseline knot spacing to fit the macromolecules signal (Osprey MM)[5].Results
Fig. 2 shows the GABA estimates from a representative subject in PCC and DLPFC using all acquisition points (320 averages) and three analyses pipelines. Fig. 3 shows the effects of GABA estimation when varying the number of averages. The across-time across-subjects CVs for the concentration estimates are: Gannet (GABA+/Cr: PCC=6.4%, DLPFC=9.7%), Osprey-MM (GABA+/tCr: PCC=20.2%, DLPFC=20.5%), Osprey (GABA/tCr: PCC=50.0%, DLPFC=67.1%). The GABA+/Cr estimates computed when considering 60 MEGA-PRESS averages are (across-subject mean: PCC=0.112±0.004, DLPFC=0.098±0.008) with Gannet and (across-subject mean: PCC=0.35±0.05, DLPFC=0.32±0.03) with Osprey MM. The results from both softwares are comparable with published results. A set of 60 MEGA-PRESS averages should also guarantee a minimum GABA+ SNR (Gannet estimate=12, Osprey estimate=8) in both regions. Fig. 4 shows the time-course and temporal GABA variability estimates during rest in PCC and DLPFC. The comparison of mean GABA+/Cr (average across 11 measures, each of 60 averages) between PCC and DLPFC gave the following z-scores: for Gannet, subj01=3.54, subj02=1.34, subj03=2.34. For OspreyMM, subj01=0.23, subj02=1.43, subj03=0.87. The temporal CV was: Gannet (GABA+/Cr: PCC=6.0%, DLPFC=8.6%), Osprey MM (GABA+/tCr: PCC=17.5%, DLPFC=27.8%), Osprey (GABA/tCr: PCC=20.6%, DLPFC=28.1%).Discussion and Conclusions
A minimum of 60 MEGA-PRESS averages gave GABA+/Cr estimates in PCC consistent with previous studies that used 160 MEGA-PRESS averages[5,6], suggesting, for the first time, a lower time-resolution limit to investigate the GABA temporal fluctuations in fMRS experiments. However, as in previous studies, the different fitting methods (Osprey and Gannet) showed poor agreement[4,8,9]. Gannet gives a higher temporal stability in GABA+/Cr estimates compared to Osprey, both when considering the effects of new data while increasing the temporal window, and when considering fluctuations at rest along the time course with a fixed window in two brain regions. Higher Z-scores with Gannet also suggest a higher sensitivity to measure GABA+/Cr fluctuations within and across brain regions. In conclusion, a fMRS protocol consisting of 60 MEGA-PRESS averages per block of GABA edited MRS acquisitions with TR=2s appears to be promising to study GABA dynamics at 3T.Acknowledgements
Dipartimento di Eccellenza project 2018-2022 (Italian Ministry of Education, University and Research).References
- Duncan NW, Wiebking C, Northoff G. Associations of regional GABA and glutamate with intrinsic and extrinsic neural activity in humans—a review of multimodal imaging studies. Neurosci Biobehav Rev. 2014;47:36-52. doi:10.1016/j.neubiorev.2014.07.016
- Kiemes A, Davies C, Kempton MJ, Lukow PB, Bennallick C, Stone JM and Modinos G (2021) GABA, Glutamate and Neural Activity: A Systematic Review With Meta-Analysis of Multimodal 1H-MRS-fMRI Studies. Front. Psychiatry 12:644315. doi: 10.3389/fpsyt.2021.644315
- Mullins, P. G., McGonigle, D. J., O'Gorman, R. L., Puts, N. A., Vidyasagar, R., Evans, C. J., & Edden, R. A. (2014). Current practice in the use of MEGA-PRESS spectroscopy for the detection of GABA. Neuroimage, 86, 43-52.
- Near, J., Harris, A. D., Juchem, C., Kreis, R., Marjańska, M., Öz, G., Slotboom, J., Wilson, M., & Gasparovic, C. (2021). Preprocessing, analysis and quantification in single-voxel magnetic resonance spectroscopy: experts' consensus recommendations. NMR in biomedicine, 34(5), e4257. https://doi.org/10.1002/nbm.4257
- Zöllner, H. J., Tapper, S., Hui, S., Barker, P. B., Edden, R., & Oeltzschner, G. (2021). Comparison of linear combination modeling strategies for edited magnetic resonance spectroscopy at 3 T. NMR in biomedicine, e4618. Advance online publication. https://doi.org/10.1002/nbm.4618
- Craig, M. M., Misic, B., Pappas, I., Adapa, R. M., Menon, D. K., & Stamatakis, E. A. (2021). Propofol sedation-induced alterations in brain connectivity reflect parvalbumin interneurone distribution in human cerebral cortex. British Journal of Anaesthesia, 126(4), 835–844. https://doi.org/10.1016/j.bja.2020.11.035
- Hangel, G., Strasser, B., Považan, M., Heckova, E., Hingerl, L., Boubela, R., Gruber, S., Trattnig, S., & Bogner, W. (2018). Ultra-high resolution brain metabolite mapping at 7 T by short-TR hadamard-encoded FID-MRSI. NeuroImage, 168, 199–210. https://doi.org/10.1016/j.neuroimage.2016.10.043
- Mikkelsen M, Barker PB, Bhattacharyya PK, et al. Big GABA: Edited MR spectroscopy at 24 research sites. Neuroimage. 2017;159:32-45. doi:10.1016/j.neuroimage.2017.07.021
- Woodcock EA, Arshad M, Khatib D, Stanley JA. Automated Voxel Placement: A Linux-based Suite of Tools for Accurate and Reliable Single Voxel Coregistration. J Neuroimaging Psychiatry Neurol. 2018;3(1):1-8. doi: 10.17756/jnpn.2018-020. Epub 2018 Feb 8. PMID: 29911203; PMCID: PMC5998677.
- Oeltzschner, G., Zöllner, H. J., Hui, S. C., Mikkelsen, M., Saleh, M. G., Tapper, S., & Edden, R. A. (2020). Osprey: Open-source processing, reconstruction & estimation of magnetic resonance spectroscopy data. Journal of Neuroscience Methods, 343, 108827.
- Edden, R. A., Puts, N. A., Harris, A. D., Barker, P. B., & Evans, C. J. (2014). Gannet: A batch-processing tool for the quantitative analysis of gamma-aminobutyric acid–edited MR spectroscopy spectra. Journal of magnetic resonance imaging : JMRI, 40(6), 1445–1452. https://doi.org/10.1002/jmri.24478
Figures
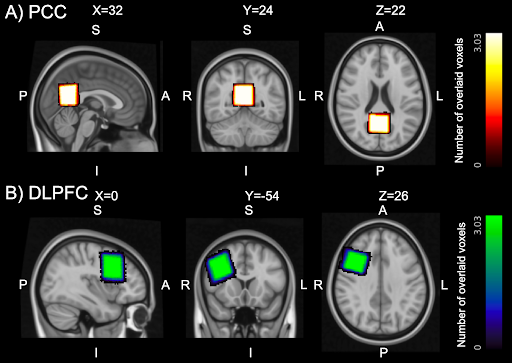
Fig 1: Voxel placement consistency across three subjects in MNI space. On panel A and B the placement consistency in posterior cingulate cortex (PCC), and right dorsolateral prefrontal cortex (rDLPFC) are shown respectively. The lighter color represents the region where we have complete overlap between the subjects voxels, the darker color represents no overlap between voxels. In the image the MNI coordinates for the two voxel locations are shown.
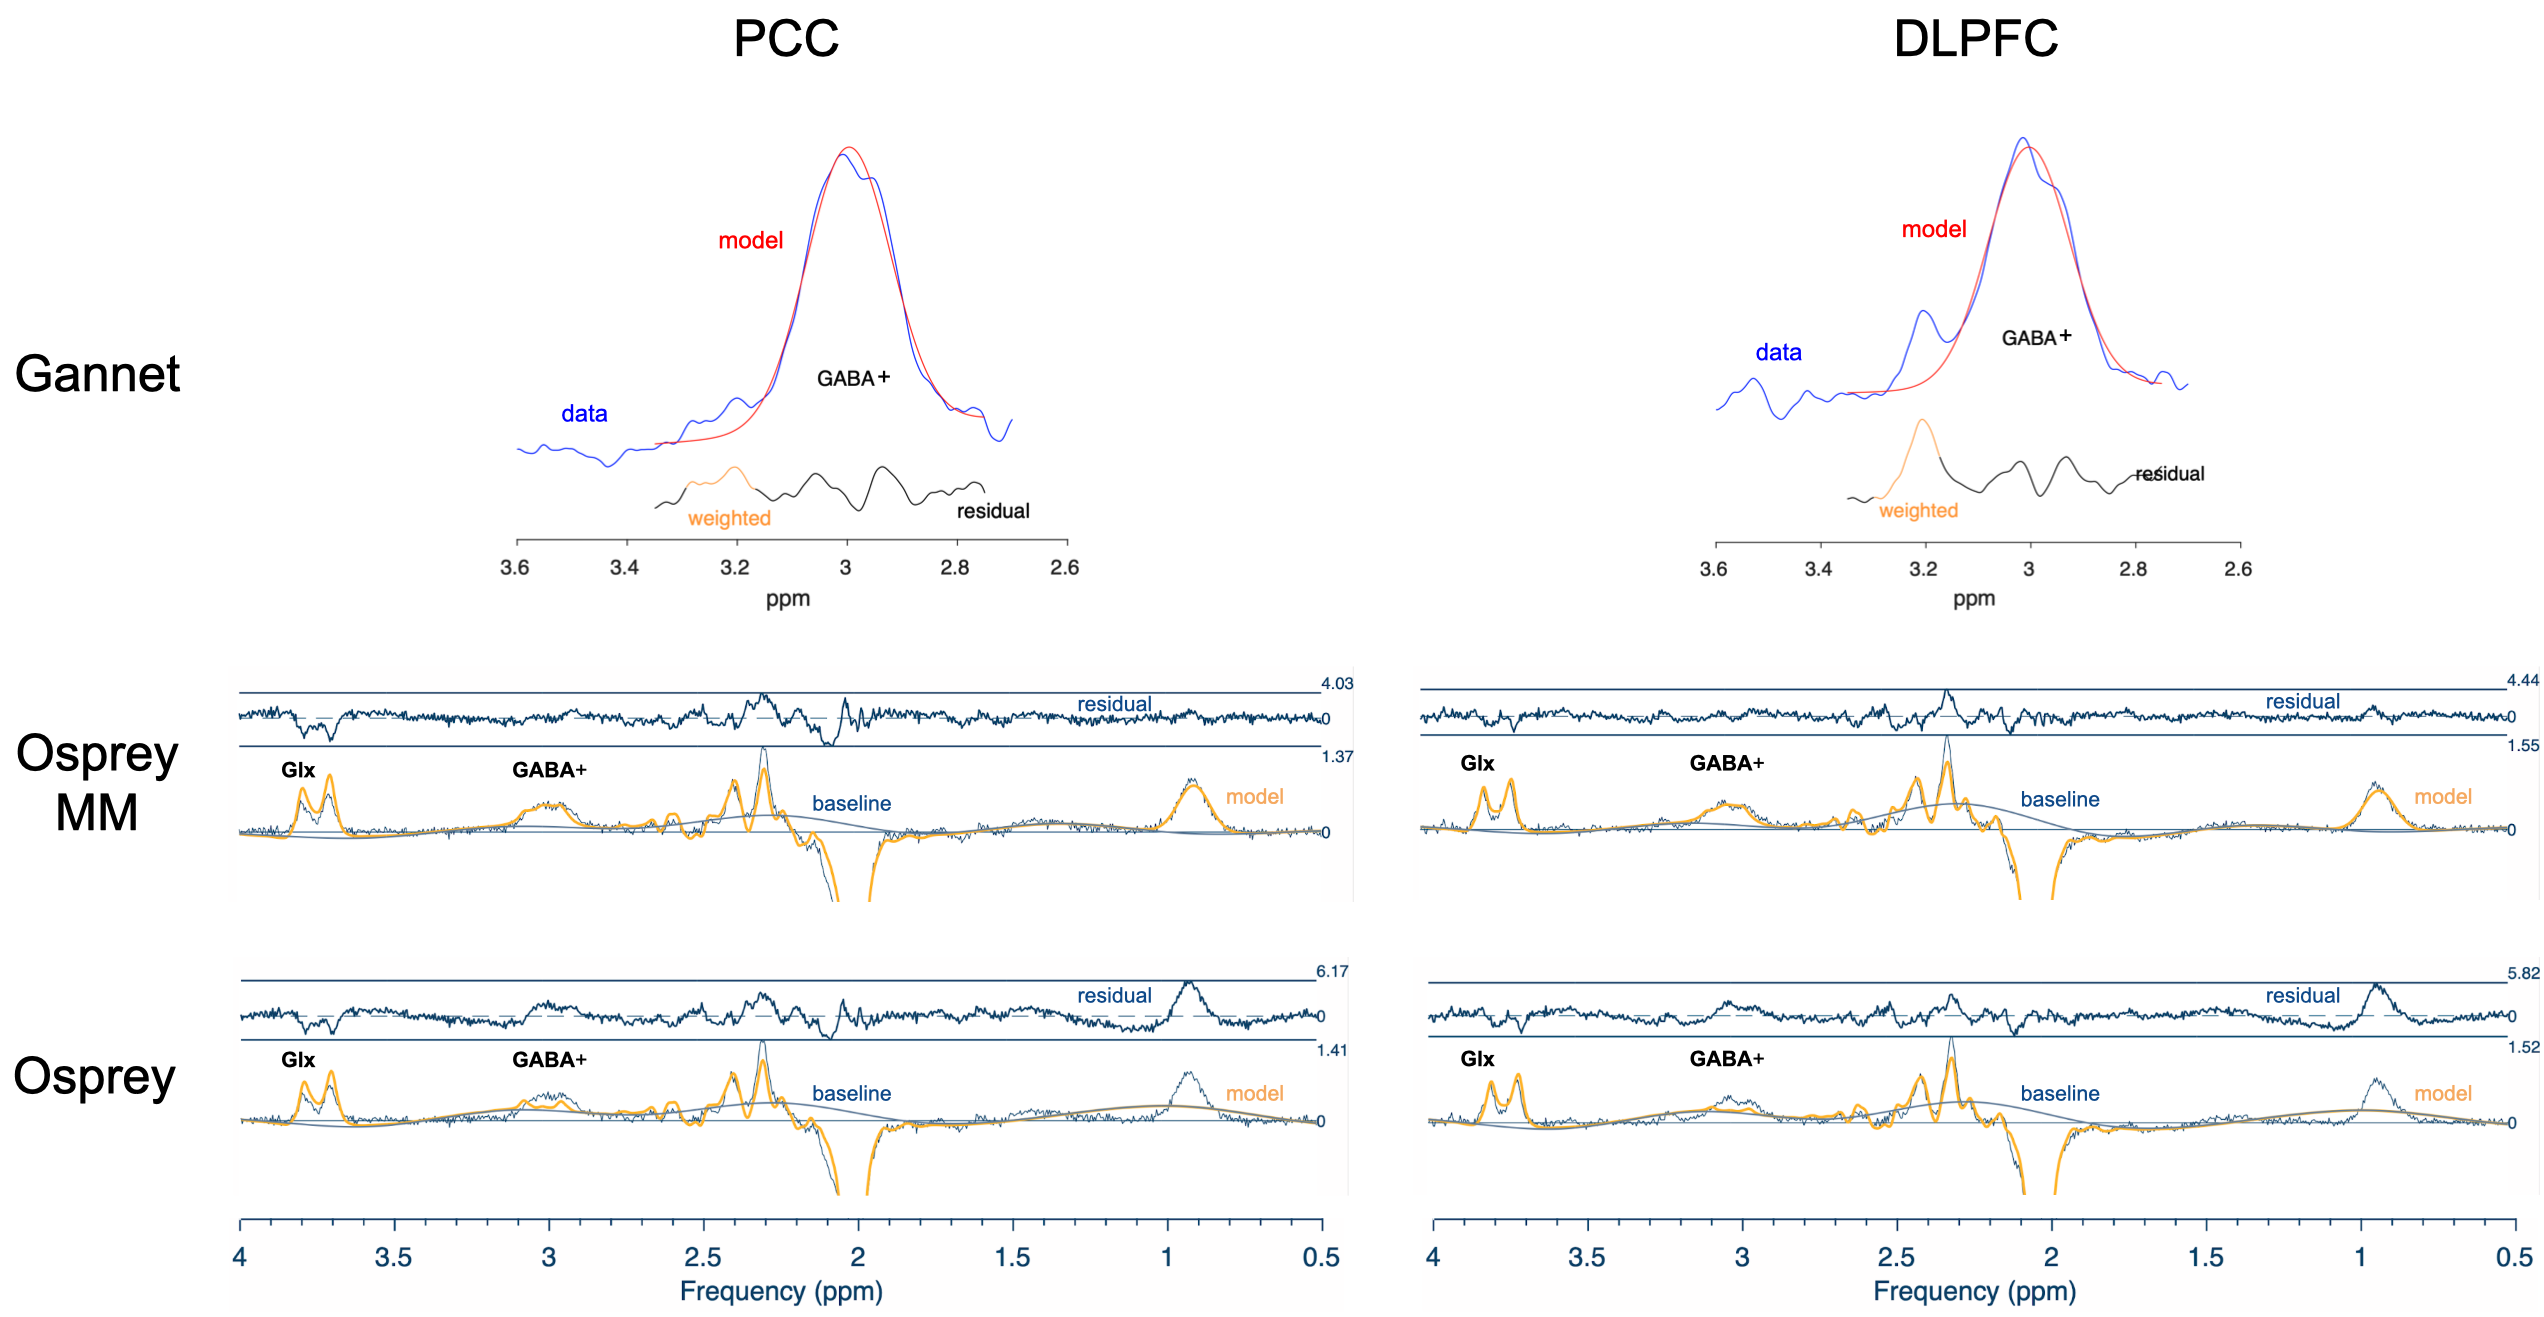
Fig 2: Sample GABA fits from PCC and DLPFC. MR spectra acquired with the MEGA-PRESS sequence (320 averages) in PCC (Posterior Cingulate Cortex MNI (mm): [0, -54, 26]) and right DLPFC (Dorsolateral Prefrontal Cortex MNI (mm): [32, 24, 22]) on a representative subject. The spectra are overlaid with the Gannet fit and Osprey with and without macromolecules (MM) modelling fits. In Gannet, the fitting interval was [3.35, 2.75] ppm, while in Osprey it was [4.0, 0.5] ppm. Also the residuals are shown.
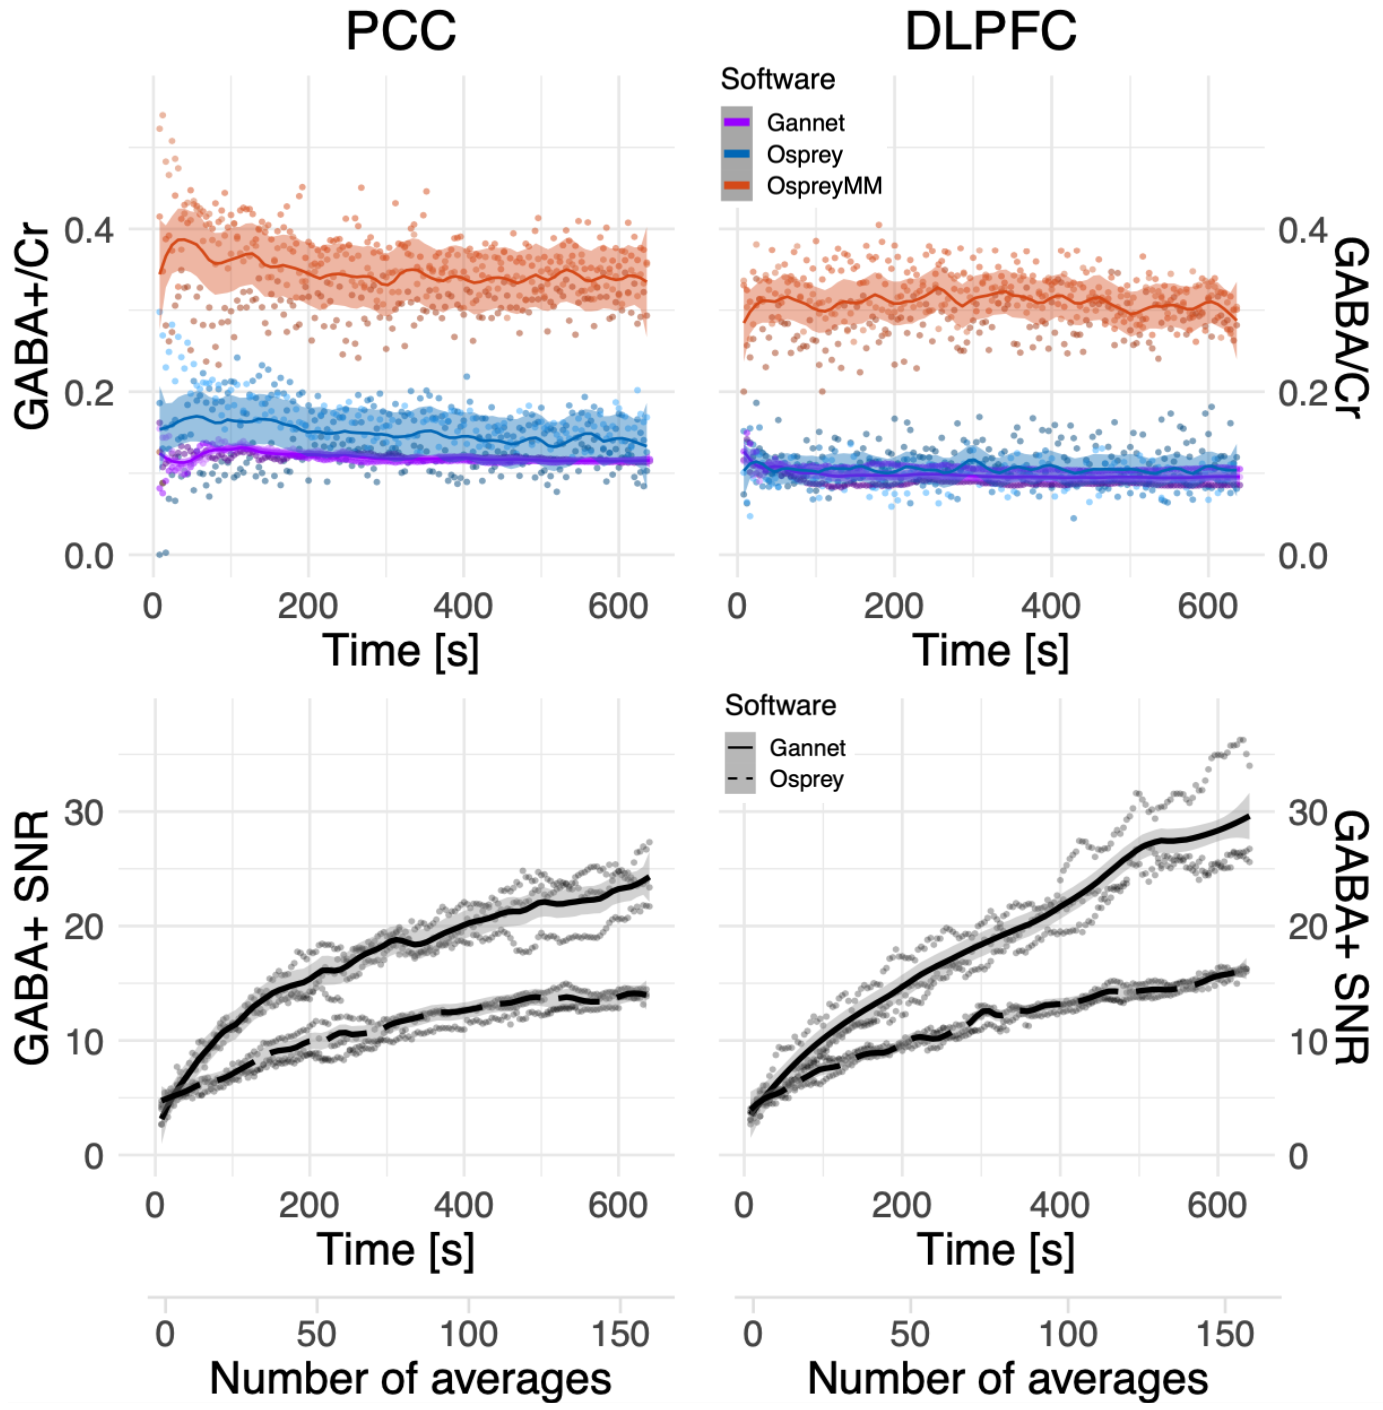
Fig 3: Averaging effects on GABA estimates as function processing pipelines. Each point represents the value obtained analysing a number of averages equal to its abscissa, for one subject (n=3), using each of the three pipelines (Gannet, Osprey, Osprey MM). When using Osprey without macromolecules modelling, only the GABA/tCr value can be measured (in blue). The GABA+ SNR estimate in Osprey is independent from MM modelling, therefore values are the same for both analysis settings (dashed lines).
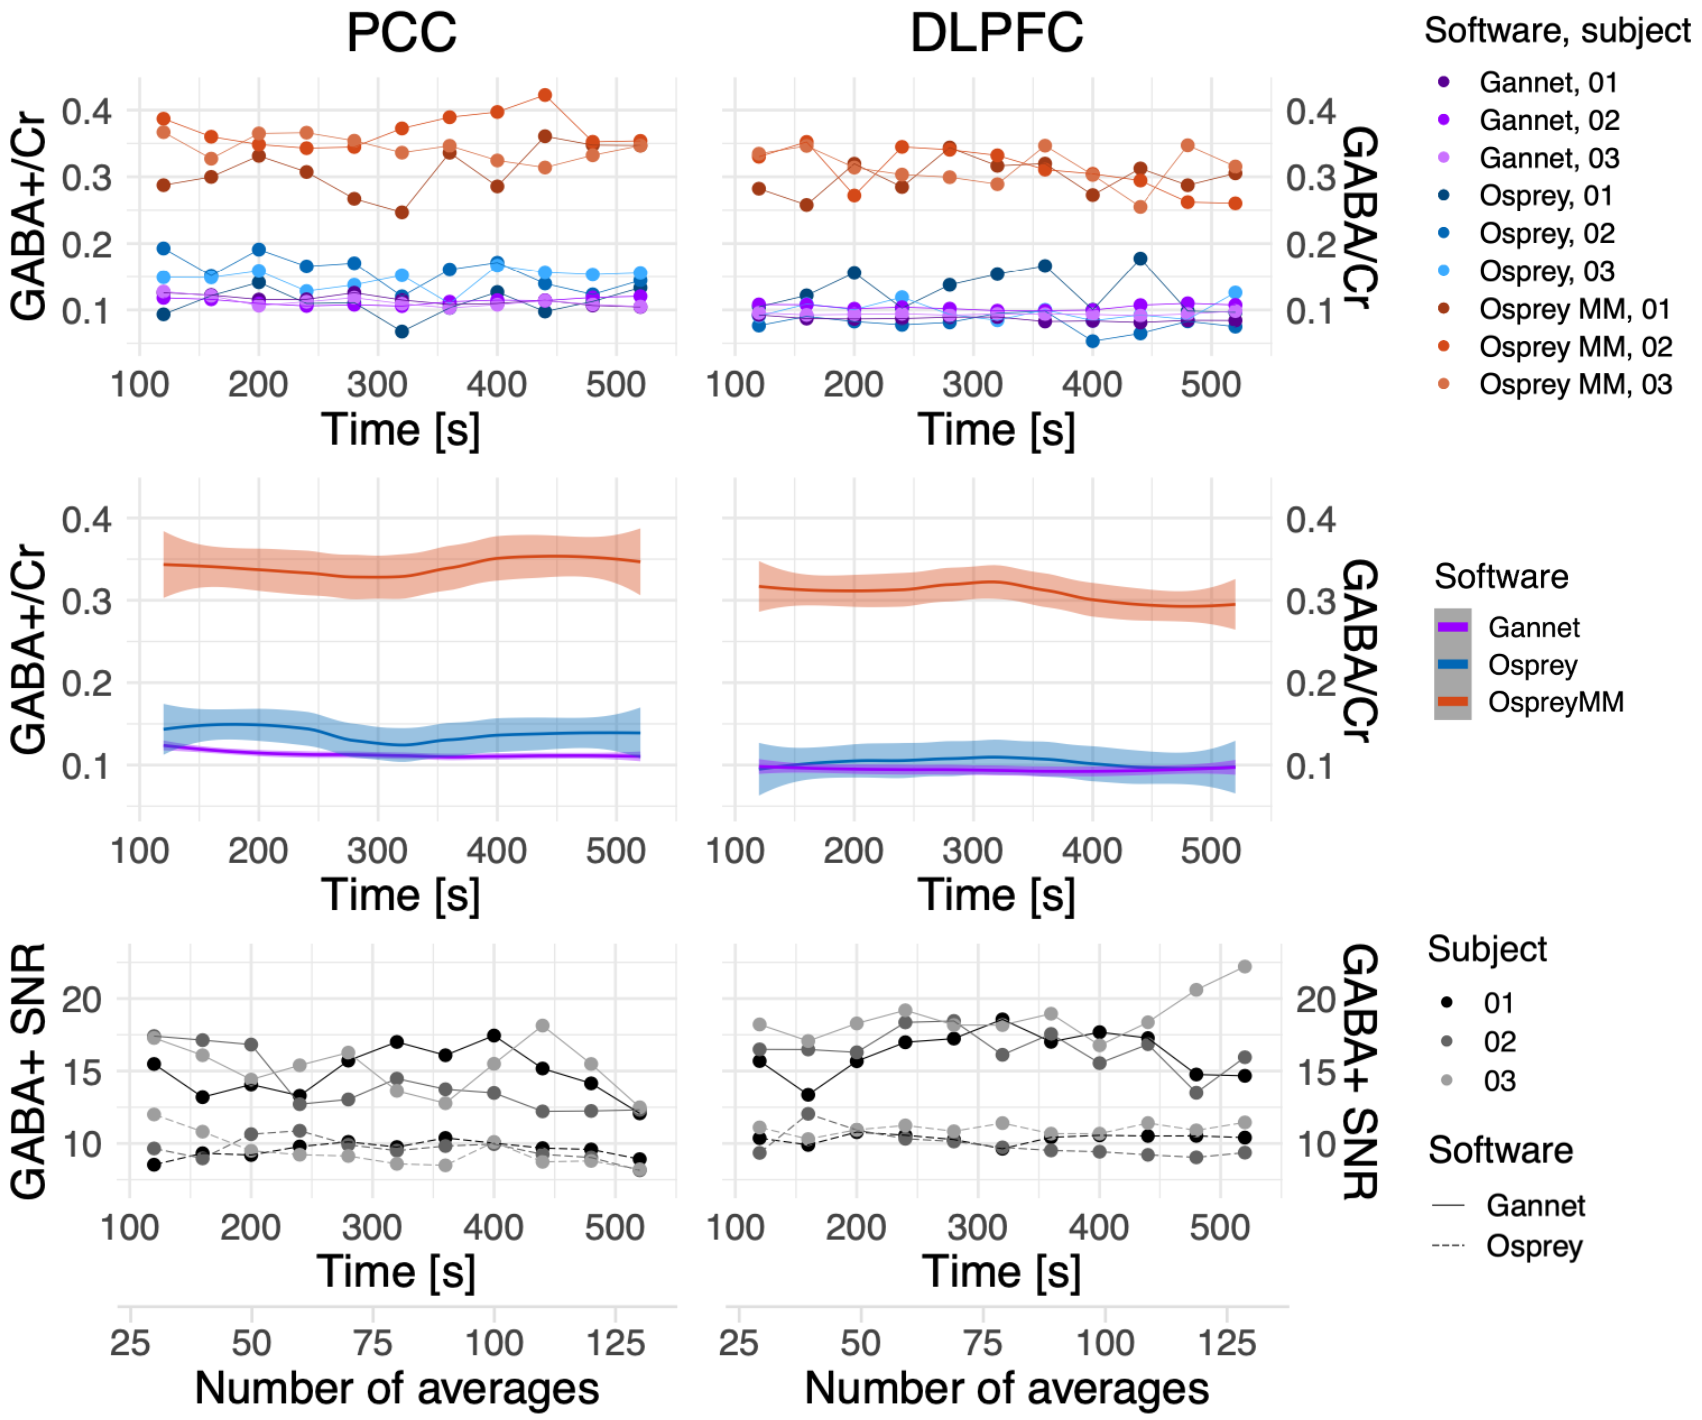
Fig 4: Temporal variability of GABA estimates during rest in PCC and DLPFC. Each point represents the value obtained analysing 60 MEGA-PRESS averages collected in a symmetrical interval around a time point equal to its abscissa, for one subject. When using Osprey without MM modelling only the GABA/tCr value can be measured (in blue). The GABA+ SNR estimate in Osprey is independent by the used macromolecules modelling (dashed lines). The middle plot represents the 3-subjects average.
DOI: https://doi.org/10.58530/2022/2615