2613
Monitoring the complexification of cerebellar and thalamic cells during early development with diffusion-weighted MR spectroscopy1Wellcome Centre for Integrative Neuroimaging, FMRIB, Nuffield Department of Clinical Neurosciences, University of Oxford, Oxford, United Kingdom, 2Cardiff University Brain Research Imaging Centre (CUBRIC), School of Psychology, Cardiff University, Cardiff, United Kingdom, 3School of Computer Science and Informatics, Cardiff University, Cardiff, United Kingdom, 4Mouse Imaging Centre, The Hospital for Sick Children, Toronto, ON, Canada, 5Department of Medical Biophysics, University of Toronto, Toronto, ON, Canada
Synopsis
Monitoring non-invasively the development of brain cells in the neonate and infant brain could be of interest for neurodevelopmental disorders. In this work, we assess whether diffusion-weighted MR spectroscopy (DWMRS) has the potential to follow cerebellar and thalamic cells development in the healthy rat brain from P5 to P30. Results show that DWMRS is sensitive to microstructural changes in the developing brain. The modeling of the data shows a cell growth and complexification (from P15 to P30), and underlies the need of different modeling hypotheses at earlier time points.
Introduction
The brain microstructure is heterogeneous, and develops differently across brain regions. Diffusion-weighted MR spectroscopy (DWMRS) measures diffusion properties of intracellular brain metabolites, and, coupled to modeling, it has been shown to have the potential of quantifying neuronal or glial morphology1. Defects in brain cells’ morphological development are observed in some neurodevelopmental disorders2. The aim of this study is to assess whether DWMRS can be used to monitor the complexification of brain cells during early development in the healthy rat. Thalamus and cerebellum were chosen because their cells develop at different pace3,4.Methods
Animals: 18 Sprague-Dawley rats (from 3 litters) were scanned at P5, P10, P15, P20 and P30. Pups were anesthetised with 1-1.5% isoflurane in oxygen. Respiration and temperature were monitored with a breathing pillow and a cutaneous probe, and respectively kept at 50-70rpm and 36-37˚C during scanning. Pups were gently held with foam and protected tape to minimise motion.Acquisitions: Data were acquired with a STELASER sequence5 (TE=34ms), implemented on a 7T Biospec Bruker MRI scanner (Paravision 360.1, max gradient strength=660mT/m), equipped with a mouse quadrature cryoprobe. The voxel was placed in the cerebellum for 9 pups, and in the thalamus for the other 9 pups. Voxel size was increased with age to match with cerebellar growth (P5, 22.05µl; P10, 29.95µl; P15, 48.75µl; P20/P30, 54.60µl). Diffusion-weighted spectra were acquired at 4 diffusion times (td = [112.3 512.3 762.3 1012.3]ms), and 2 b-values: a non-nul “b0” (b0=[0.035 0.170 0.260 0.350]ms/µm2), used as a crusher for the stimulated echo, and b0+3 ms/µm2 (16 directions). Higher b-values were also acquired at the shortest diffusion time (td=112.3ms, b=[0.035 3.035 6 10 20]ms/µm2, 16 directions). A T2-TurboRARE was acquired in the beginning of the session to position the voxel.
Analysis: After coil combination (phased from the water signal), individual repetitions were corrected for phase and frequency drifts and abnormally low signal averages were removed prior to averaging. Water residual was removed. Spectra were fitted with LCModel (simulated basis set, including a macromolecules (MM) baseline acquired experimentally). Macromolecular signal attenuation was used to discard signal attenuations corrupted by motion. The spectroscopic profile was extracted from the b0 spectrum at td=112.3ms (Fig1). Concentrations are given relative to [tCr] (Fig1). In the thalamus [tCr] was scaled with age according to6. In the cerebellum, it was scaled at P30 from7, and scaled down at younger ages to obtain a similar macromolecular content in both thalamus and cerebellum.
Results & Discussion
Metabolic profile: It drastically changes between P5 and P30 (Fig1), matching literature6. As expected, [tNAA] and [Glu] increases, [PE] decreases in both regions, [Tau] decreases mostly in the thalamus. [MM] increases of ~25% between P5 and P30, matching6. For the purpose of this study, these drastic changes mean that usual assumptions about metabolic compartmentation might not hold during early brain development (P5/P10).DWMRS data quality: Spectral quality was decent at all ages (exemple at P5 and P15 in Fig2), but diffusion-weighted spectra at P5 appeared particularly noisy. The MM strong signal attenuation at P5 in the cerebellum points toward a higher intracellular diffusivity, or more likely a residual motion artifact in the cerebellum (Fig3A). DWMRS results from P5 are therefore less reliable and must be interpreted cautiously (Fig3B-E).
Diffusion properties: Diffusion properties differ between both regions at each age. The overall lower apparent diffusivity in the cerebellum (notably tCr and Glu) is in good agreement with simulations of water diffusion in Purkinje cells8. Although any interpretation at this stage is hypothetical, ADCtCr(td) decreases at P5/P10, reflecting a diffusion in smaller structures than at P20/P30 where ADCtCr(td) is flatter. The trend seems similar for the other metabolites, but curves are noisy. The trend of ADCTau(td) is the same at all ages, but values are lower and lower, indicating a more hindered diffusion, in such a strong manner that it might reflect a change of compartmentation with age.
Future steps, biophysical modeling: Modeling will likely require some adjustments as usual assumptions used in adult animals (typically, metabolites diffusing mostly in fibers9) might not hold at younger ages. For curiosity, Fig4A shows the results of a randomly oriented infinite cylinders model applied to signal attenuations reported in Fig3B/C. The diffusion time (112ms) is slightly long for a proper radius estimation10, but Dintra estimation is reliable (although modulated by branching, spines and leaflets11). The very high radii values obtained at P5/P10 for almost all conditions likely reflects the violation of the infinite cylinder hypothesis. Then, to assess cell complexity, the computational model in1,12 was applied to ADCtCr(td) and ADCtNAA(td) (from Fig3C/D). The number of embranchements and the segment length as a function of age are shown in Fig4B. Again, the model likely does not hold at P5/P10, but from P15, where usual assumptions might hold, we see a gradual complexification of both thalamic and cerebellar cells. A visualisation of this complexification is shown in Fig5.
Conclusion
Although acquisitions at P5 might be unreliable and the modeling framework used in this study is not well adapted yet for very young animals, this study shows that DWMRS is potentially sensitive to the brain cells growth and complexification postnatally.Acknowledgements
This work was funded by an internal WIN (Wellcome centre for Integrative Neuroimaging) grant. MP is supported by UKRI Future Leaders Fellowship (MR/T020296/1).References
[1] Palombo et al., PNAS, 2016
[2] Yamashiro, i-Science, 2020
[3] Takeuchi et al., J. Neuroscience, 2014
[4] Beekhof et al., eLife, 2021
[5] Ligneul et al., MRM, 2017
[6] Tkac et al., MRM, 2003
[7] Tkac et al., MRM, 2004
[8] Palombo et al., NeuroImage, 2019
[9] Najac et al., NeuroImage, 2014
[10] Nilsson et al., NMR in Biomed, 2017
[11] Palombo et al., NeuroImage, 2018
[12] Ligneul et al., NeuroImage, 2019
Figures
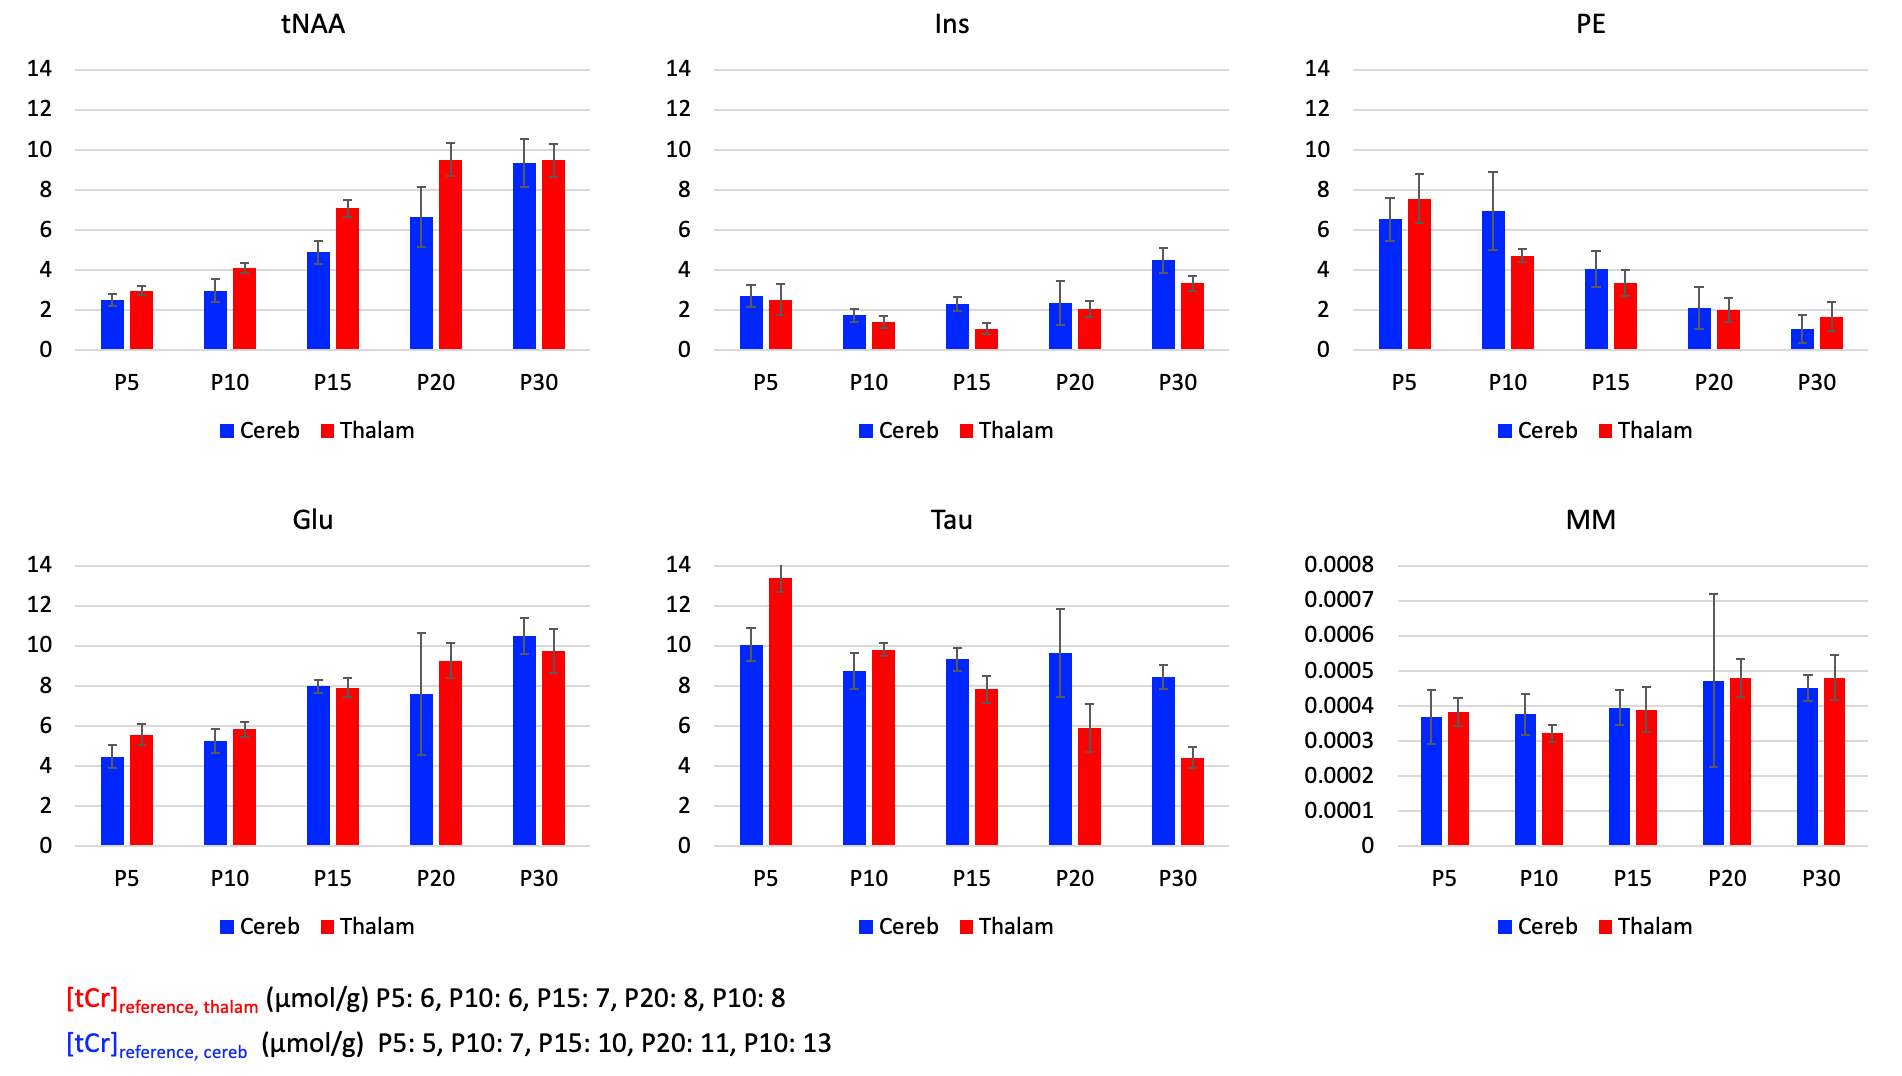
Figure 1:
Concentration relative to total creatine concentration [tCr], given from P5 to P30 for total N-acetylaspartate (tNAA), glutamate (Glu), myo-inositol (Ins), taurine (Tau), Phosphorylethanolamine (PE) and macromolecules (MM). Error bars represent standard deviations.
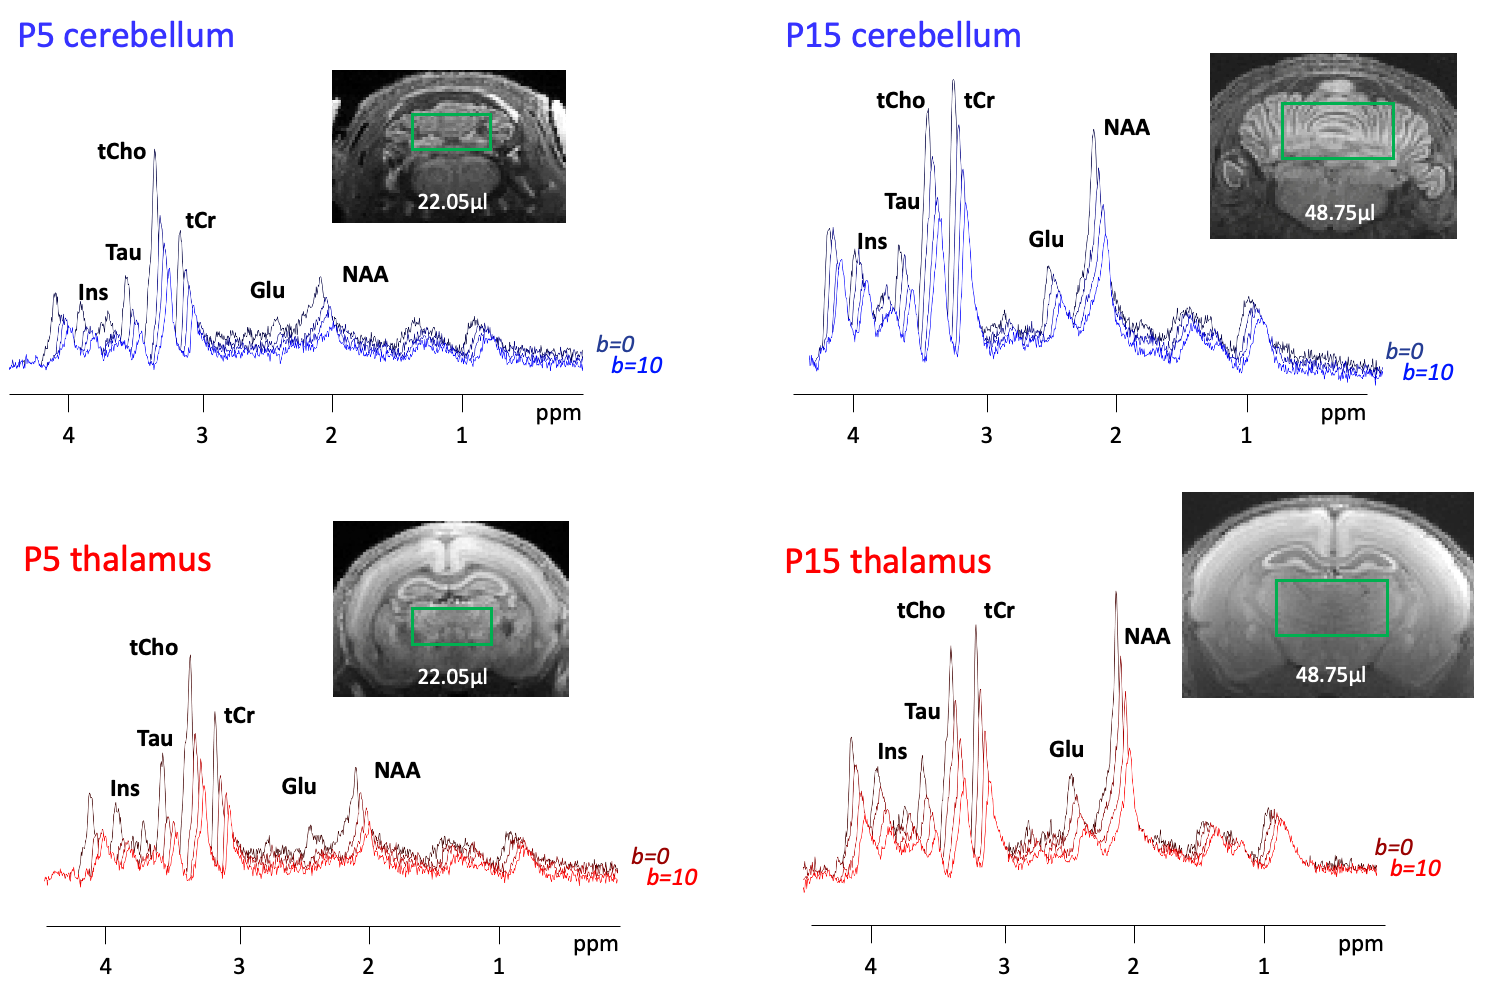
Figure 2:
Representative spectra in a single animal for thalamus, and a single animal for cerebellum at P5 and P15 of signal decay between b0 and b=10ms/µm2. Representative voxel position is shown by the green rectangle for each condition.
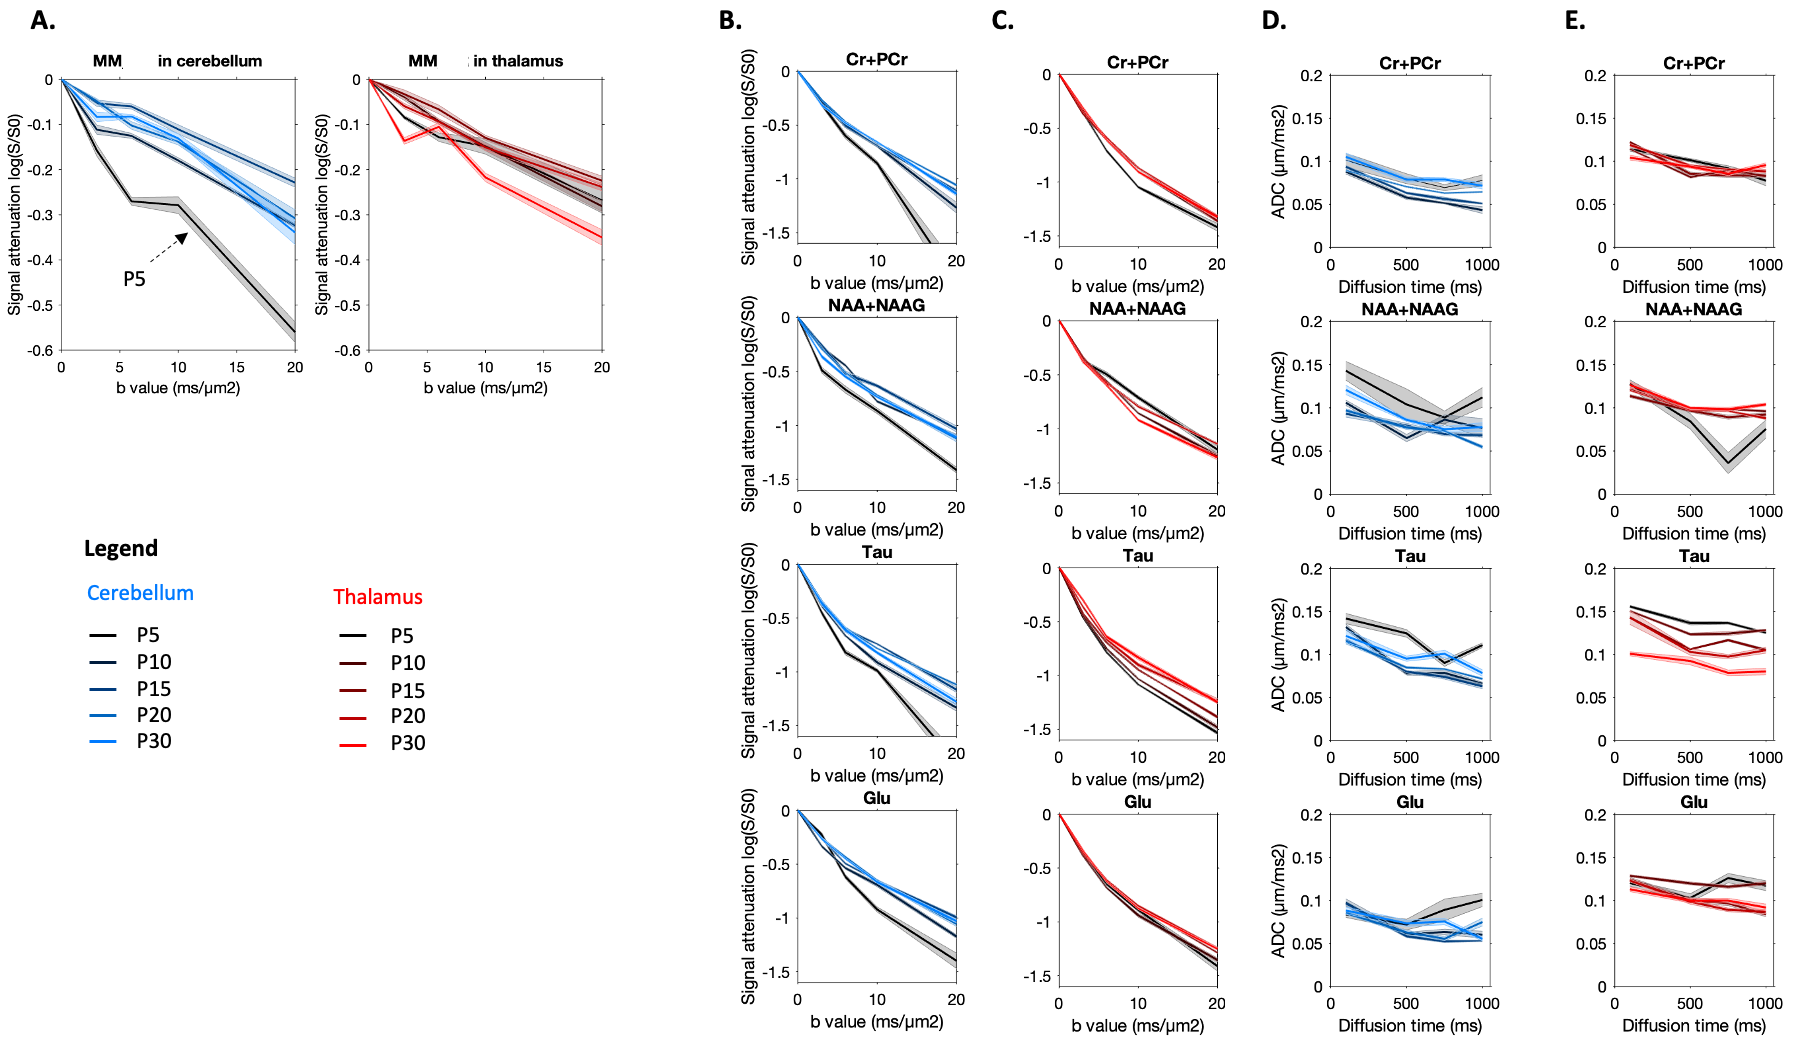
Figure 3:
(A) Macromolecules signal attenuation in both regions at all ages.
(B-C) Signal attenuation as a function of the b-value at td=112.3ms for tCr, Tau, Glu and NAA in both regions at P10, P15, P20 and P30.
(D-E) ADC as a function of diffusion time for tCr, Tau, Glu and NAA in both regions at P10, P15, P20 and P30.
Shadows represent the standard errors.
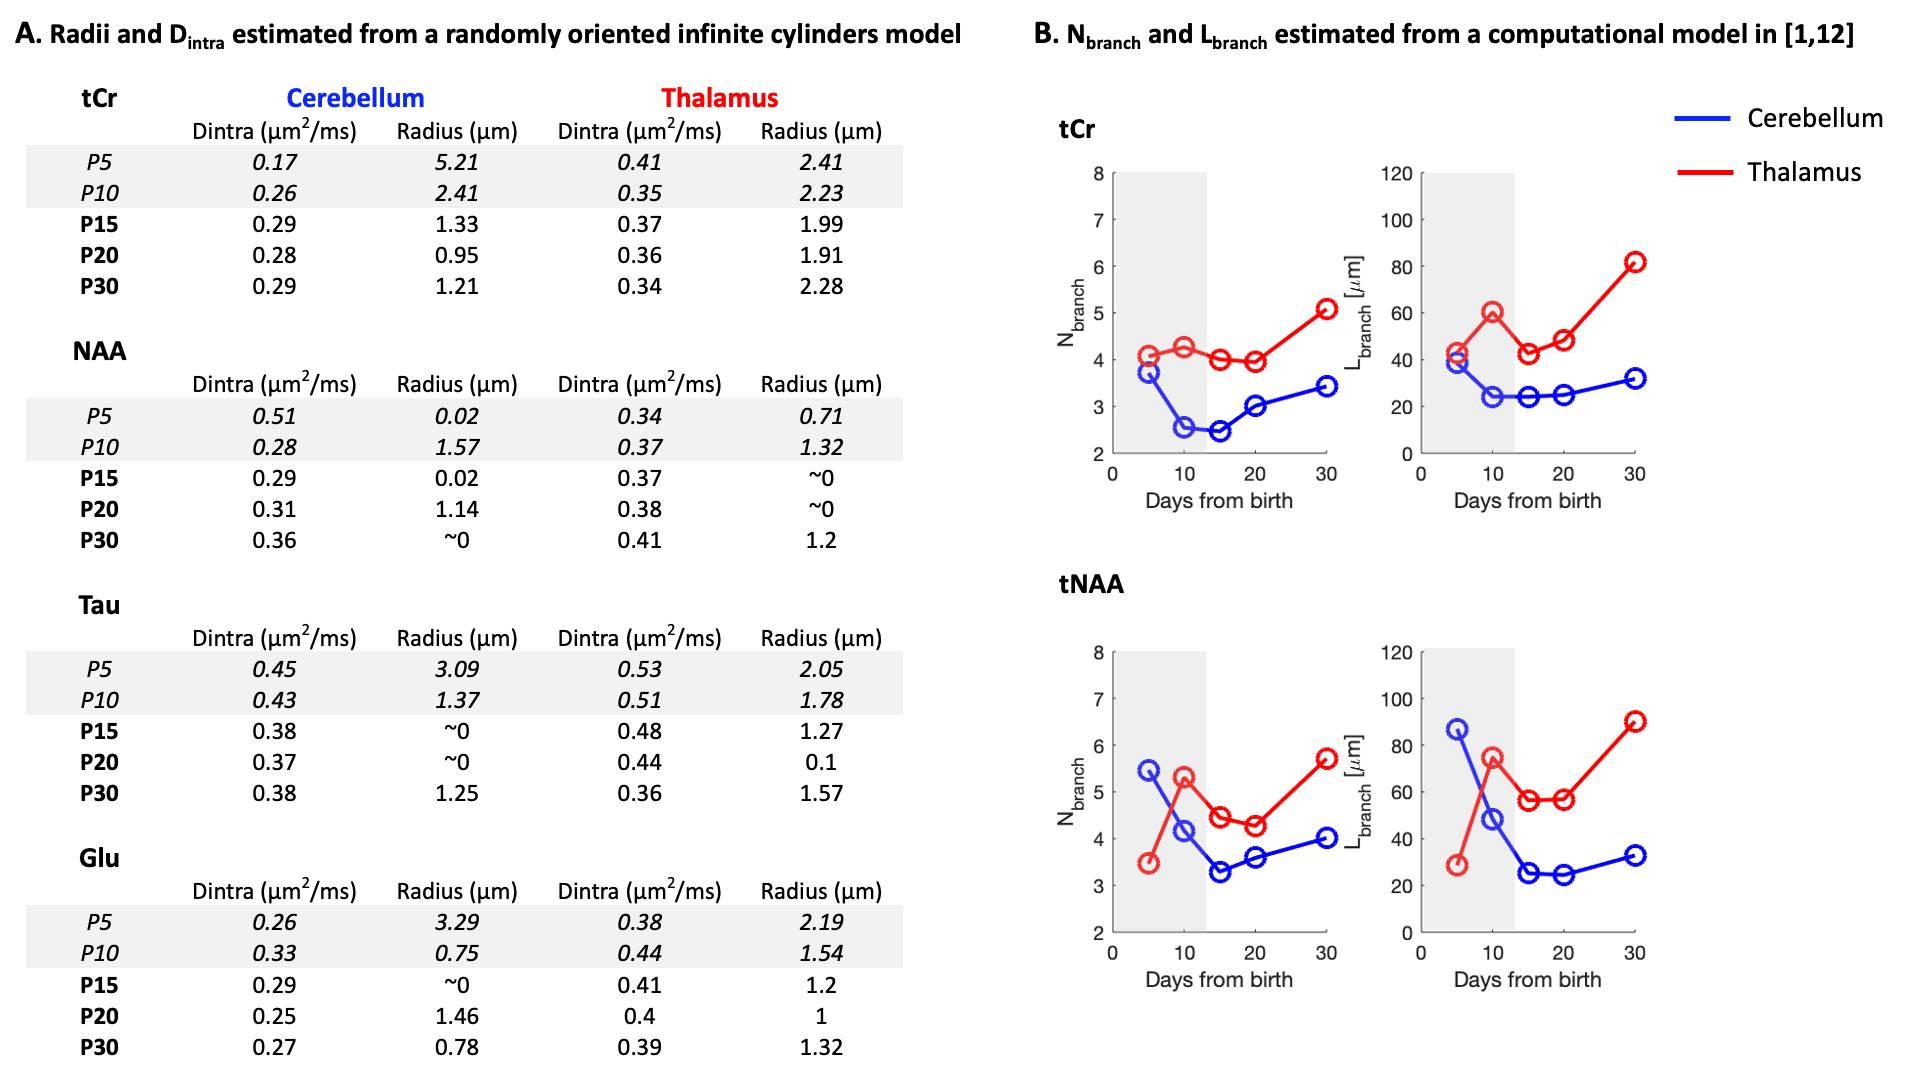
Figure 4:
(A) Results of a randomly oriented infinite cylinders model applied on signal attenuations shown in Fig3B/C. Estimated free intracellular diffusivity (Dintra) and estimated radius are shown for both regions at all ages.
(B) Results of a computational model1,12: Dintra was constrained to [0.3-0.4]µm2/ms. Mean number of embranchments (Nbranch), and mean segment length (Lbranch) are plotted for data coming from ADCtCr(td) and ADCtNAA(td) at all ages.
Shaded rectangles represent timepoints where model assumptions might not hold.
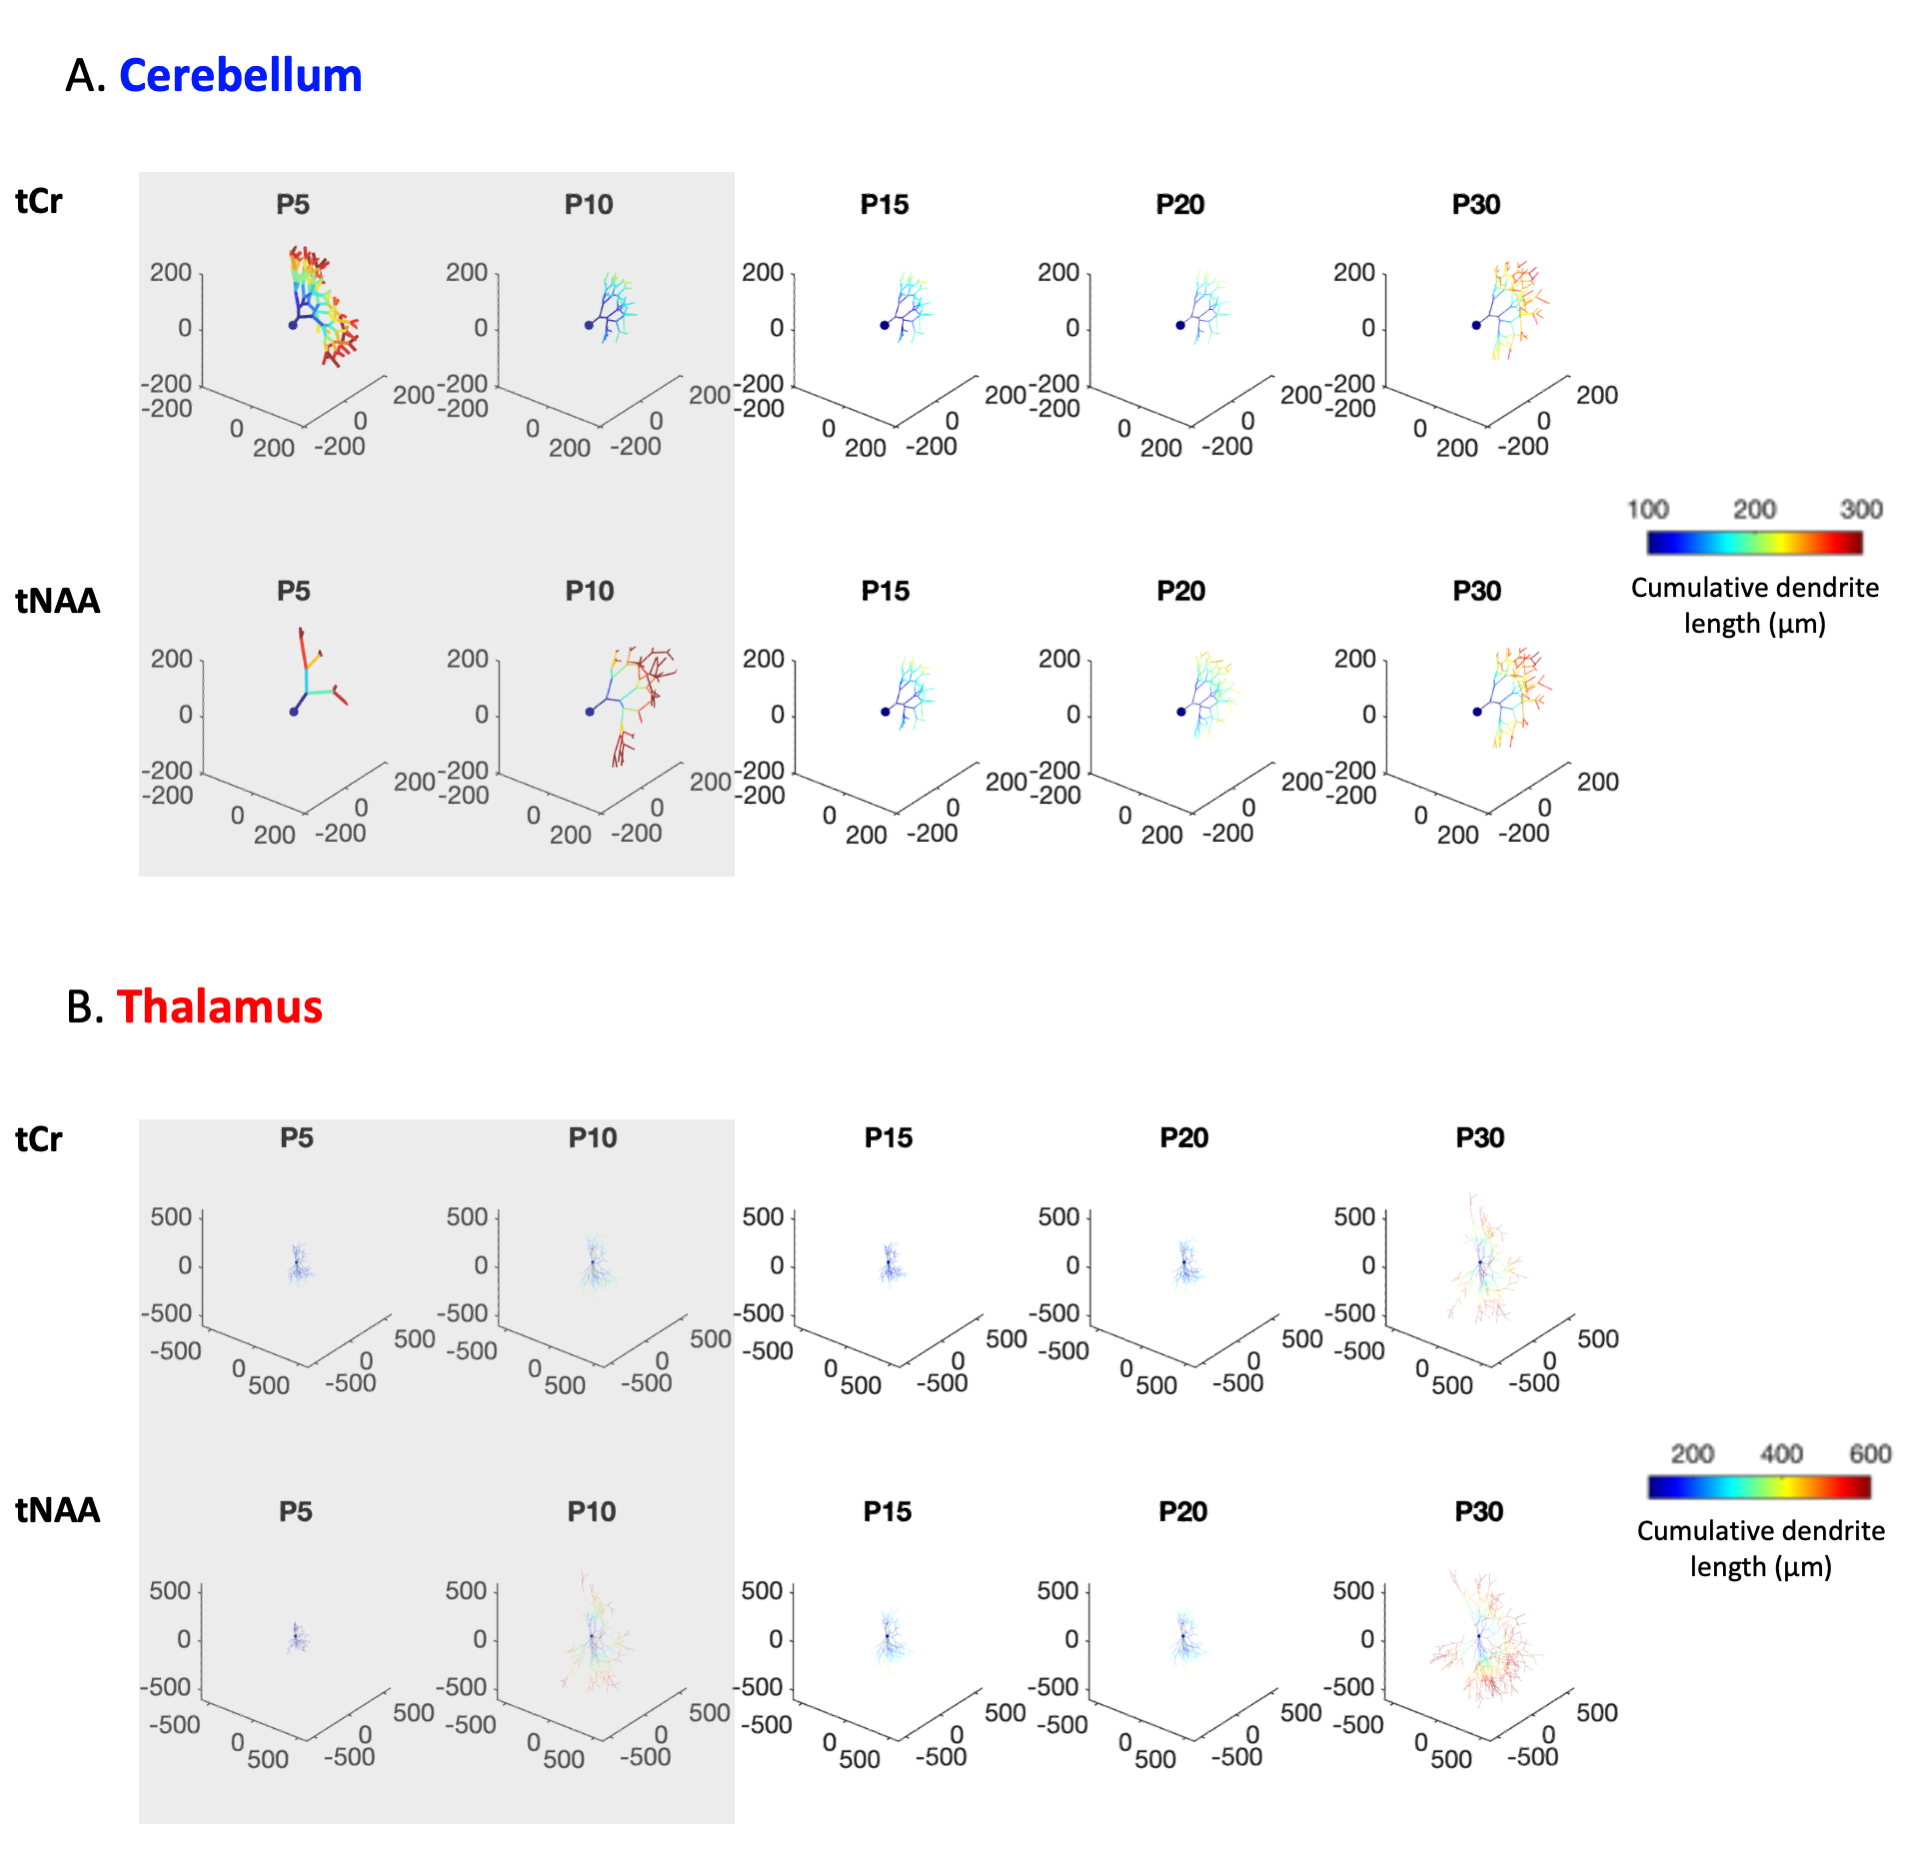
Figure 5:
Visualisation of morphometric parameters coming from Fig4. Soma diameter was set at 10µm. Shaded rectangles represent timepoints where model assumptions might not hold.
(A) In the cerebellum, the number of processes radiating from the soma was set to 1, to represent a Purkinje-like cell.
(B) In the thalamus, it was set to 10.