2612
1H spectroscopy of glutamate kinetics with 13C-glucose infusion in rodents at 7T1Oregon Health & Science University, Portland, OR, United States, 2Stanford University, Palo Alto, CA, United States, 3SRI International, Palo Alto, CA, United States
Synopsis
This work implements a method for measuring cerebral kinetics of glucose metabolism using 1H magnetic resonance spectroscopy (MRS) in rats using a small-animal 7T MRI system. The method has been demonstrated to be readily applied to nonhuman primates and human subjects using clinical MRI systems. The extension to small animals requires intravenous administration of small quantities of 13C-labeled glucose, and adaptation of data analysis procedures to data acquired at high magnetic field strength. We demonstrate robust quantification of 13C enrichment within the glutamate at the C4 position. This methodology will facilitate future translational research involving preclinical models of human disease.
Introduction
Previously, a 1H magnetic resonance spectroscopy (MRS) method has been described to measure kinetics of brain glutamate metabolism following a 13C-glucose infusion1-3. This method involves quantification of the reduction in 12C-coupled glutamate 1H resonance amplitudes and hence does not require specialized 13C-dedicated MRS hardware. This highly translational approach has been implemented with nonhuman1,2 and human3 primate subjects at 3T. Here we demonstrate implementation of this procedure in rodents at 7T.Methods
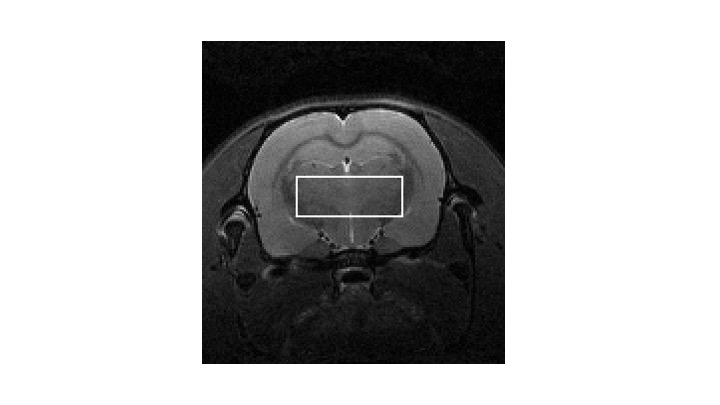
Three male Wistar rats (273, 279 and 281 g) fitted with MRI compatible indwelling jugular catheters (Instech, Plymouth Meeting, PA) were maintained on standard chow. After overnight fasting, animals were anesthetized with 1-3% isoflurane and maintained in a heated environment in the scanner with pulse and respiration monitoring. 1H MRS spectra were collected from an 8x3x3 mm3 voxel subtending the thalamus (Figure 1) with a Bruker Biospin 7T system using a standard Bruker PRESS sequence with the transmitter frequency set to 2.35 ppm (256 spectra with outer volume water suppression, TE/TR=16/2500ms, 1024 points for each FID, spectral bandwidth = 4000Hz). 13C1-glucose (0.25g/kg) was intravenously administered with an infusion pump over 60 minutes. A total of 14 ~10-minute acquisitions were collected: 3 prior to infusion (baseline), followed by 7 during 13C1-glucose administration, plus 4 post-infusion acquisitions. The total glucose infusion volume was ~3.4cc.Spectra were analyzed to quantify fractional enrichment of 13C4 glutamate by monitoring the reduction in amplitude of 12C4-bonded 1H signal amplitudes. For each animal the average of the baseline spectra was used as a template for frequency alignment for each 14 sets of 256 spectra prior to quantification. Figure 2a shows a time series for one animal over the course of the infusion, and Figure 2b shows corresponding difference spectra. The 1H4 difference amplitudes were estimated through fitting time-domain data to exponentially-damped sinusoidal functions as in Miller et al.2. The amplitude of the glutamate 1H4 signal in the baseline spectra was quantified through modeling as a Lorentzian line following LCModel4 pre-processing to account for eddy current correction and baseline removal. Specifically, LCModel basis functions representing 24 spin systems, including glutamate, were fitted, and “isolated glutamate spectra” were derived from the LCModel analysis by removal of the fitted spectra of the other 23 spin systems (Figure 3). The percent enrichment at each time point is the ratio of the glutamate 1H4 difference spectrum amplitude and the baseline isolated 1H4 amplitude.
Results
The solid traces in Figures 2b and 3 show Lorentzian models of the difference spectra and baseline spectra, respectively. Figure 4 shows the percent glutamate 13C4 enrichment for the 3 rats over the 2-hour post-infusion period.Discussion
For all three rats, the glutamate 13C4 enrichment approached an asymptotic value of 25-35% within approximately one hour following 13C-labeled glucose infusion. Both the rate of enrichment and the asymptotic value of approximately 30% are similar to prior findings in primate studies conducted with a 3T MR system, utilizing the 1H MRS method adopted here1-3, as well as rodent studies utilizing 13C MRS methods5. Therefore, this report demonstrates the feasibility of extending this technique to small animal research subjects. One challenge for future work will be to quantitatively interpret enrichment kinetics in terms of metabolic flux through biochemical pathways. Specifically, the appearance of 13C-coupled glutamate 1H3 nuclei, following multiple turns of the tricarboxylic acid cycle, is expected to interfere with C4 enrichment quantification due to the near equivalence of the chemical shift difference between glutamate H3 and H4 nuclei, and half the 1-bond 13C-H coupling constant at a field strength of 7T.Conclusion
This work demonstrates feasibility of using 1H MRS for quantifying the kinetics of glutamate 13C4 enrichment following intravenous administration of 13C-labeled glucose in a rodent species, using a high-field small-animal MRI system. Given the ease of implementation of this approach in humans and nonhuman primates, on clinical MRI systems, it is anticipated that this approach will provide a valuable translational tool in comparative studies utilizing rodent models of human disease.Acknowledgements
Supported by National Institutes of Health grants AA-013521, AA-005965, and AA-025473.References
1. Boumezbeur F, Besret L, Valette J, Vaufrey F, Henry PG, Slavov V, Giacomini E, Hantraye P, Bloch G, Lebon V. NMR measurement of brain oxidative metabolism in monkeys using 13C-labeled glucose without a 13C radiofrequency channel. Magn Reson Med. 2004;52:33–40.
2. Miller C, Gantert L, Previs S, Chen Y, Anderson K, Thomas J, Sanacora G, Uslaner J, Rothman D, Mason G. A novel biomarker of neuronal glutamate metabolism in nonhuman primates using localized 1H-magnetic resonance spectroscopy: Development and effects of BNC375, an α7 nicotinic acetylcholine receptor positive allosteric modulator. Biol. Psychiatry CNNI. 2020: Available online 29 September, 2020.
3. Dehghani M, Zhang S, Kumaragamage C, Rosa-Neto P, Near J. Dynamic 1H-MRS for detection of 13C-labeled glucose metabolism in the human brain at 3T. Magn Reson Med. 2020;84:1140–1151.
4. Provencher SW. Estimation of metabolite concentrations from localized in vivo proton NMR spectra. Magn Res Med. 1993;30:672–679.
5. Lai M, Gruetter R, Lanz B. Progress towards in vivo brain 13C-MRS in mice: Metabolic flux analysis in small tissue volumes. Analytical Biochem. 2017:529:229-244.
Figures