2611
Reliable Quantification of Phosphocreatine and total Creatine during Deep Hypothermic Circulatory Arrest in Neonatal Pig Brain using LCModel1Radiology, Stanford University, Stanford, CA, United States
Synopsis
Reliable in-vivo measurement of phosphocreatine using 1H MRS offers valuable information for understanding brain energy metabolism. At 3T, separate quantification of phosphocreatine and creatine has been challenging using LCModel. This problem exacerbates in studies of deep hypothermic circulatory arrest (DHCA), a technique used in many cardiac surgeries, due to temperature-dependent chemical shifts. Furthermore, total creatine quantification is hampered using a 37°C-only basis set as it fails to account for the increased polarization at lower temperatures. By using a semi-laser sequence with temperature dependent LCModel basis sets, reliable quantification of phosphocreatine and total creatine was achieved for the DHCA studies.
Introduction
Reliable in-vivo measurement of phosphocreatine (PCr) using 1H magnetic resonance spectroscopy (MRS) offers valuable information for understanding brain energy metabolism. At 3T, separation of PCr and creatine (Cr) has been challenging due to highly overlapping resonances. This problem exacerbates in deep hypothermic circulatory arrest (DHCA) studies, as the chemical shifts of the Cr and PCr resonances are temperature dependent due to chemical exchange processes. Furthermore, estimation of total Cre (tCr), i.e. Cr+PCr, which is critical as it often serves as a quantification reference and should be monitored for change during DHCA, is also hampered using a 37°C-only basis set as it fails to account for the increased polarization at lower temperatures. To improve the PCr quantification during DHCA at 28°C, spectra were acquired using a semi-laser (sLASER) sequence and quantified using LCModel with Cr and PCr basis spectra at 37°C, 32°C and 28°. Compared to using a 37°C-only basis, more reliable PCr and tCr quantification were achieved using the temperature dependent basis sets.Methods
Two-week old piglets were put on a cardiopulmonary bypass pump and placed in a GE MR750 3T scanner (GE Healthcare, Waukesha, WI) with an 8-channel knee coil to study brain metabolism during DHCA at 28°C. Single-voxel MRS data were acquired from a 12 x 12 x 15 mm3 right midbrain voxel continuously for approximately three hours using sLASER with TE/TR=30ms/2s, 5000Hz bandwidth, 4096 data points and 64 or 128 averages for each acquisition. [1] To avoid partial suppression of resonances above 3.8 ppm, the semi-laser sequence used VAPOR water suppression with a reduced RF-pulse bandwidth of 75Hz. Baseline spectra at 37°C were acquired in the first half hour before the cooling of the blood. The brain temperature was measured as soon as each acquisition completed using the chemical shift difference between the water and the 2-ppm NAA resonances and used as a reference to keep the brain temperature at 28°C. After the brain temperature equilibrated at 28°C, pump was turned off for 45 minutes of circulatory arrest. The pump was then turned back on and heating started until the brain temperature reached 37°C for a 1.5-hour recovery period.The LCModel basis sets were constructed with data acquired from 23 single-metabolite phantoms using the semi-laser sequence described. Two sets of measurement, at 37°C and 20°C, were conducted by having the phantoms in a temperature controlled incubator overnight. Chemical shifts of methylene and methyl group of Cr and PCr were measured and 3T chemical shifts of Cr and PCr at 32°C and 28°C were estimated using linear extrapolation of those at 37°C and 20°C. Cr and PCr basis spectra in the 37°C basis set were then replaced by simulated Cr and PCr spectra with chemical shifts at 37°C, 32°C and 28°C to form basis sets at these temperatures. The Cr and PCr basis spectra at 32°C and 28°C were furthered corrected for polarization with a scaling factor of 1+dt/310, where dt is the drop in temperature (Kelvin) from 37°C (310 Kelvin).
Eddy-current correction was performed on each FID using the linear and cubic splined phase estimated from the water-unsuppressed FIDs low-pass filtered with a 25-Hz cutoff frequency. [2] The water-suppressed FIDs were subsequently zero-order phased before coil combination. A pure water spectrum (PWS) was estimated by subtracting the spectrum of the water-suppressed spectrum from the water-unsuppressed spectrum. The PWS was subtracted from the water-suppressed spectrum for artifact reduction. [3] The preprocessed spectrum was quantified using LCModel with the basis set at the temperature closest to the measured temperature.
Results
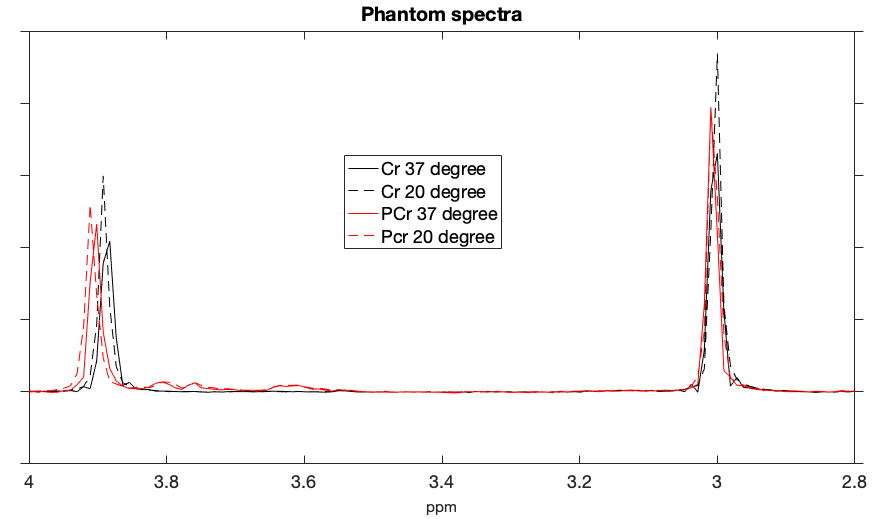
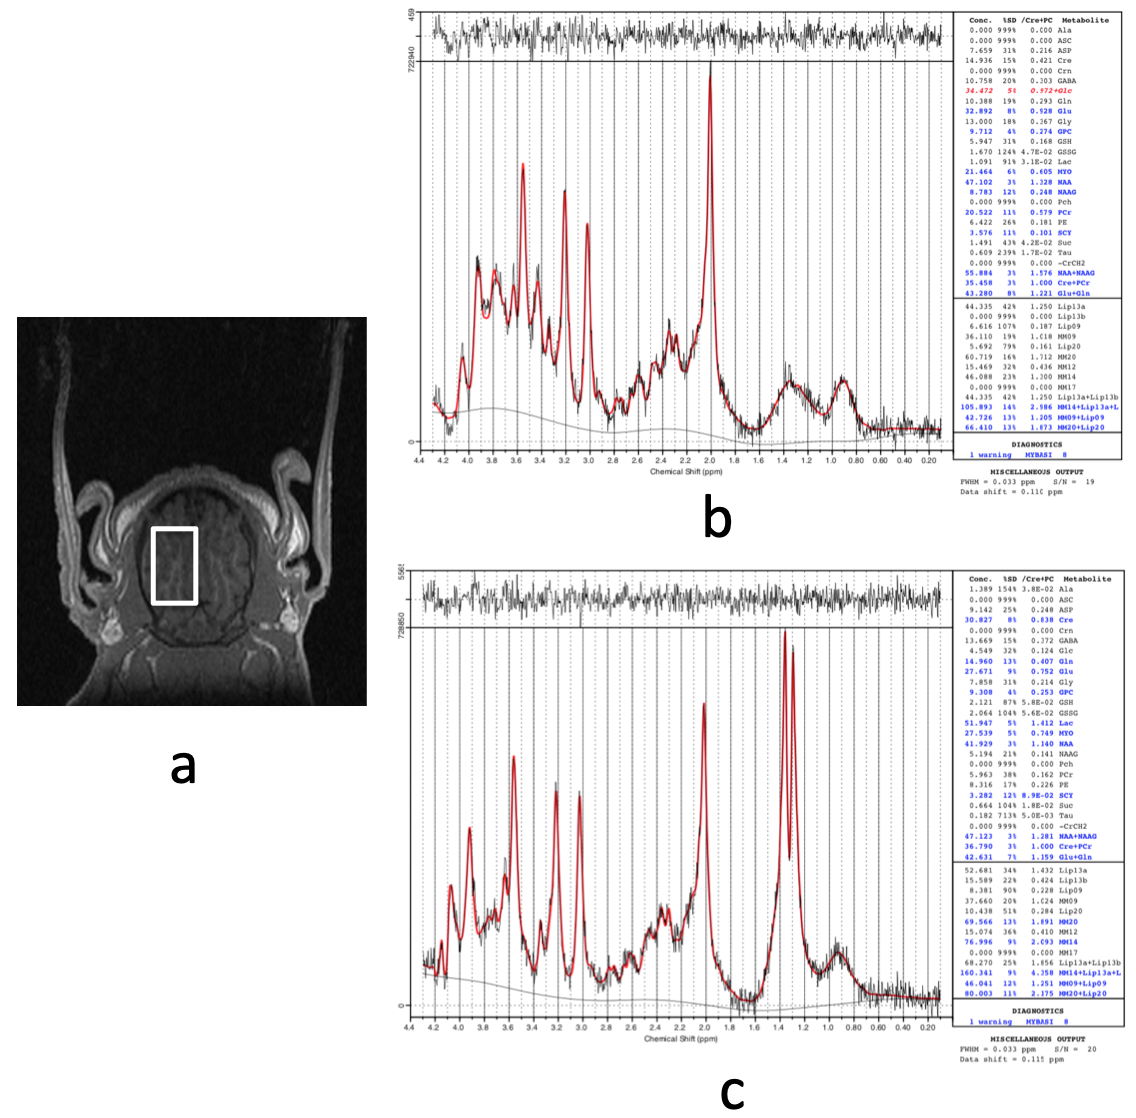
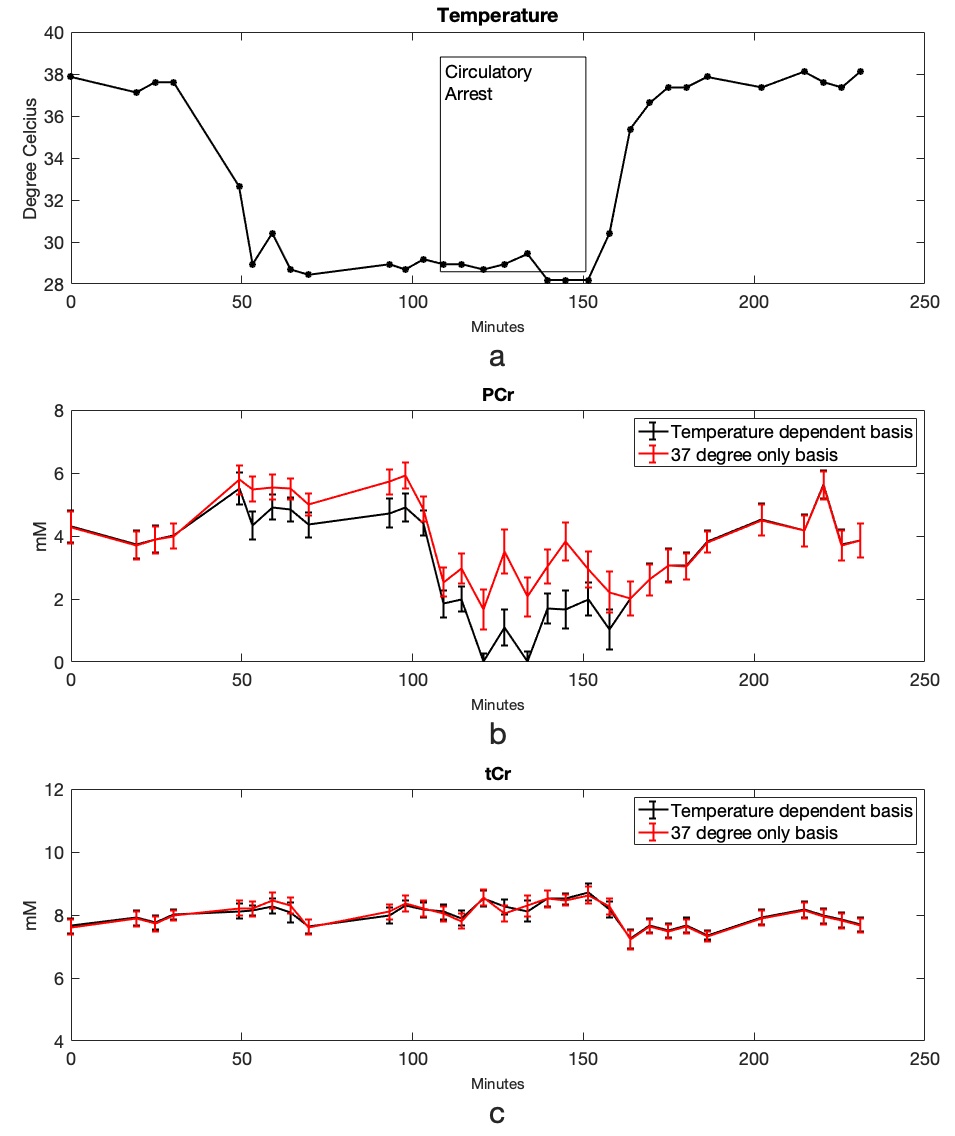
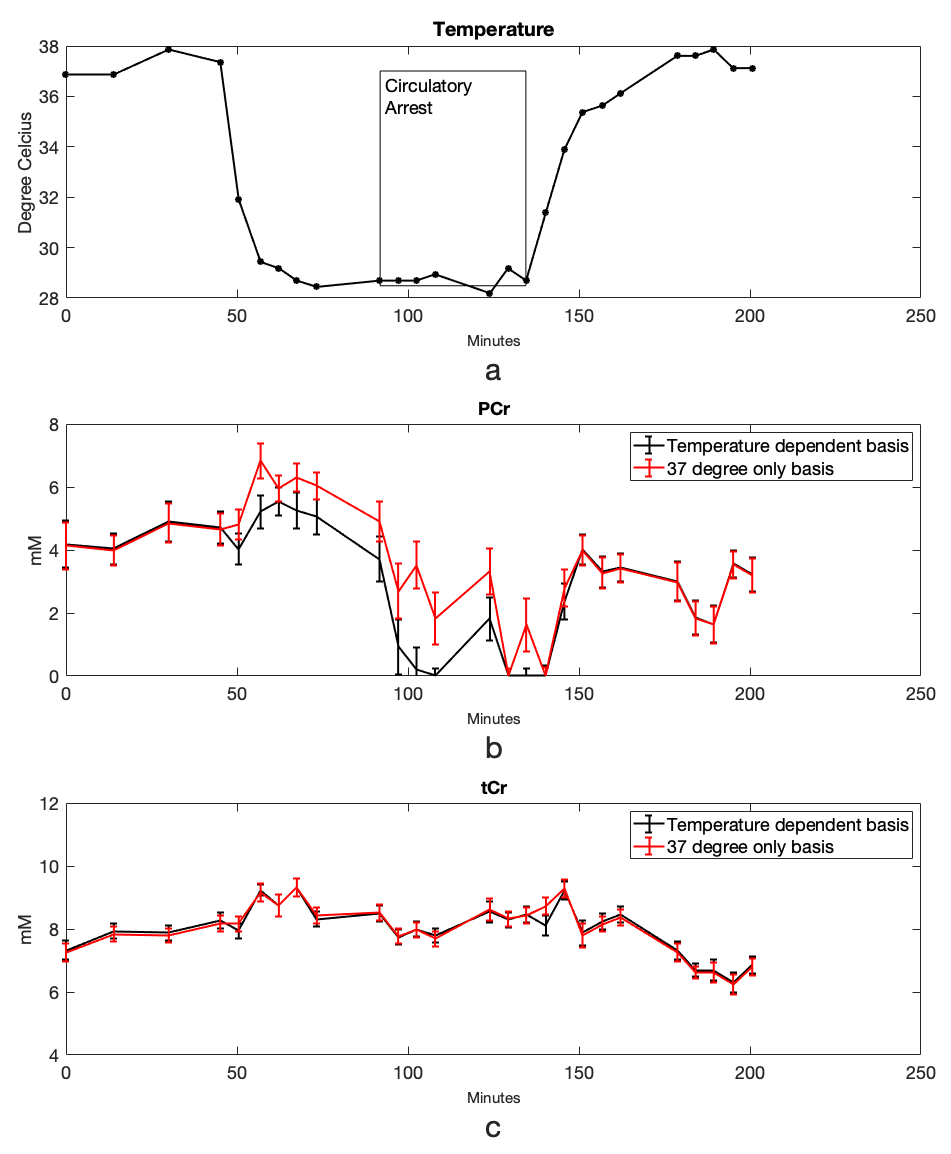
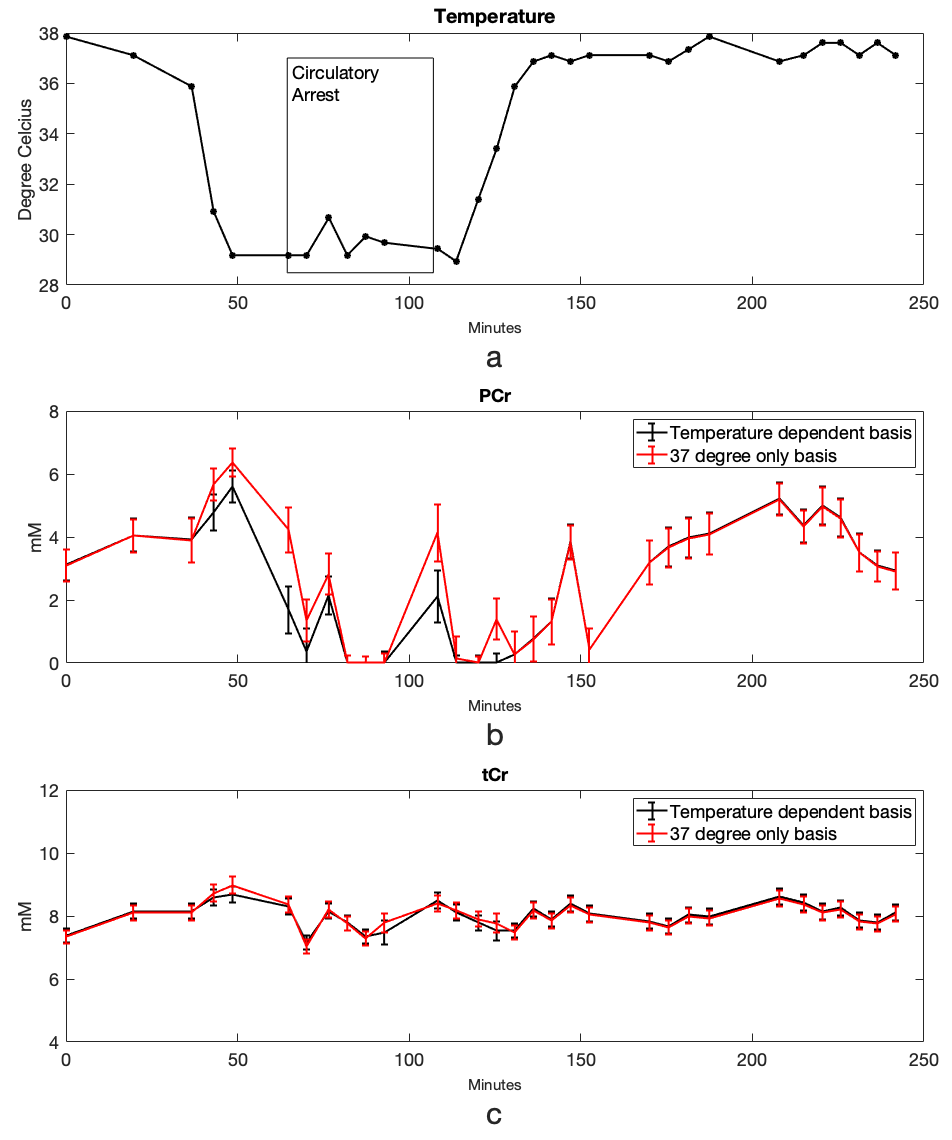
Cr and PCr spectra acquired from phantoms at 37°C and 20°C are shown in Figure 1. Using the sodium trimethylsilylpropanesulfonate (DSS) resonance as a reference, the chemical shifts of the methylene group of Cr/PCr were measured at 499.26/501.7Hz at 37°C and 500.48/502.92Hz at 20°C while those of the methyl group of Cr/PCr were at 385.74/386.96Hz at both 37°C and 20°C. From linear extrapolation, chemical shifts of 499.62/502.06Hz and 499.91/502.35Hz were used for the methylene group of Cr/PCr at 32°C and 28°C while 385.74/386.96Hz were used for the methyl group of Cr/PCr at both 32°C and 28°C. Representative in-vivo spectra and their LCModel fits before-and-after circulatory arrest were shown in Figure 2. The dynamics of the brain temperature, estimated PCr and tCr using the 37°C-only and the temperature dependent basis sets from three studies were shown in Figure 3, 4 and 5. The standard deviation of the quantified tCr throughout the study using the temperature dependent basis sets were 6% less than using a 37°C-only basis set for all three studies.Discussions
The reduced standard deviation of tCr levels using temperature-dependent basis sets compared to using a 37°C-only basis set demonstrated increased stability in tCr estimation for polarization correction. The PCr dynamics shown in Figure 3, 4 and 5 demonstrated more reliable measurement of energy consumption using temperature-dependent basis sets compared to using a 37°C-only basis set as indicated by consistent measurement of PCr loss during circulatory arrest and PCr recovery after recirculation.Conclusions
Quantification of PCr and tCr using MRS in DHCA studies was improved using temperature dependent LCModel basis sets compared to using a 37°C-only basis set.Acknowledgements
NIH Grant R01HL152757, the Lucas Foundation, and GE Health Care.References
1. Hanley, F.L., et al., Comparison of dynamic brain metabolism during antegrade cerebral perfusion versus deep hypothermic circulatory arrest using proton magnetic resonance spectroscopy. J Thorac Cardiovasc Surg, 2020. 160(4): p. e225-e227.
2. Webb, P.G., et al., Automated single-voxel proton MRS: technical development and multisite verification. Magn Reson Med, 1994. 31(4): p. 365-73.
3. Hurd, R., et al., Utility of Residual Water in Proton MR Spectroscopy. The Measurement of Voxel Temperature and Hypoxia. ISMRM annual conference, 2021, 2021.
Figures