2610
Linear-combination modeling of short-TE PRESS data using parameterized and experimentally derived macromolecule basis functions
Helge Jörn Zöllner1,2, Tao Gong3,4, Steve C. N. Hui1,2, Yulu Song1,2, Weibo Chen5, Guangbin Wang3,4, Georg Oeltzschner1,2, and Richard A. E. Edden1,2
1Russell H. Morgan Department of Radiology and Radiological Science, The Johns Hopkins University School of Medicine, Baltimore, MD, United States, 2F. M. Kirby Research Center for Functional Brain Imaging, Kennedy Krieger Institute, Baltimore, MD, United States, 3Departments of Radiology, Shandong Provincial Hospital Affiliated to Shandong First Medical University, Jinan, Shandong, China, 4Departments of Radiology, Shandong Provincial Hospital, Cheeloo College of Medicine, Jinan, Shandong, China, 5Philips Healthcare, Shanghai, China
1Russell H. Morgan Department of Radiology and Radiological Science, The Johns Hopkins University School of Medicine, Baltimore, MD, United States, 2F. M. Kirby Research Center for Functional Brain Imaging, Kennedy Krieger Institute, Baltimore, MD, United States, 3Departments of Radiology, Shandong Provincial Hospital Affiliated to Shandong First Medical University, Jinan, Shandong, China, 4Departments of Radiology, Shandong Provincial Hospital, Cheeloo College of Medicine, Jinan, Shandong, China, 5Philips Healthcare, Shanghai, China
Synopsis
Recent expert consensus emphasizes the use of measured MM spectra for reliable linear-combination modeling (LCM) of short-TE MRS data. Here we compare the metabolite estimates from short-TE PRESS data modeled with a parameterized and measured MM basis functions in a large dataset.
Introduction
Short-TE proton magnetic resonance spectroscopy (MRS) is a valuable tool to study endogenous metabolites in the human brain. Linear-combination modeling (LCM) uses metabolite basis spectra to maximize prior knowledge and is currently consensus-recommended for modeling of MRS1. Mobile macromolecules (MM) contribute a significant background to the MR spectrum and thus need to be removed or included in the model2. MM models are typically included as a combination of constrained parametrized Gaussian components or as a single cohort-specific measured basis function.Here, we compare two strategies for modeling of short-TE MR spectra: using 1) parametrized Gaussian basis functions and 2) an experimentally derived cohort-specific MM basis function. A large, MRS dataset including short-TE and measured MM spectra3 was used to evaluate the performance of the modeling strategies with the open-source package Osprey4.
Methods
Short-TE water-suppressed spectra (Philips 3T Ingenia CX; TR/TE = 2000/30 ms; 2 kHz spectral width; 2048 samples; 96 transients; 30 × 26 × 26 mm3 voxel in medial parietal lobe; including water reference data) and MM spectra (same settings, but with pre-inversion pulse at TI = 600 ms) were acquired in 102 healthy subjects (49M/53F) between 20 and 69 years with 20 subjects per decade of age3 (Figure 1A).Residual metabolite signals were removed by an LCM approach3 and a cubic B-spline (knot spacing = 0.1 ppm) was used to generate noise-free MM spectra which were subsequently averaged across subjects (Figure 1B).
The water-suppressed spectra were then modeled with Osprey’s default basis set, generated with localized 2D density-matrix simulations, including 18 metabolites (Figure 1C). Two different strategies to account for the macromolecular signals were tested. The first strategy uses 10 Gaussian basis functions as previously implemented5. The second uses an experimental MM basis function (MMexp; Figure 1D). Both LCM strategies were performed with a 0.4 ppm baseline knot spacing and a model range from 0.5 to 4 ppm.
Water-scaled metabolite estimates were calculated for both strategies using the water reference scan. This analysis focuses on 5 major metabolites (tNAA, tCho, Ins, Glx, and tCr). The relative amplitudes of the model residual (normalized to the noise) were used as a measure of fit quality. Agreement between total background (MM + spline baseline), MM, and baseline signals were assessed by calculating intra-class correlation coefficients (ICC) between the different components for each subject. The visualization and statistical analysis were performed in the R-based package SpecVis6. A paired t-test was used to infer any differences between both modeling strategies.
Results
Two datasets were excluded from the analysis (visible ethanol signal or unacceptably large lipid signals).Mean model results including different components of the LCM are shown in Figure 2. The complete model, residual, and individual metabolite components suggest strong agreement between both strategies. Total background signals agree less well, with clear differences between strategies in the total MM component and baseline signals.
Water-scaled metabolite estimates were significantly higher for all metabolites modeled with MMexp. No changes in metabolite variance across subjects were observed. Estimates of both strategies were strongly positively correlated for tNAA, tCho, mI, and tCr (R2 > 0.87) while Glx showed a moderate positive correlation (R2 = 0.59) (Figure 3).
The relative amplitude of the residual was significantly lower when an MMexp was used in the model (Figure 4).
ICCs were significantly higher for the total background signal (mean/SD = 0.89/.05) compared to MM (mean/SD = 0.51/.03) and baseline signals (mean/SD = 0.52/.11), implying a high agreement between the total background signals compared to MM and baseline signals, confirming the visual impression from Figure 2.
Discussion
According to expert consensus, short-TE spectra should be quantified with a well-defined MM basis function (ideally experimentally measured). Here we compare the performance of a parameterized MM model using commonly used default settings and an experimentally derived MM basis function in a large dataset.Significant differences in the mean estimates of both modeling strategies were found for all metabolites. A strong correlation between the metabolite estimates was found for metabolites with major singlet signals (tNAA, tCho, and tCr). The agreement was lower for Glx, which is highly j-coupled and likely harder to be distinguished from background signals modeled by the spline baseline. Our findings partially agree with prior studies performing a similar comparison, indicating reduced tNAA, but a substantial increase in Glx when measured MM basis functions were used7.
Conclusion
These initial results suggest that short-TE metabolite estimates from metabolites with major singlets are strongly correlated between LCM with parameterized and experimentally derived MM basis functions, despite some significant differences in the means. However, a weaker correlation is found for metabolites with stronger j-coupling.Acknowledgements
This work has been supported by NIH grants P41EB015909, R01EB016089, R01EB023963, R21AG060245, and R00AG062230.References
- Near J, Harris AD, Juchem C, et al. Preprocessing, analysis and quantification in single-voxel magnetic resonance spectroscopy: experts’ consensus recommendations. NMR Biomed. 2020;n/a(n/a):e4257. doi:10.1002/nbm.42572.
- Cudalbu C, Behar KL, Bhattacharyya PK, et al. Contribution of macromolecules to brain 1H MR spectra: Experts’ consensus recommendations. NMR Biomed. 2021;34(5):e4393. doi:10.1002/nbm.43933. Hui SCN, Gong T, Zöllner HJ, et al. The Macromolecular MR Spectrum in Healthy Aging.; 2021:2021.08.27.457961. doi:10.1101/2021.08.27.4579614.
- Oeltzschner G, Zöllner HJ, Hui SCN, et al. Osprey: Open-source processing, reconstruction & estimation of magnetic resonance spectroscopy data. J Neurosci Methods. 2020;343:108827. doi:10.1016/j.jneumeth.2020.1088275.
- Provencher S. LCModel & LCMgui User’s Manual. LCModel & LCMgui User’s Manual. Published 2020. Accessed April 28, 2020. http://s-provencher.com/pub/LCModel/manual/manual.pdf6.
- Zöllner HJ, Považan M, Hui SCN, Tapper S, Edden RAE, Oeltzschner G. Comparison of different linear-combination modeling algorithms for short-TE proton spectra. NMR Biomed. 2021;n/a(n/a):e4482. doi:https://doi.org/10.1002/nbm.44827.
- Schaller B, Xin L, Cudalbu C, Gruetter R. Quantification of the neurochemical profile using simulated macromolecule resonances at 3 T. NMR Biomed. 2013;26(5):593-599. doi:10.1002/nbm.2896
Figures
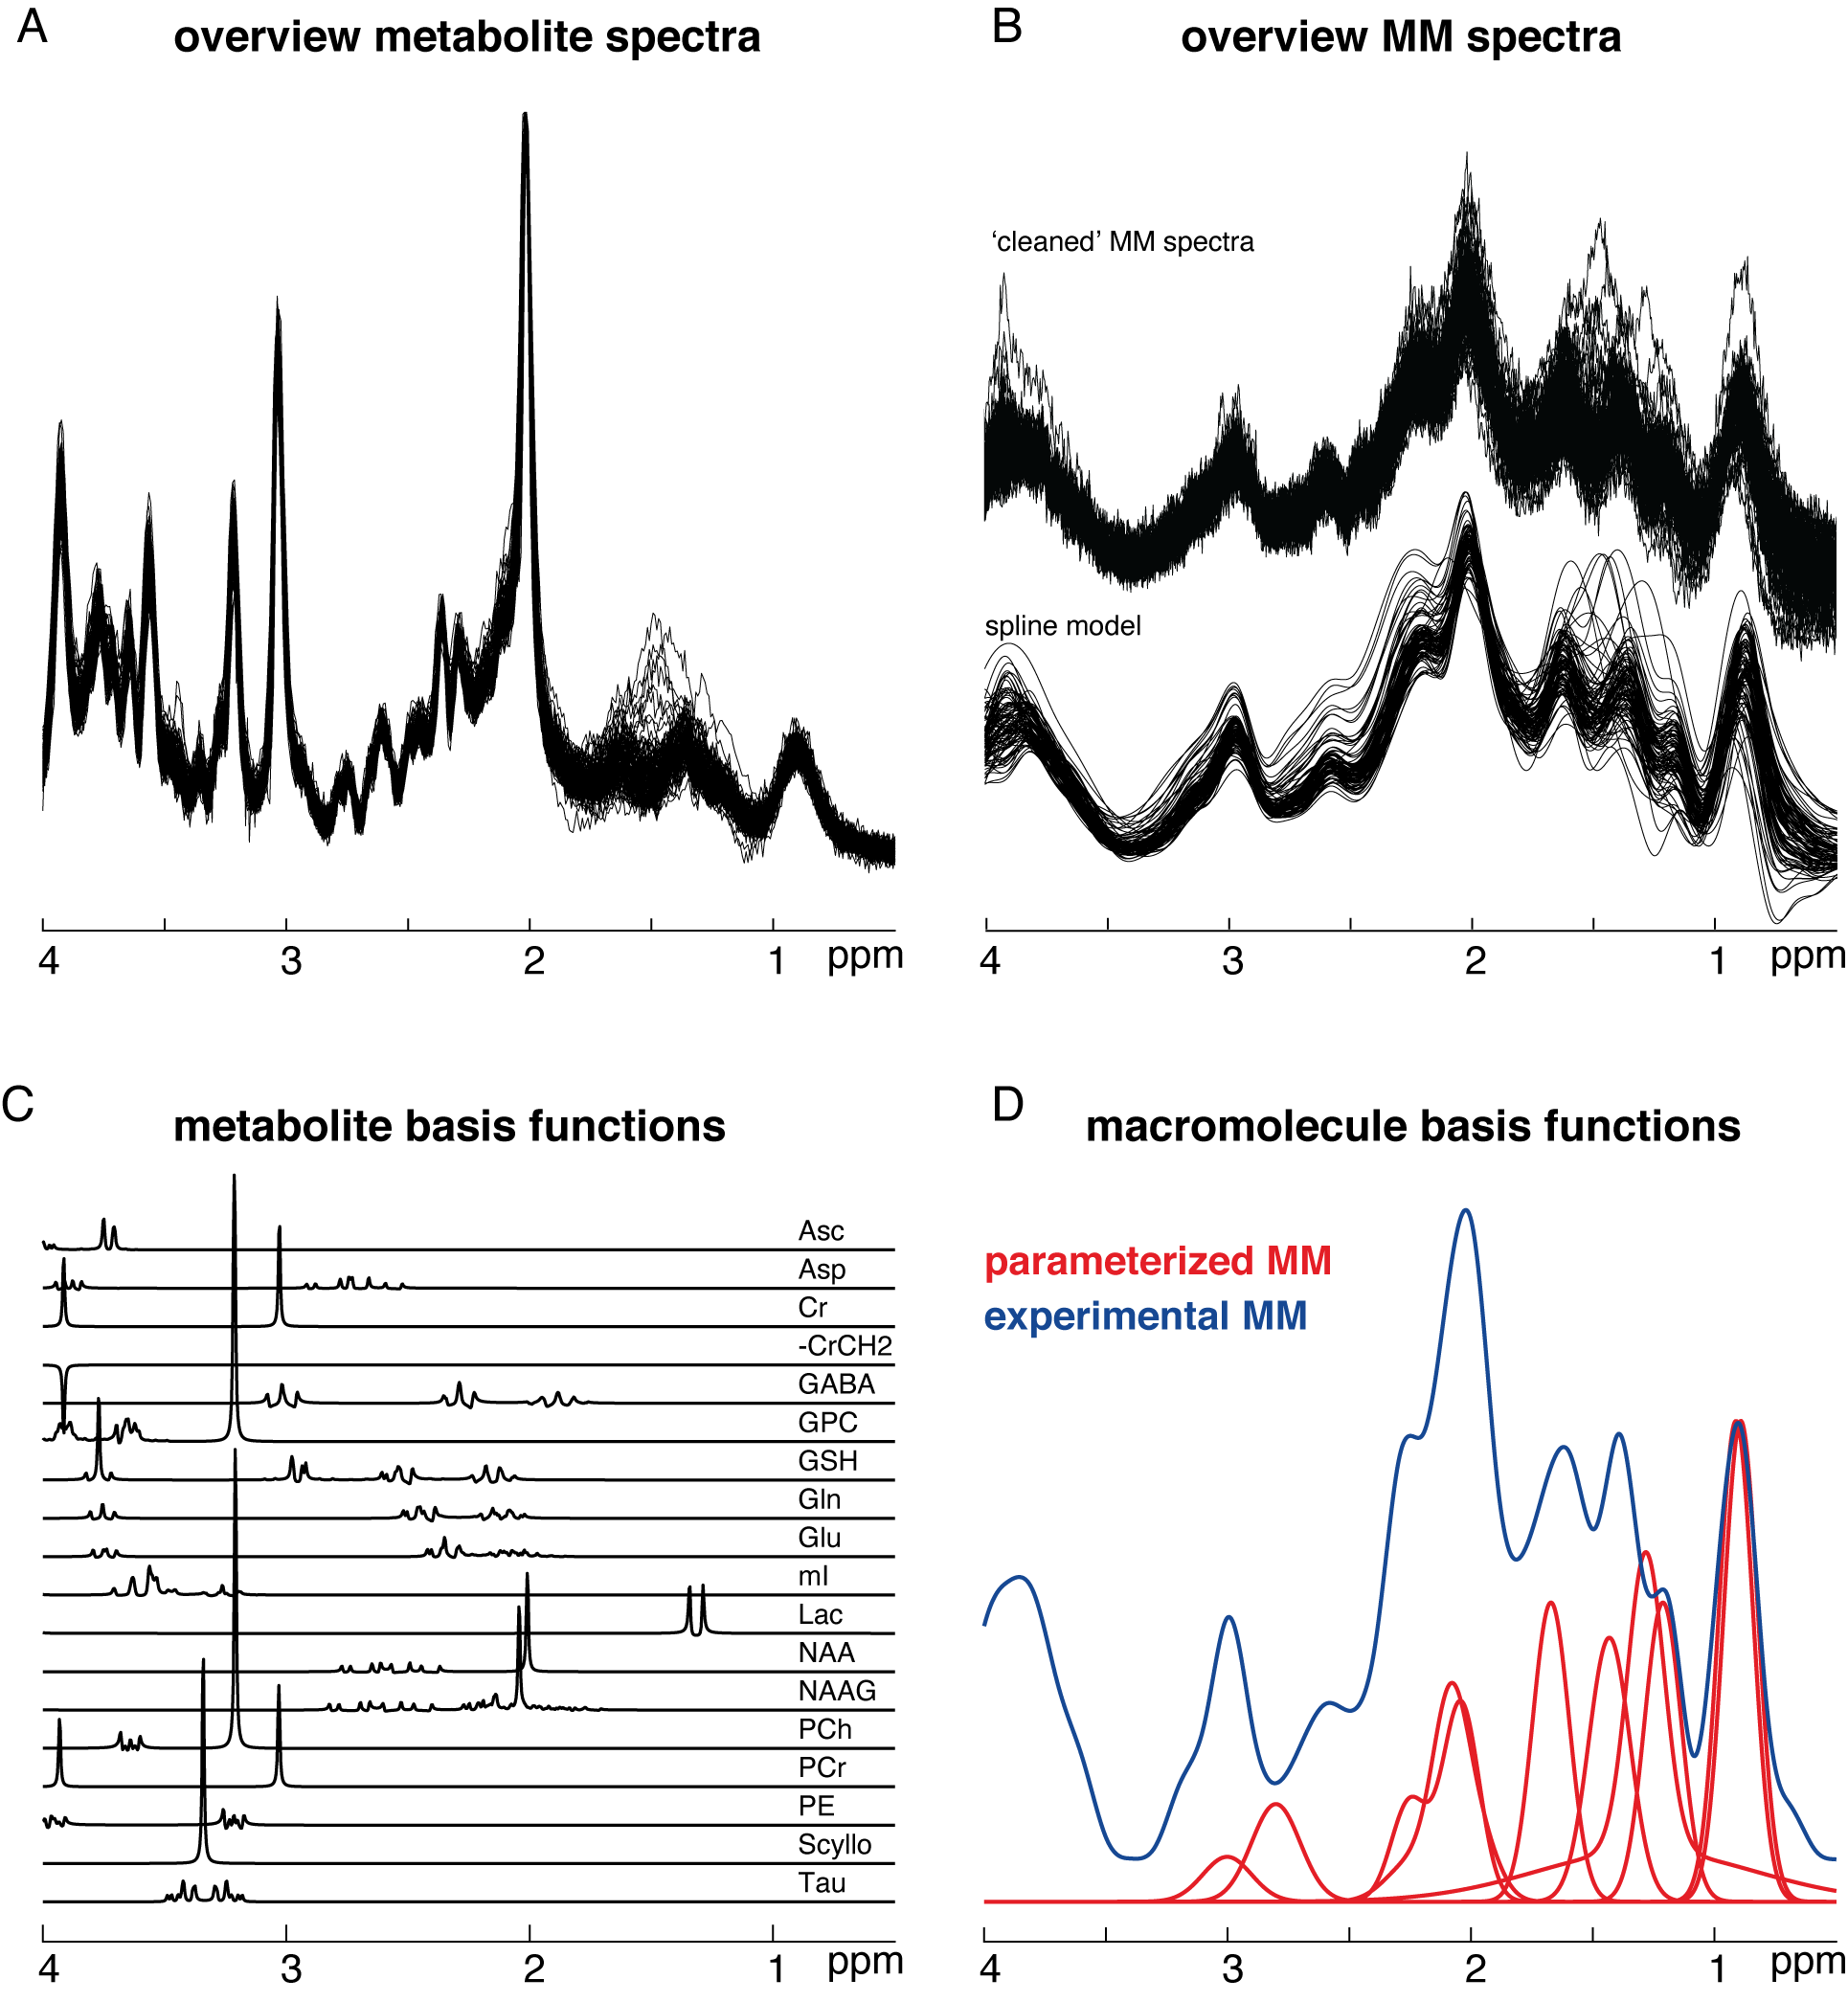
(A) Short-TE PRESS spectra (TE = 30 ms) (B) ‘Cleaned’ metabolite-nulled spectra (TI = 600 ms) and spline models (C) Metabolite basis set included in the linear-combination model (D) Comparison of the commonly used parametrized MM basis function and the experimentally derived MMs.
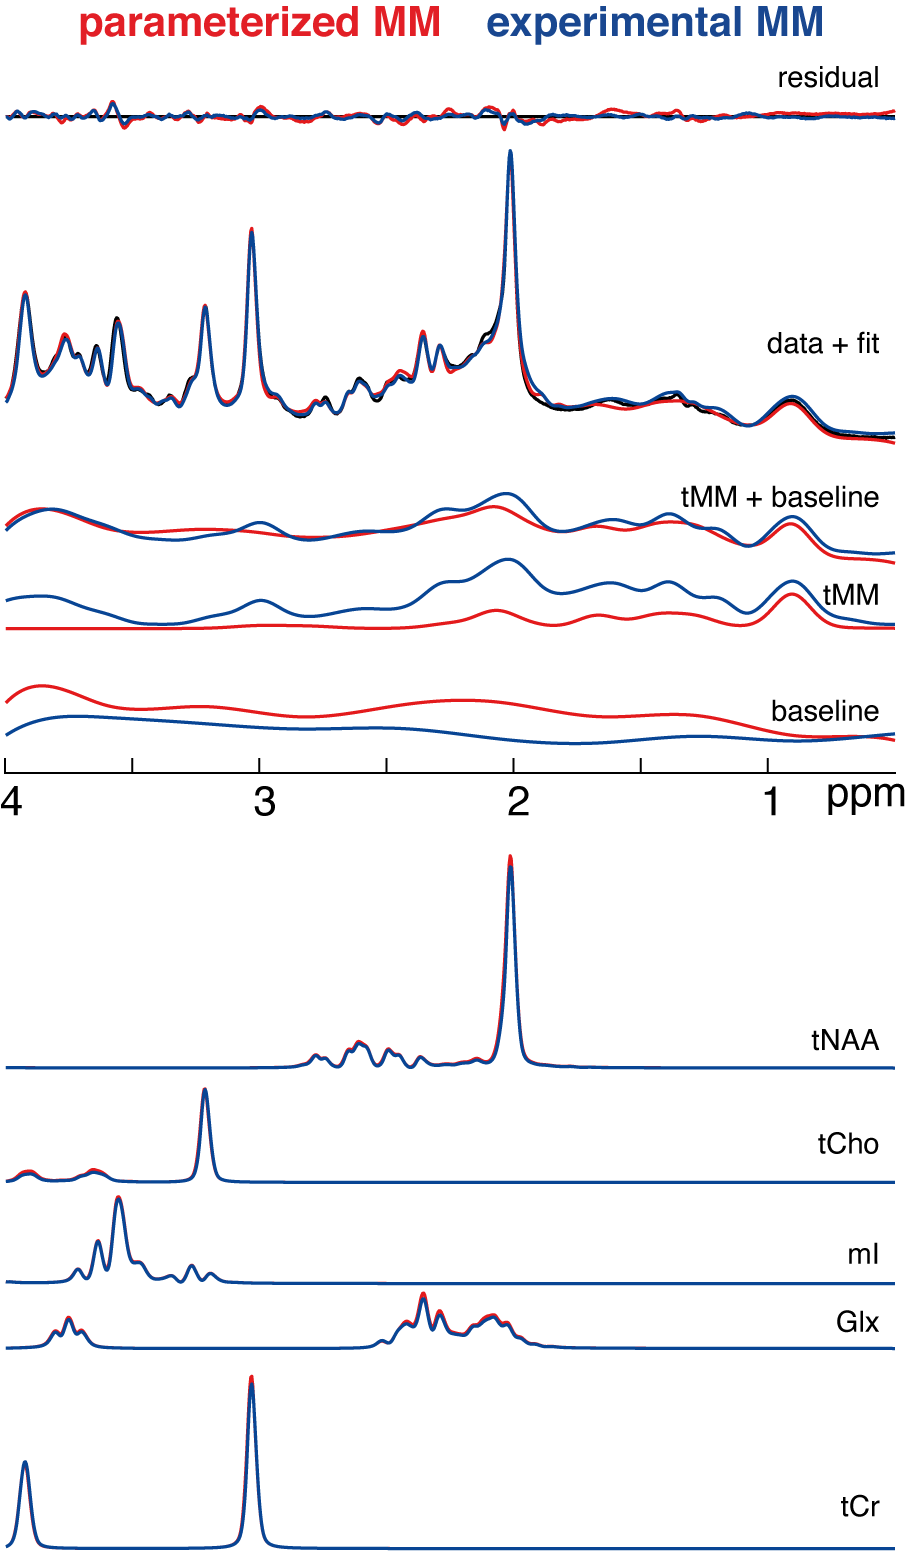
Visual overview of the mean residual, fits, and data of the different modeling strategies (color-coded).
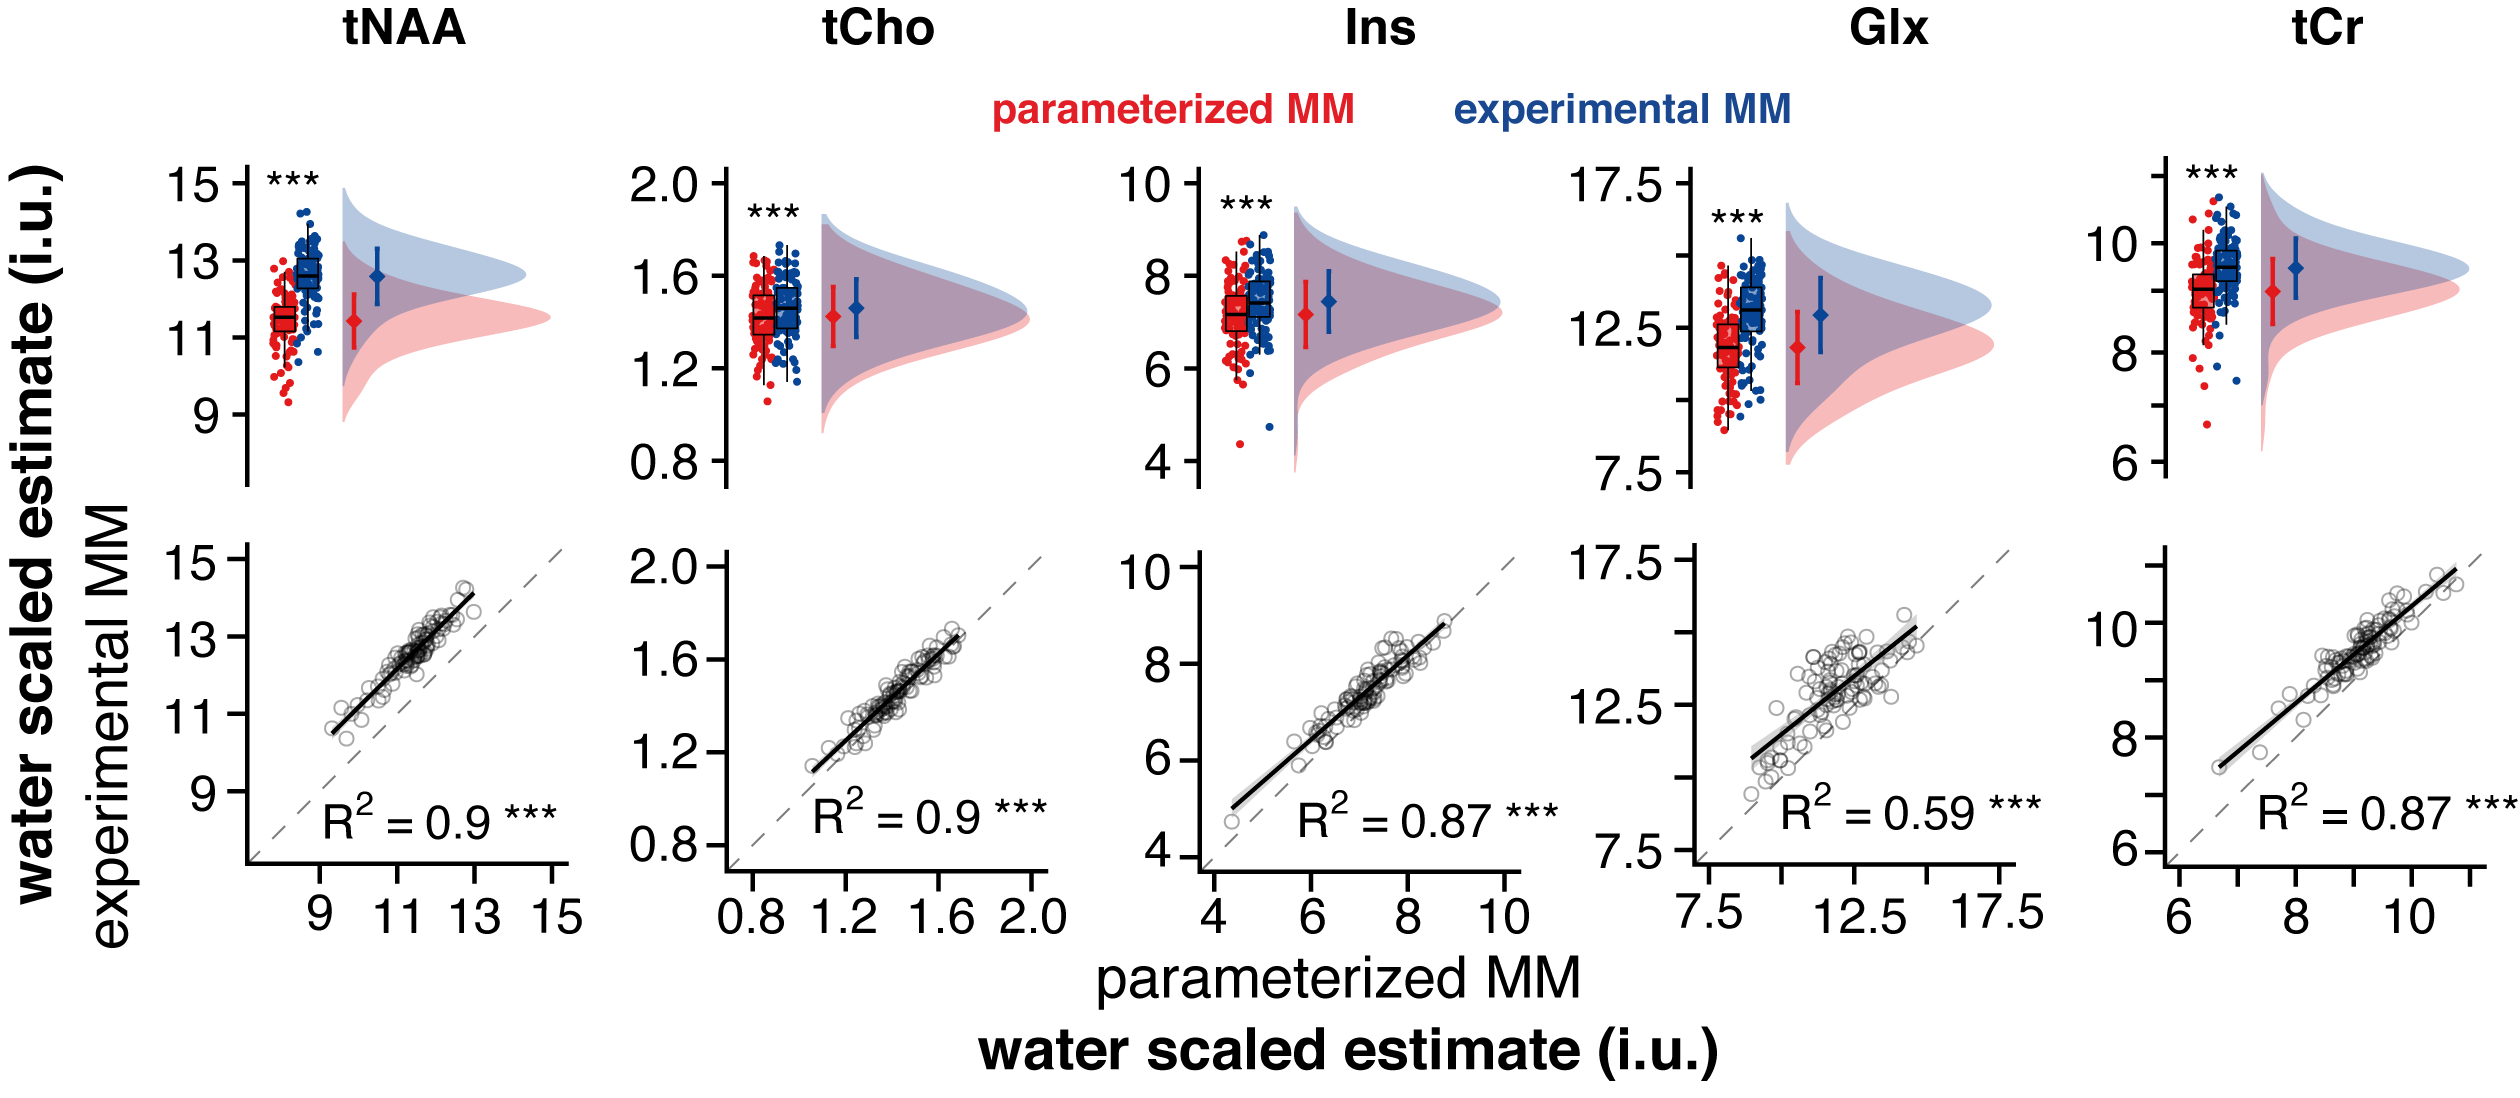
Water-scaled estimates of tNAA, tCho, mI, Glx, and tCr. Boxplot, smoothed distribution, and mean +- SD for both strategies. Correlation analysis between metabolite estimates for both strategies.
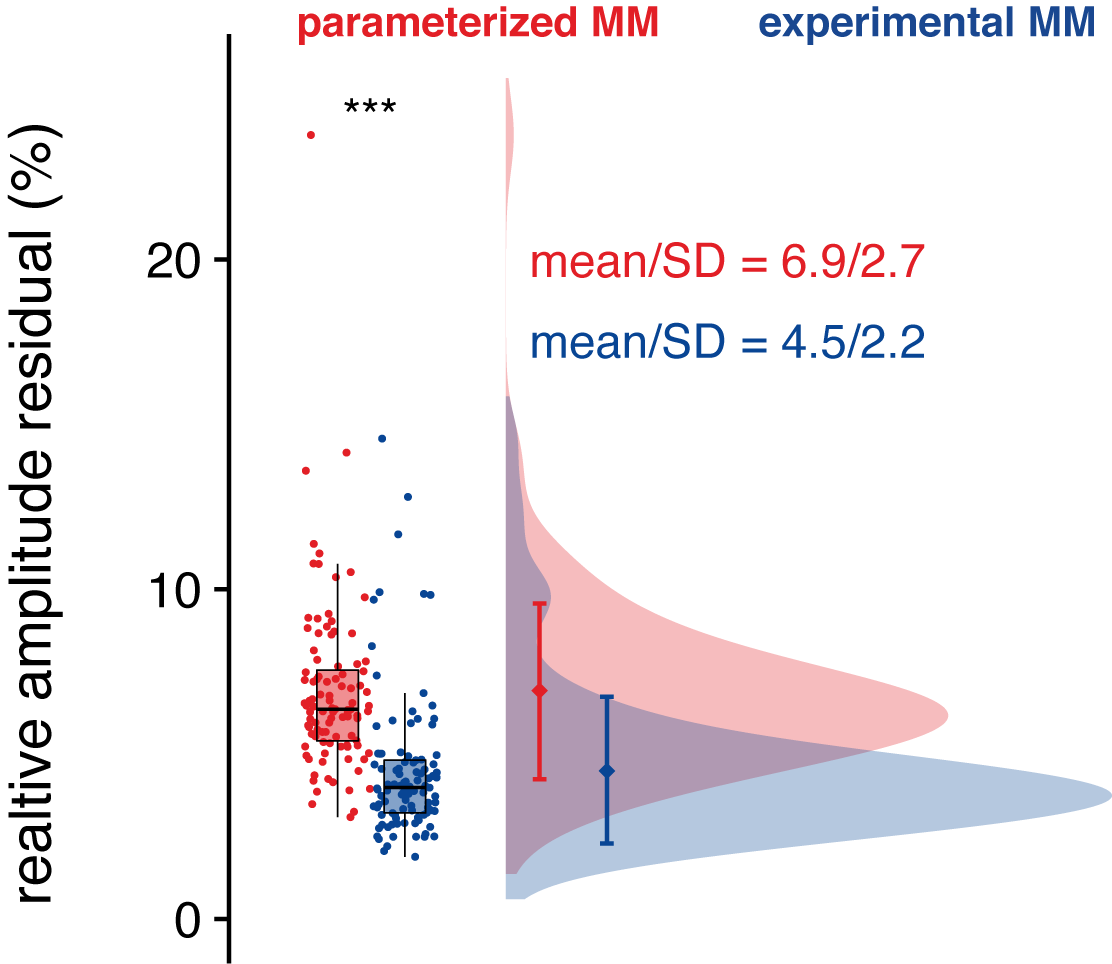
Distribution of the relative amplitude of the residual (normalized to the noise).
DOI: https://doi.org/10.58530/2022/2610