2609
Hybrid supervised and self-supervised deep learning for quantitative mapping from weighted images using low-resolution labels1Biomedical Imaging Research Institute, Cedars-Sinai Medical Center, Los Angeles, CA, United States, 2Department of Bioengineering, UCLA, Los Angeles, CA, United States
Synopsis
Deep learning methods have been developed to estimate quantitative maps from conventional weighted images, which has the potential to improve the availability and clinical impact of quantitative MRI. However, high-resolution labels required for network training are not commonly available in practice. In this work, a hybrid supervised and physics-informed self-supervised loss function was proposed to train parameter estimation networks when only limited low-resolution labels are accessible. By taking advantage of high-resolution information from the input weighted images, the proposed method generated sharp quantitative maps and had improved performance over the supervised training method purely relying on the low-resolution labels.
Introduction
Quantitative MRI has the benefits of improved reproducibility and sensitivity when compared with conventional weighted MRI1,2. Recently, deep learning (DL) methods have been developed to estimate quantitative parameter maps from conventional weighted images commonly used in clinical practice3,4. These approaches do not require the actual acquisition of specialized quantitative MRI sequences and thus may remarkably improve the availability and clinical impact of quantitative MRI. However, high-resolution label maps required for the training of neural networks are hard to obtain. In this study, we propose to use an additional physics-informed self-supervised edge loss to train networks with low-resolution quantitative maps as labels. The proposed method is demonstrated to preserve the high-resolution information from the input weighted images even when only limited, low-resolution labels are accessible.Methods
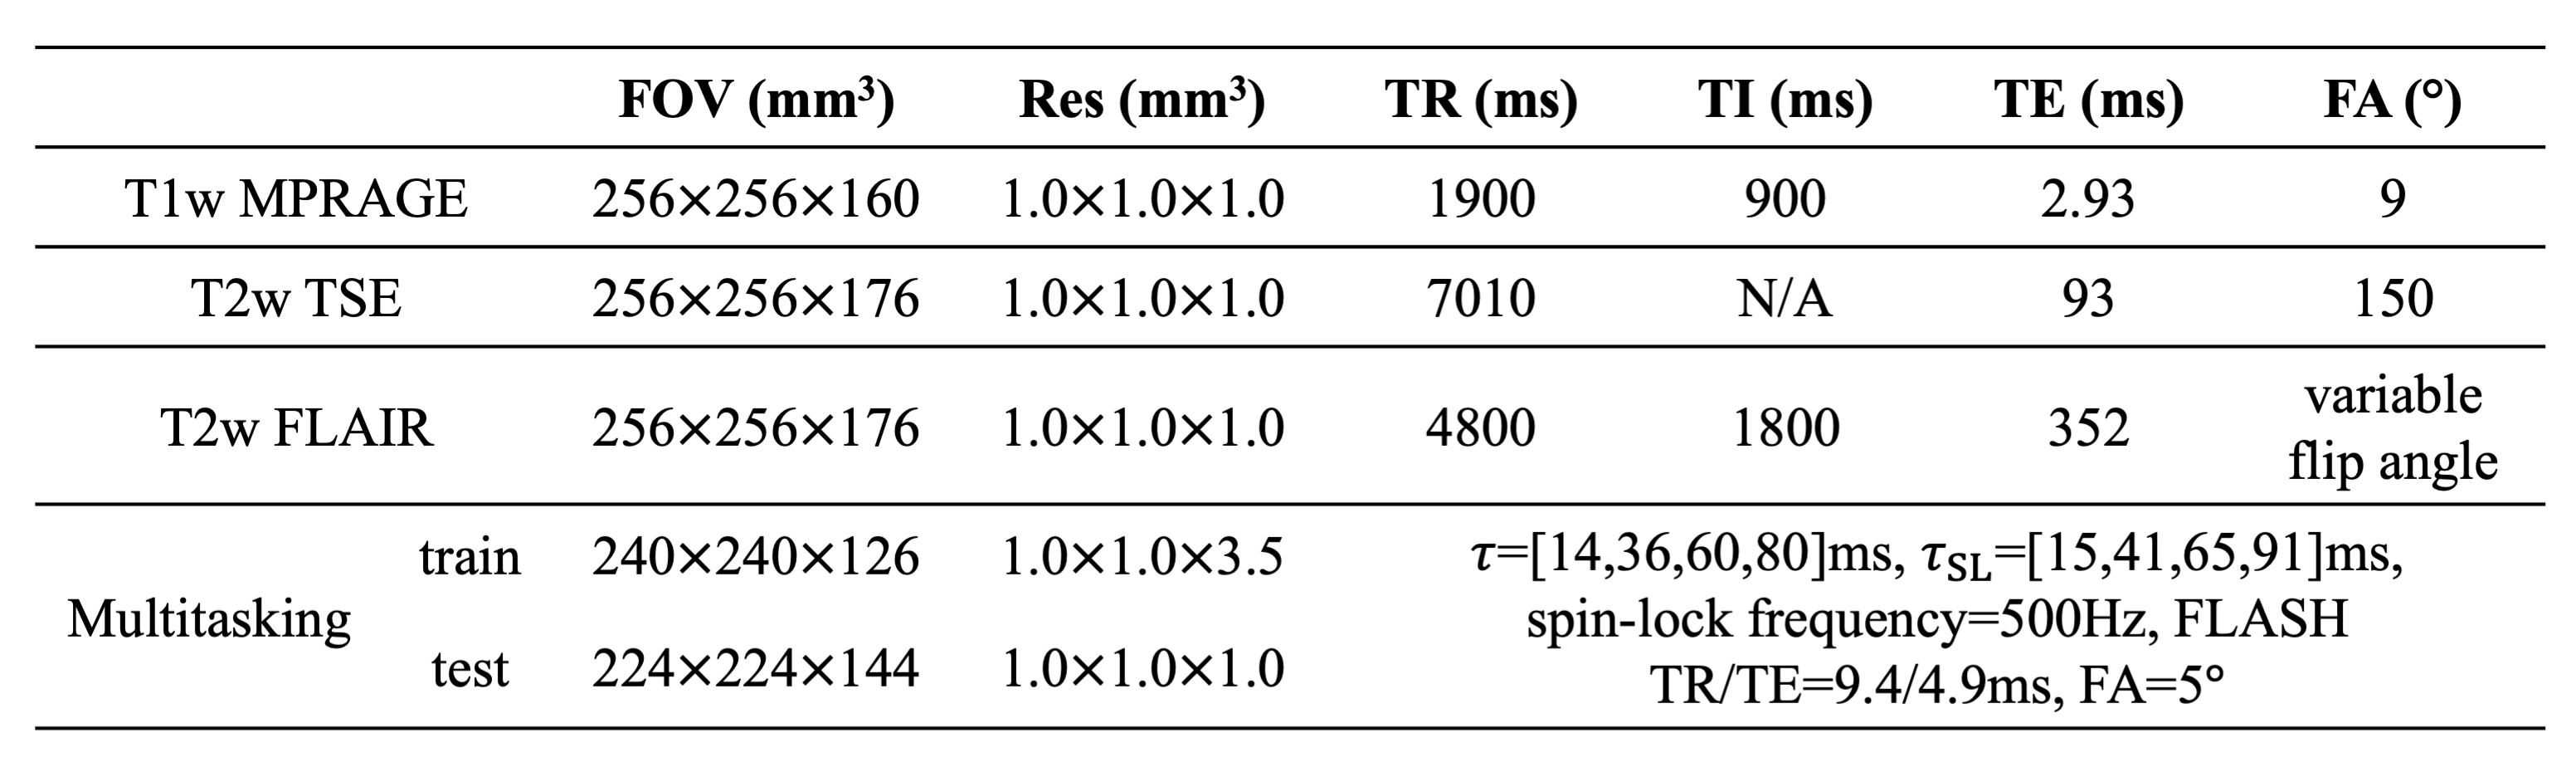
Data acquisitionFour healthy volunteers were scanned on a 3T Siemens Biograph mMR scanner. Three subjects (417 slices) were used for training and one subject (133 slices) was used for testing. Three conventional weighted contrasts, including T1w MPRAGE, T2w TSE and T2w FLAIR, were acquired with 1 mm isotropic resolution. An MR Multitasking sequence5 was used to obtain co-registered T1, T2, and M0 maps. For the training cases, label maps were acquired with resolution = 1.0×1.0×3.5 mm3. For the testing case, 1 mm isotropic maps were acquired as the reference for performance evaluation. Imaging parameters are listed in Table 1. To highlight the performance differences, sagittal slices of weighted images (1.0×1.0 mm2) and maps (1.0×3.5 mm2, interpolated to 1.0×1.0 mm2) were used as inputs and labels for the network, respectively.
Network and loss function
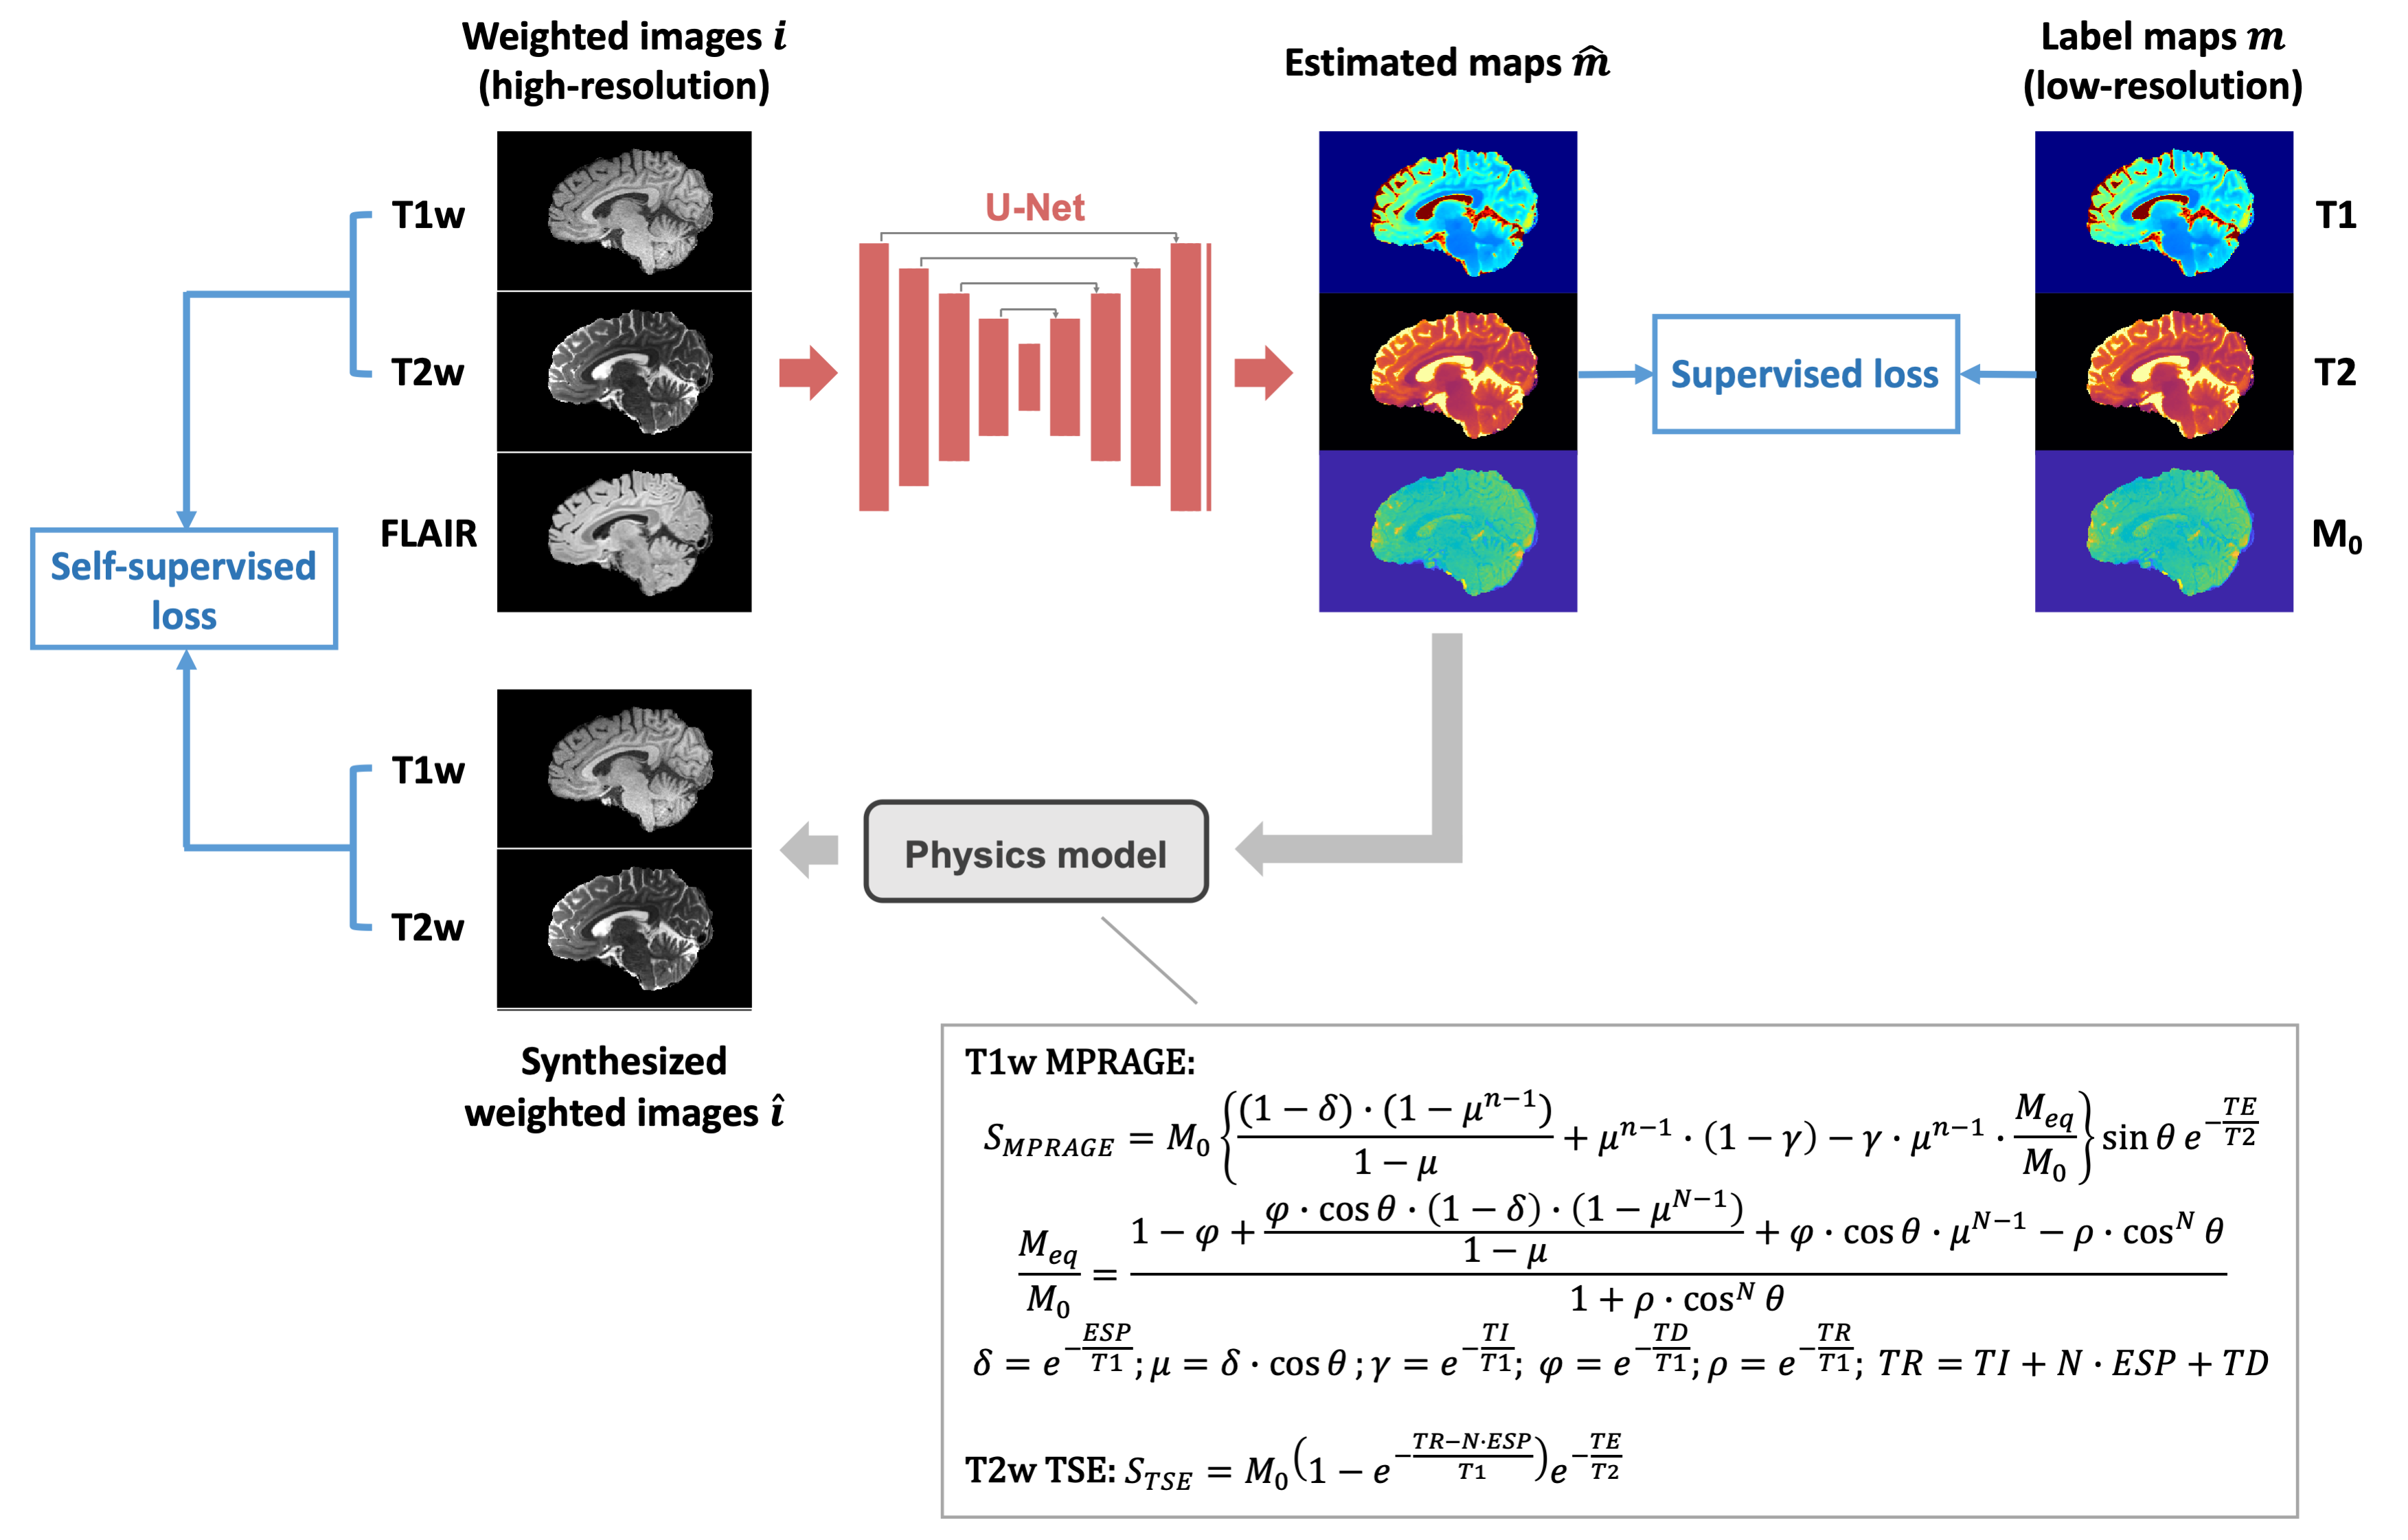
A U-net-based architecture described previously3 was used to estimate T1, T2 maps and an approximate M0 map from conventional T1w, T2w and T2w FLAIR images. The outputs of the network were passed to a physics model, which generates synthesized weighted images according to Bloch equations (Figure 1). Aside from the supervised loss computed between the network outputs and the low-resolution label maps, a self-supervised loss calculated between the synthesized weighted images and the input high-resolution weighted images was introduced. L1 loss was selected as the supervised loss. For the self-supervised loss, an edge loss6 was used to urge the network to preserve the high-frequency information of the inputs, which are higher-resolution than the labels. Specifically, Sobel filters were applied to generate edge maps from the weighted images. A scaling-invariant L1 loss7 was used to calculate the differences between the edge maps. The final loss function is$$L_{\text {total}}=L_{\text{sup}}(\hat{\boldsymbol{m}},\boldsymbol{m})+\lambda L_{\text {self}-\text {sup}}(\hat{\boldsymbol{\imath}},\boldsymbol{i})$$$$L_{sup}(\hat{\boldsymbol{m}},\boldsymbol{m})=L_{1}(\hat{\boldsymbol{m}},\boldsymbol{m})$$$$L_{\text{self}-\sup}(\hat{\boldsymbol{\imath}},\boldsymbol{i})=L_{1}(a\cdot\boldsymbol{S} \hat{\boldsymbol{\imath}},\boldsymbol{S}\boldsymbol{i})$$$$a=\arg\min_{a}\|a\cdot\boldsymbol{S}\hat{\boldsymbol{\imath}}-\boldsymbol{Si}\|_{2}^{2}$$where $$$\boldsymbol{m}$$$ is label map, $$$\hat{\boldsymbol{m}}$$$ is estimated map, $$$\boldsymbol{i}$$$ is acquired weighted image, $$$\hat{\boldsymbol{\imath}}$$$ is synthesized weighted image, $$$\boldsymbol{S}$$$ is a Sobel operator, and $$$\lambda$$$ is a weighting parameter.
Considering the modeling complexity of T2w FLAIR images in the dataset, which were acquired using a SPACE sequence, only T1w MPRAGE and T2w TSE were used in the self-supervised part. For T2w TSE, a simplified signal model derived from 180° turbo spin echo sequence was used.
Evaluation
The proposed hybrid loss function was compared with the baseline supervised loss. Both methods were evaluated on the testing subject with 1.0×1.0 mm2 reference maps. Because the reference M0 maps are not true quantitative proton density maps, the evaluation was only performed on T1 and T2 maps. Quantitative metrics including mean percentage error (MPE), PSNR, SSIM and high-frequency error norm (HFEN)8 were calculated between the DL results and the high-resolution reference. Paired t-tests were performed as statistical analysis.
Results
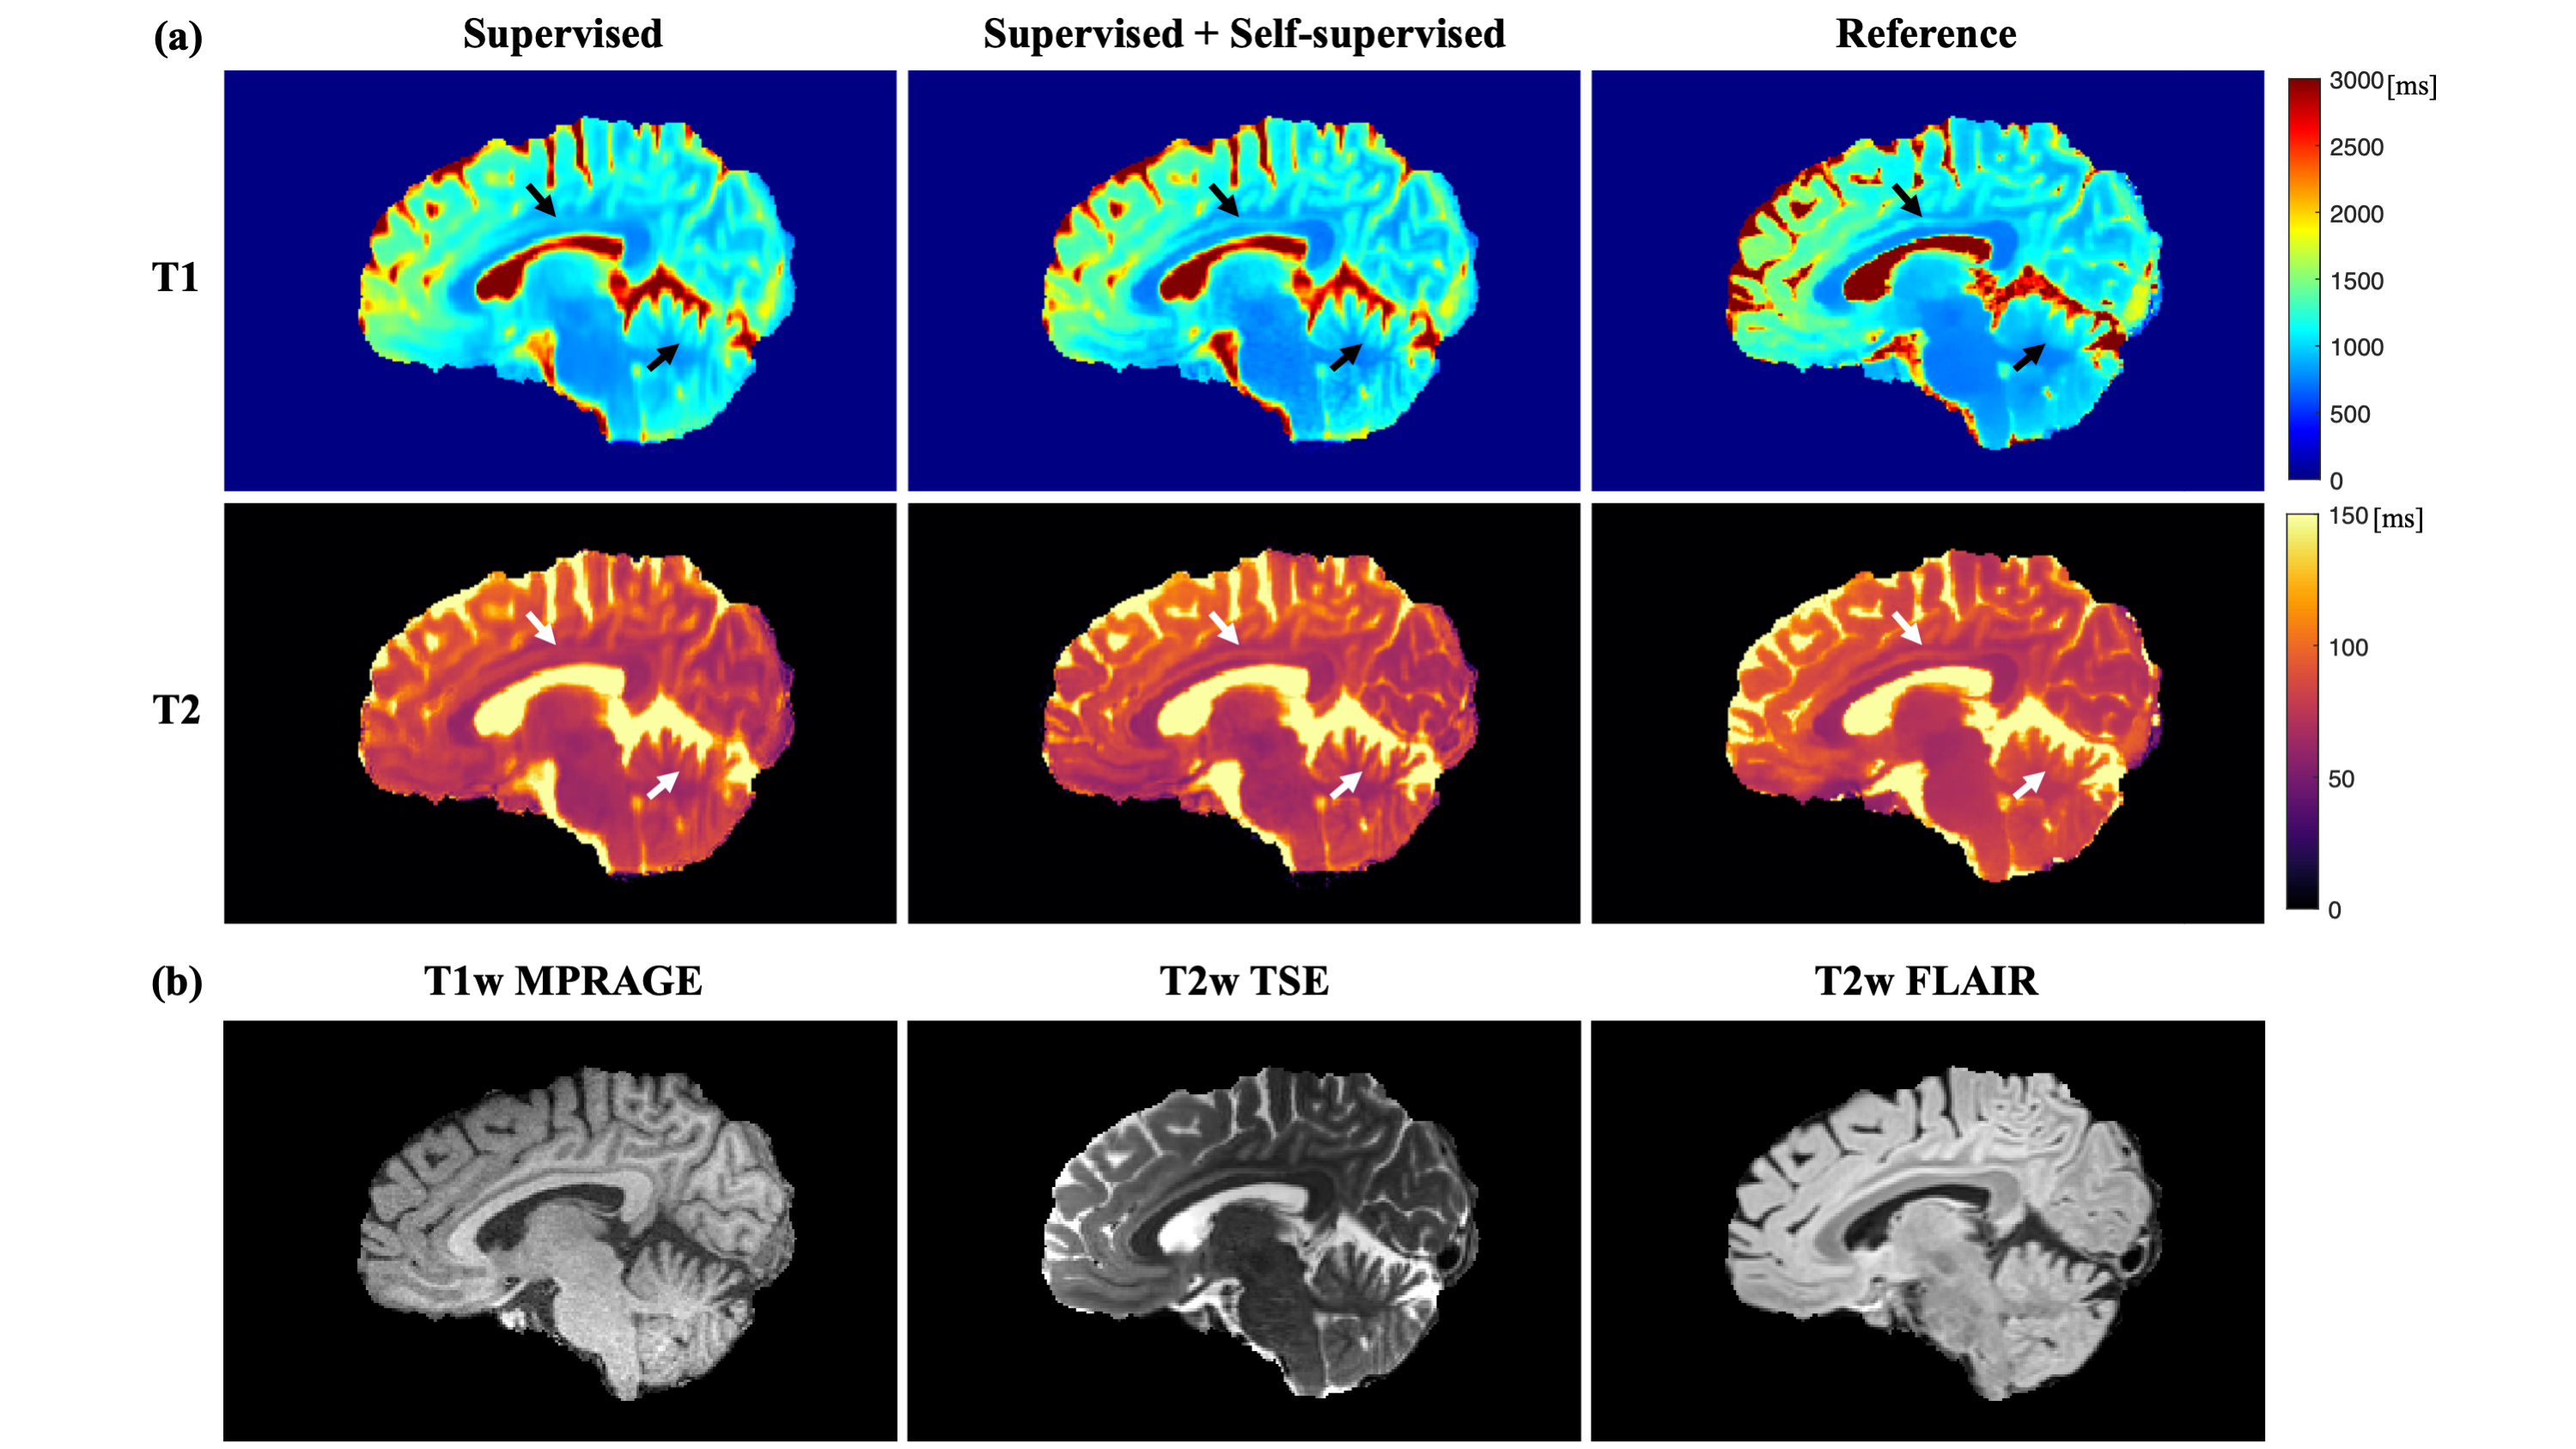
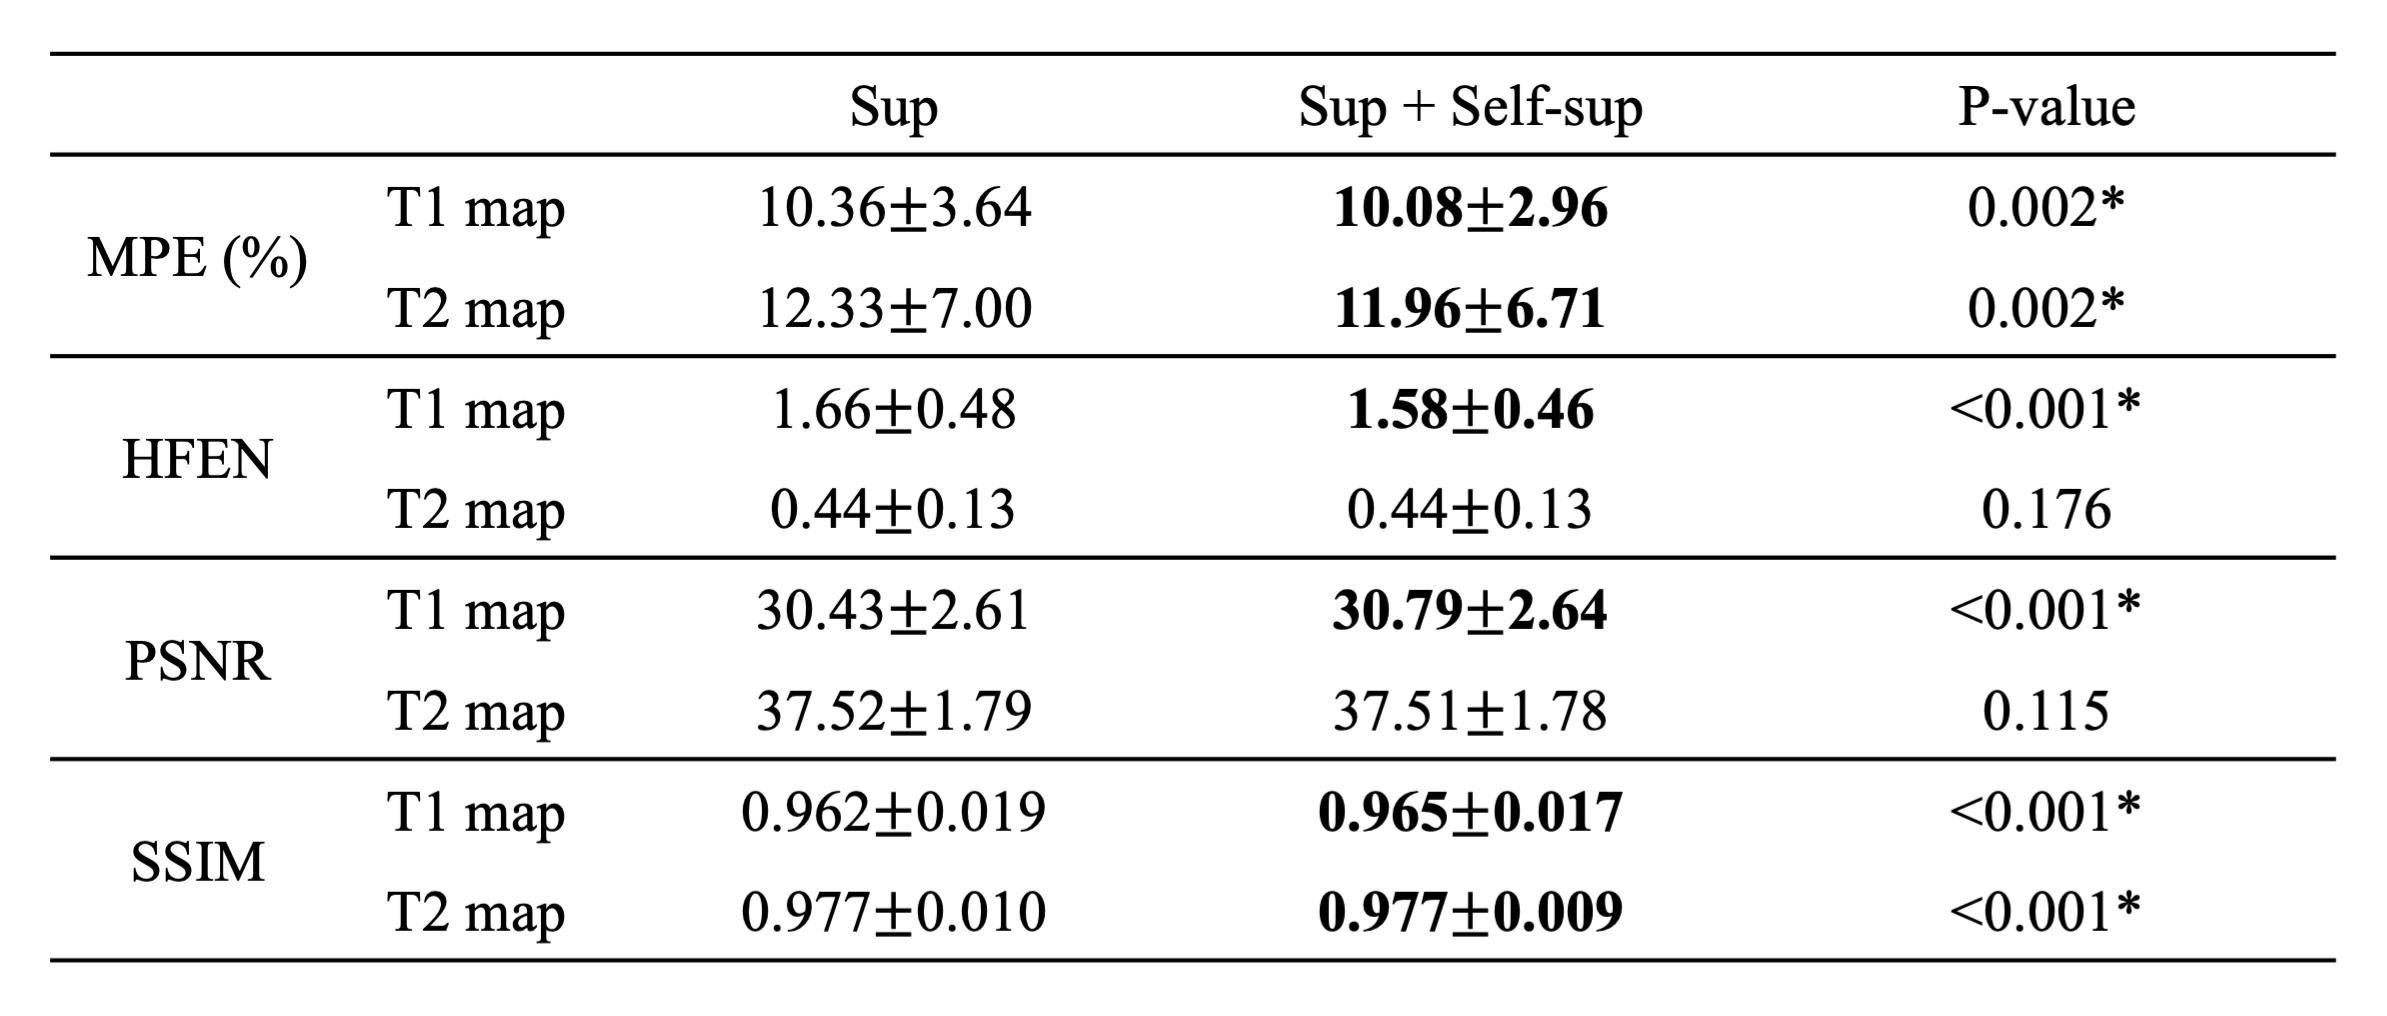
As shown in Figure 2, the proposed method generated much sharper maps than the supervised-only training and preserved the structure details from the weighted images. For quantitative metrics (Table 2), the proposed method achieved significantly lower MPE and HFEN, and significantly higher PSNR and SSIM than the baseline on T1 maps. It also had significantly lower MPE and higher SSIM on T2 maps. No significant difference was observed between the two methods for HFEN and PSNR on T2 maps.Discussion
The proposed method generated sharp T1 and T2 maps when trained with limited low-resolution labels and achieved better performance than supervised-only training on most of the quantitative metrics. The similar HFEN and PSNR on T2 maps between the two methods may be associated with the imperfect modeling and imperfect references. In this work, a simplified signal model was used for T2w TSE, and T2w FLAIR was not included in the self-supervised training. While the use of scaling-invariant edge loss may enhance the robustness to model imperfection, more precise models and more contrasts in the self-supervised training may further improve the results. Besides, the reference high-resolution maps used for evaluation can have an effective resolution lower than 1.0×1.0 mm2 due to aggressive acceleration. The proposed method should be evaluated using references with higher quality and a larger dataset in the future.Conclusion
A hybrid supervised and self-supervised loss was proposed to improve the DL-based quantitative parameter estimation from conventional weighted images when only limited low-resolution labels are available. The proposed approach significantly improved the accuracy of the resultant quantitative maps compared with supervised learning alone. With this approach, converting qualitative weighted images to quantitative maps with resolution-mismatched labels is feasible, which facilitates its clinical application.Acknowledgements
No acknowledgement found.References
1. Cheng HL, Stikov N, Ghugre NR, Wright GA. Practical medical applications of quantitative MR relaxometry. J Magn Reson Imaging. 2012;36(4):805-824.
2. Roujol S, Weingartner S, Foppa M, et al. Accuracy, precision, and reproducibility of four T1 mapping sequences: a head-to-head comparison of MOLLI, ShMOLLI, SASHA, and SAPPHIRE. Radiology. 2014;272(3):683-689.
3. Qiu S, Chen Y, Ma S, et al. Multiparametric mapping in the brain from conventional contrast-weighted images using deep learning. Magn Reson Med. 2021. https://doi.org/10.1002/mrm.28962.
4. Wu Y, Ma YJ, Du J, Xing L. Deciphering tissue relaxation parameters from a single MR image using deep learning. In Medical Imaging 2020: Computer-Aided Diagnosis. Proceedings of SPIE, Houston, TX, 2020. p. 113140Q. https://doi.org/10.1117/12.2546025.
5. Ma S, Wang N, Fan Z, et al. Three-dimensional whole-brain simultaneous T1, T2, and T1ρ quantification using MR multitasking: method and initial clinical experience in tissue characterization of multiple sclerosis. Magn Reson Med. 2021;85(4):1938-1952.
6. Yu B, Zhou L, Wang L, Shi Y, Fripp J, Bourgeat P. Ea-GANs: Edge-Aware Generative Adversarial Networks for Cross-Modality MR Image Synthesis. IEEE Trans Med Imaging. 2019;38(7):1750-1762.
7. Wang K, Doneva M, Amthor T, Keil VC, Karasan E, Tan F, et al. High Fidelity Direct-Contrast Synthesis from Magnetic Resonance Fingerprinting in Diagnostic Imaging. In Proc ISMRM, 2020, pp. 867.
8. Ravishankar S, Bresler Y. MR image reconstruction from highly undersampled k-space data by dictionary learning. IEEE Trans Med Imaging. 2011;30(5):1028-1041.
9. Wang J, He L, Zheng H, Lu ZL. Optimizing the magnetization-prepared rapid gradient-echo (MP-RAGE) sequence. PloS one. 2014;9(5):e96899.
10. Conturo TE, Beth AH, Arenstorf RF, Price RR. Simplified mathematical description of longitudinal recovery in multiple-echo sequences. Magn Reson Med. 1987;4(3):282-288.
Figures