2608
Image enhancement of Quasi-Diffusion Imaging using a fully connected neural network1St George's, University of London, London, United Kingdom, 2King's College London, London, United Kingdom, 3University of Lincoln, Lincoln, United Kingdom
Synopsis
A fully connected neural network (FCN) was trained to map a short diffusion weighted image acquisition to high quality Quasi-Diffusion Imaging (QDI) parameter maps. The FCN produced denoised and enhanced QDI parameter maps compared to weighted least squares fitting of data to the QDI model. The FCN shows generalisation to unseen pathology such as grade IV glioma dMRI data and demonstrates the FCN can produce high quality QDI tensor maps from clinically feasible 2 minute data acquisitions. An FCN further enhances the ability of QDI to provide non-Gaussian diffusion imaging within clinically feasible acquisition times.
Introduction
Quasi-Diffusion Imaging (QDI) uses a novel non-Gaussian diffusion model for describing diffusion within tissue microstructure [1]. QDI parameterises diffusion as a rate of decay, D1,2 (with usual units of mm2s-1) and α (typical range 0.5≤α≤1), which represents deviation from unrestricted Gaussian diffusion (α=1). Images of mean D1,2 and α and their anisotropies can be obtained from a clinically viable two-minute acquisition using 3 b-values and 6 diffusion directions [1].Artificial intelligence (AI) is a popular tool for improving image quality [2] and the fully connected neural network (FCN) as a universal function approximator lends itself to QDI optimisation for denoising and image enhancement. AI can be trained to map data from a low-quality image (i.e. fast acquisition or low resolution) to a higher quality than clinically applicable acquisitions [3].
We apply a FCN to the task of mapping clinically viable 6 diffusion direction 3 b-value diffusion-weighted magnetic resonance imaging (dMRI) data to high quality QDI target maps calculated from 32 direction 5 b-value dMRI (QDI_32-5). We make a three-way comparison of parameter maps generated from the FCN, the gold standard (QDI_32-5), and QDI maps calculated from an optimised clinically feasible 6 direction, 3 b-value dMRI acquisition (QDI_6-3) [1,4]. We further apply the AI processing method to brain tumour dMRI to assess transferability to pathological data.
Methods
Image datasets: Whole brain axial dMRI data was acquired (22 slices, 1.5mmx1.5mmx5mm), with 1.2mm3 isotropic 3D T1-weighted images for defining specific anatomical regions of interest. A healthy volunteer supplied the 32 direction 5 b-value dMRI (b=0,1100,2250,3500,5000 s mm-2, acquisition time 16 mins 48 secs). Six direction 3 b-value dMRI data (b=0,1100,5000 s mm-2, acquisition time 2 mins) was acquired from the same control and from patients with brain tumours.Pre-processing: Skull-stripping and co-registering of T1-weighted images to QDI data. QDI maps were processed voxel-wise according to the quasi-diffusion equation [1] to provide D1,2, α mean and anisotropy maps. No data smoothing was applied.
Model training: FCN was trained in Spyder using Python 3.7.9 and Pytorch 1.2.0 on a Tesla k40c GPU. The network structure had fixed hidden layers of a size 2v+10 in line with [5], where v is the length of the input vector as shown in Fig.1. Input data was a thirteen-element vector of dMRI signal at b=0,1100, and 5000 s mm-2 in 6 diffusion directions. The target was D1,2, α mean and anisotropy maps given by QDI_32-5. Training was performed voxel-wise for 25-epochs using ADAM optimiser where training and validation datasets comprised shuffled hemispheres from the target image. The mean squared error was calculated voxel-wise across all target QDI maps. We also trained a further 4 FCNs on individual QDI target maps given by QDI_32-5.
Statistical analysis: Comparison between AI prediction, QDI_32-5 and QDI_6-3 results was performed using paired t-tests of the means (µ) and standard deviations (σ) of QDI parameters (D1,2, α mean and anisotropy) calculated within 13 anatomical regions of interest (ROIs) in the control subject.
Results
Figure 2 shows the gold standard QDI_32-5 maps (top-row) to QDI_6-3 (middle-row) and FCN (bottom-row). No significant differences in µ of any QDI parameter across anatomical ROIs (Table 1) indicating the FCN did not introduce measurement bias. Significant differences in σ were found between FCN and QDI_6-3 in α and α anisotropy (p<0.05, Table 1). This is observed as a visual improvement in Fig.2. FCN also visually improved image quality of the α-anisotropy map and reduced σ compared to the gold standard QDI_32-5 (p=0.15).As FCN derived anisotropy maps of D1,2 and α appear visually similar, we investigated training the FCN independently on D1,2 and α anisotropies to determine whether the combined network has introduced co-dependence between these parameters. Figure 3 shows strong correlations between mean D1,2 and α anisotropies in anatomical ROIs for: separate single output FCN; four-output FCN; and for QDI_6-3 and QDI_32-5.
Figure 4 shows a comparison of QDI_6-3 parameter maps (top-row) compared to the FCN QDI maps (bottom-row) for a grade IV glioma. The FCN denoises and improves upon the QDI_6-3 parameter maps.
Discussion and Conclusion
FCN provided image enhancement and significant noise reduction for α and D1,2 anisotropies in volunteer and clinical patient data, whilst maintaining accuracy in absolute parameter measures. Images from the QDI protocol optimised for rapid acquisition for clinical studies [4] were further improved and strong correlations were observed between the anisotropies of D1,2 and α across a wide range of tissue regions for all image data sets. Here we have used a simple anisotropy measure based on an ellipsoidal (tensor)approximation to dMRI data. Our results suggest there is little independence of D1,2 and α anisotropy in normal tissue. Further work using more complex anisotropy representations are required on high angular resolution dMRI [6].Although our FCN was trained on healthy brain data, it performed well on glial tumour data (high-grade in Fig.4 and low-grade data not shown). This suggests the FCN is modelling the mathematical function underlying the QDI model as well as rejecting noisy information. Further work will include reverse engineering the network to better understand its processing functionality and to apply transfer learning to include actual tumour data within the optimisation.
Acknowledgements
MRCLID studentship
St George's, University of London Innovation Award
References
References
[1] Barrick, T.R., Spilling, C.A., Ingo, C., Madigan, J., Isaacs, J.D., Rich, P., Jones, T.L., Magin, R.L., Hall, M.G. and Howe, F.A., 2020. Quasi-diffusion magnetic resonance imaging (QDI): A fast, high b-value diffusion imaging technique. Neuroimage, 211, p.116606.
[2] Csáji, B.C., 2001. Approximation with artificial neural networks. Faculty of Sciences, Etvs Lornd University, Hungary, 24(48), p.7.
[3] Efird, C., Neumann, S., Solar, K.G., Beaulieu, C. and Cobzas, D., 2021, April. Hippocampus Segmentation On High Resolution Diffusion MRI. In 2021 IEEE 18th International Symposium on Biomedical Imaging (ISBI) (pp. 1369-1372). IEEE.
[4] Spilling, C.A., Howe, F.A. and Barrick, T.R., 2020, October. Quasi-Diffusion Magnetic Resonance Imaging (QDI): Optimisation of Acquisition Protocol. In Proceedings of the International Society for Magnetic Resonance in Medicine Virtual Conference & Exhibition, Paris, France (pp. 8-13).
[5] Yarotsky, D., 2018, July. Optimal approximation of continuous functions by very deep ReLU networks. In Conference on Learning Theory (pp. 639-649). PMLR.
[6] Glenn, G.R., Helpern, J.A., Tabesh, A. and Jensen, J.H., 2015. Quantitative assessment of diffusional kurtosis anisotropy. NMR in Biomedicine, 28(4), pp.448-459.
Figures
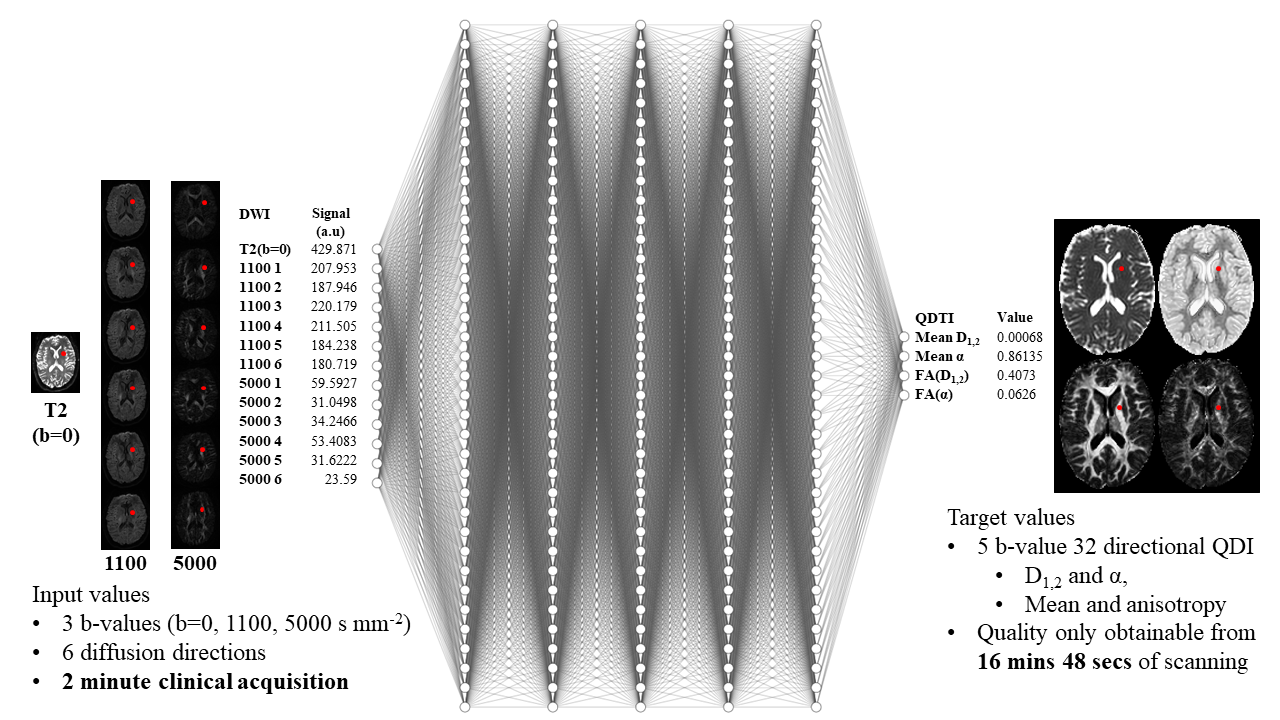
Figure 1: System overview for a fully connected neural network training process where input data comprises 3 b-values at b=0, 1100, and 5000 s mm-2 (a clinically feasible 2 minute dMRI acquisition). The target of the neural network is D1,2 and α mean and anisotropy estimated by quasi-diffusion model fitting to a 5 b-value, 32 direction dMRI (acquired in 16mins 48 secs). The training process was performed over 25 epochs using mean squared error and ADAM optimiser for network adjustment.
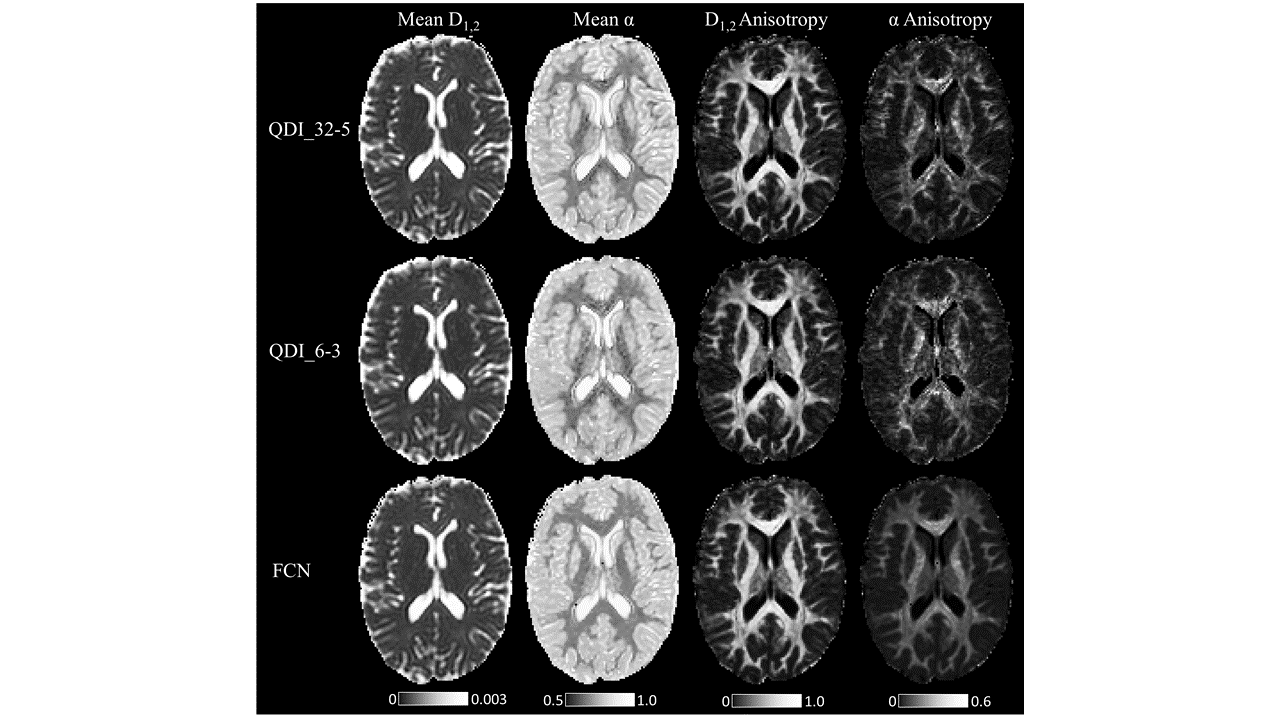
Figure 2: QDI maps calculated by fitting the quasi-diffusion model to the 32 direction 5 b-value gold standard (QDI_32-5, top row), fitting the quasi-diffusion model to an optimised clinically feasible acquisition with 3 b-values and 6 directions (QDI_6-3, middle row), and by the FCN (bottom row). The FCN accepts the same dMRI 2-minute acquisition as input, as the quasi-diffusion model fitting for the QDI_6-3 maps. Maps of mean D1,2, mean α, D1,2 anisotropy and α anisotropy are presented.
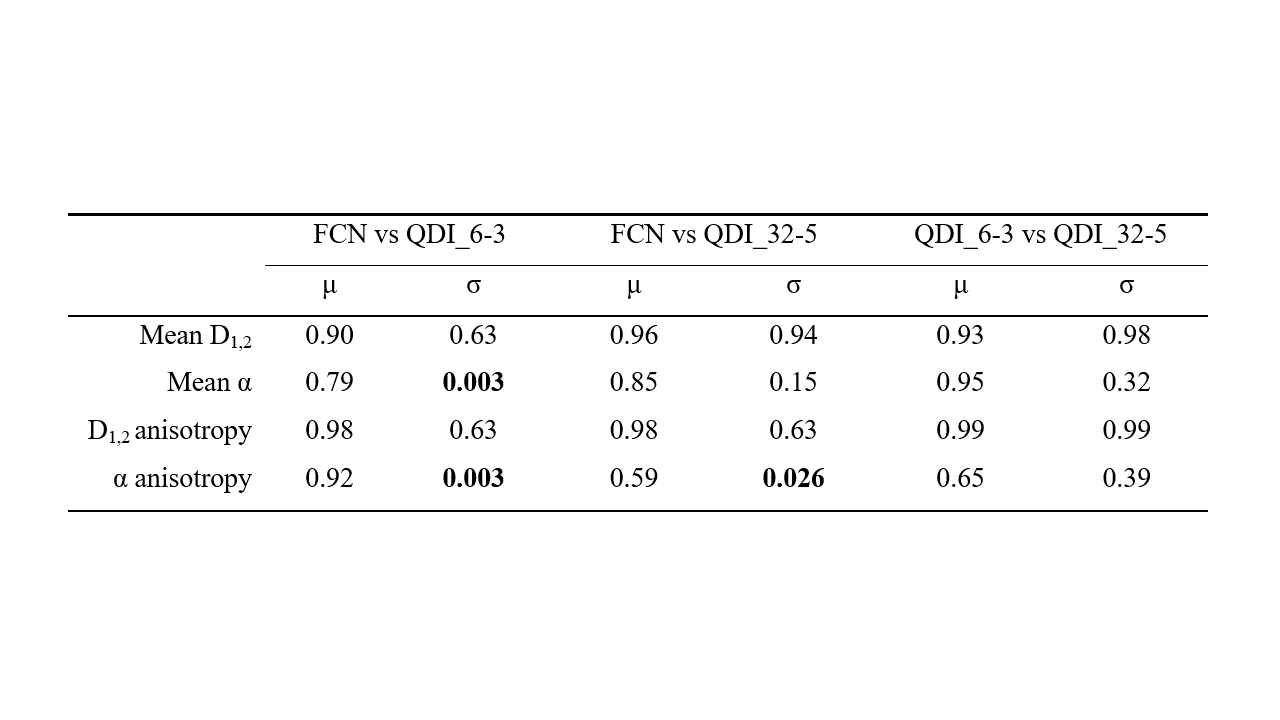
Table 1: Results of statistical comparison of means and standard deviations of anatomical regions of interest obtained by the FCN, by quasi-diffusion model fitting to the optimised clinically feasible acquisition (QDI_6-3) and by quasi-diffusion model fitting to the gold standard (QDI-32-5). Two tailed paired t-tests were performed between mean values, and standard deviations for mean D1,2, mean α, D1,2 anisotropy and α anisotropy. p-values are presented.
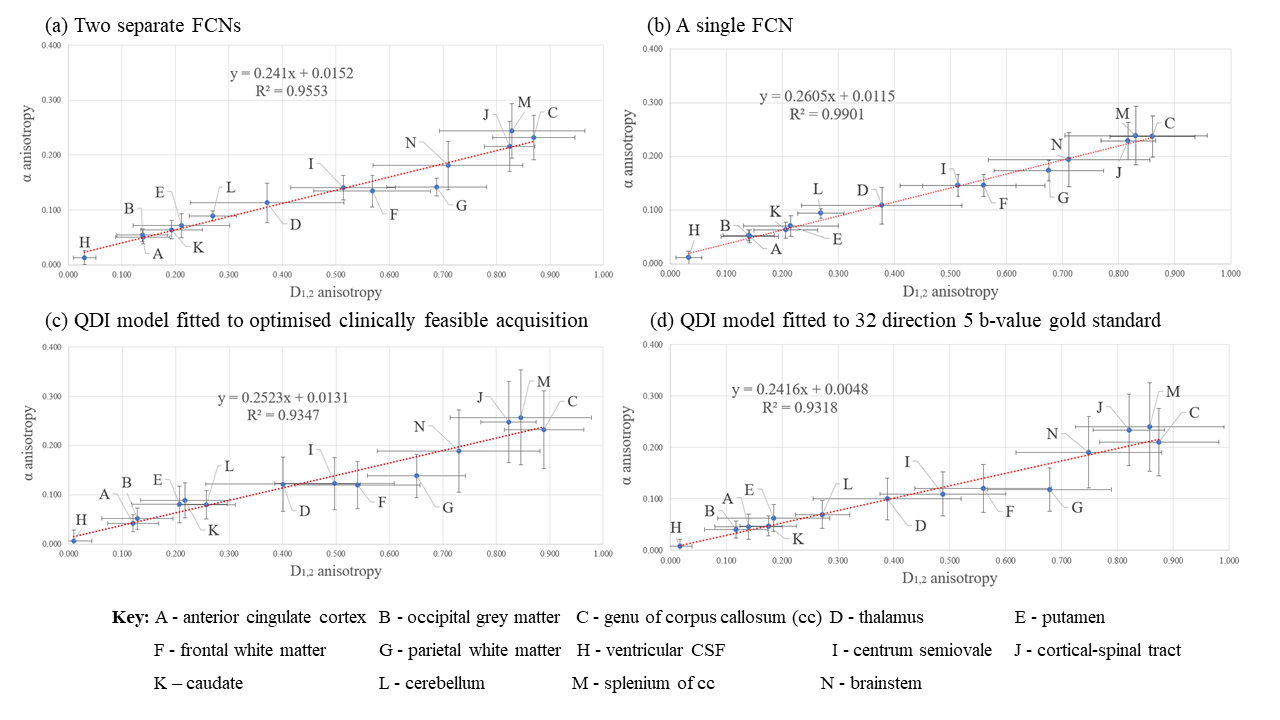
Figure 3: Scatter plots of anatomical regions of interest illustrating α anisotropy against D1,2 anisotropy. Plots show D1,2 and α anisotropy: (a) output from two separate FCNs, and (b) output by a single FCN that also included mean D1,2 and mean α outputs, (c) estimated by fitting the QDI model to the optimised clinically feasible acquisition (QDI_6-3), and (d) estimated by fitting the QDI model to the gold standard (QDI_32-5, top row). Error bars represent voxel standard deviations.
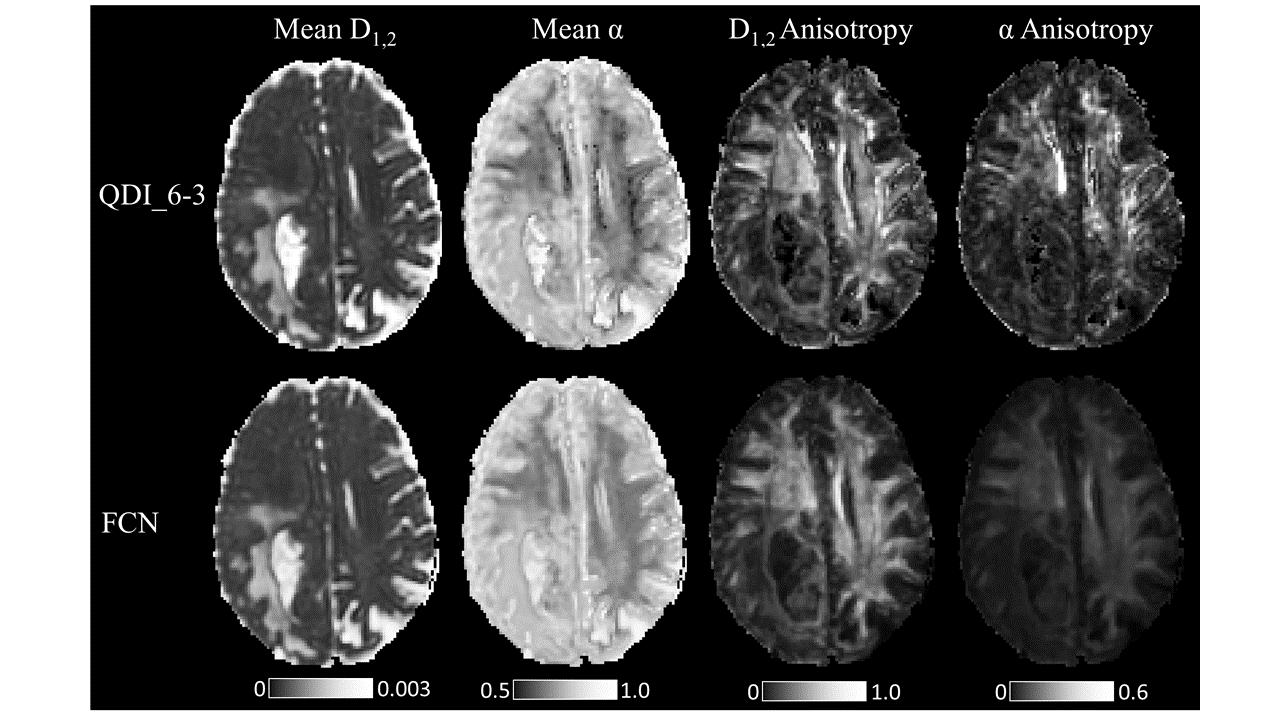
Figure 4: QDI maps of a grade IV glioma calculated by quasi-diffusion model fitting from the optimised clinically feasible acquisition (QDI_6-3, top row), and by the FCN (bottom row). The FCN accepts the same dMRI 2-minute acquisition as input, as the quasi-diffusion model fitting for the QDI_6-3 maps. Maps of mean D1,2, mean α, D1,2 anisotropy and α anisotropy are presented.