2604
Quantitative Radiomic Features of Deep Learning Image Reconstruction in MRI1Imaging, Cambridge University Hospitals NHS Foundation Trust, Cambridge, United Kingdom, 2Department of Radiology, University of Cambridge, Cambridge, United Kingdom
Synopsis
Radiomic features are sensitive to changes in imaging parameters in MRI. This makes it challenging to develop robust machine learning models using imaging features. We explore the effect of clinically available deep learning image reconstruction on the performance of radiomic features. Correlation coefficient values varied (0.56 - 1.00) when comparing radiomic features of deep learning reconstructed images and ‘conventional’ MRI scans. The noise reduction level had a large impact on correlation coefficients, but variations were also significant between different types of imaging feature. Identification of highly correlated features may help identify more stable sets of radiomic features for machine learning.
Introduction
Deep learning reconstruction (DLR) of MR images has the potential to increase the signal to noise ratio (SNR) and sharpness while reducing ringing artifact. The DLR method evaluated in this study (AIRTM Recon DL, GE Healthcare, Waukesha, WI) uses a convolutional neural network (CNN) trained with a supervised learning approach using pairs of images representing near-perfect and conventional MRI images (1). The near-perfect training data consisted of high-resolution images with minimal ringing and very low noise levels.Phantom studies have shown that many radiomic features are non-robust to changing MRI parameters (2). In radiomic analysis of breast cancer tumours, the Signal to Noise Ratio (SNR) and image resolution were found to significantly impact results, with better reproducibility of imaging features at higher SNR levels (3). In healthy volunteers, reproducibility of imaging features between 1.5T and 3T were significantly different in over 70% of features evaluated (4).
Improved image quality from DLR may increase a radiologist’s diagnostic confidence. However, it is possible that DLR may reduce the effectiveness of existing image-based machine learning algorithms developed from ‘conventional’ MRI scans. Additionally, for new radiomic-driven models it is important to find the most stable set of image based features. In this study we examine the impact of DLR on radiomic biomarkers frequently used to create machine learning models from MRI at varying noise reduction levels.
Method
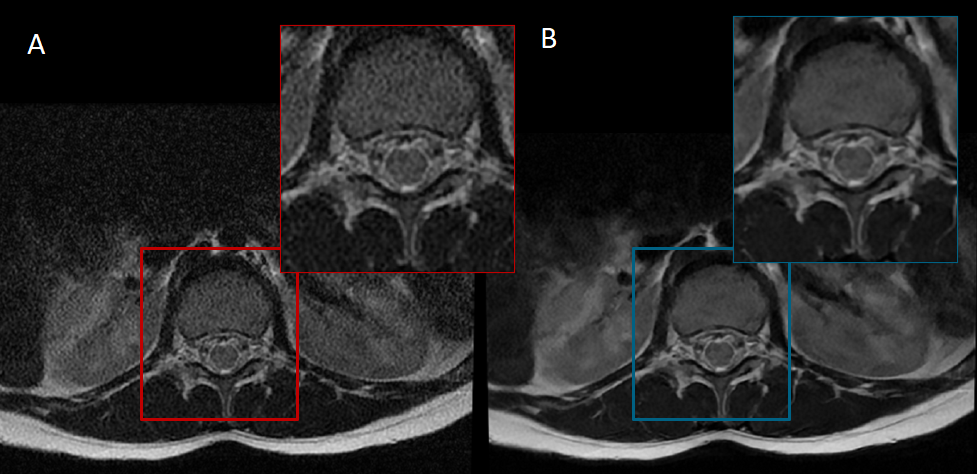
The AIRTM Recon DL CNN accepts a user-specified denoising level, a scalar parameter between 0 and 1 representing the fraction of the estimated noise variance to be removed. In its clinical implementation, the noise-reduction levels available are limited to high (0.75), medium (0.5) or low (0.3). Our study used clinical 1.5 T MRI scans comprising a range of T1-weighted, T2-weighted and PD-weighted images. The DLR strengths were: high (8 head, 7 knee, 25 spine MRI), medium (5 head, 11 knee, 19 spine MRI) and low (15 Spine MRI). Each study comprised pairs of images reconstructed using both the DLR algorithm and the conventional algorithm. An example pair is shown in Figure 1.The radiomic biomarkers evaluated in this study were from the Image Biomarker Standardization Initiative (IBIS) and represent a consensus on standardized quantitative radiomic for high-throughput image-based phenotyping (5). A total of 487 features are available; however, we only evaluated 2D image biomarkers as the DLR algorithm currently only supports 2D images with high in-plane resolution and low out-of-plane resolution. Features were defined by family type, in total our analysis includes: 25 co-occurrence matrix features, 21 intensity histogram features, 22 neighbourhood grey tone difference matrix features, 16 run length matrix features, 17 size zone matrix features and 17 statistics features.
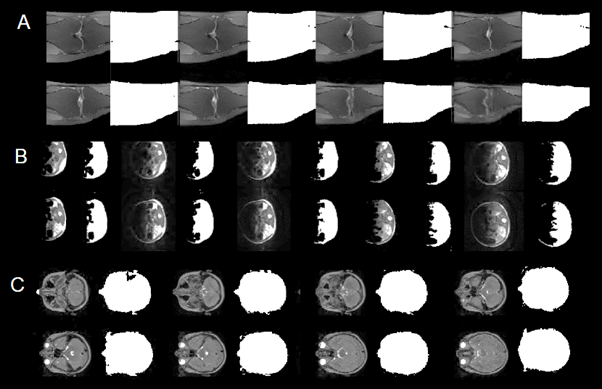
In typical radiomic models, features are extracted from segmentations of the tissue of interest (6) which have good SNR and contrast. For example, in an analysis pipeline for cancer studies, an ROI is usually selected to include the tumour or enhancing volume (7,8). To reflect this approach we segmented the conventional images using an active contour method to remove background or low-signal regions (9). The seed for the active contour is a mask that includes pixels greater than 0.5 times the mean pixel value. Examples are shown in Figure 2.
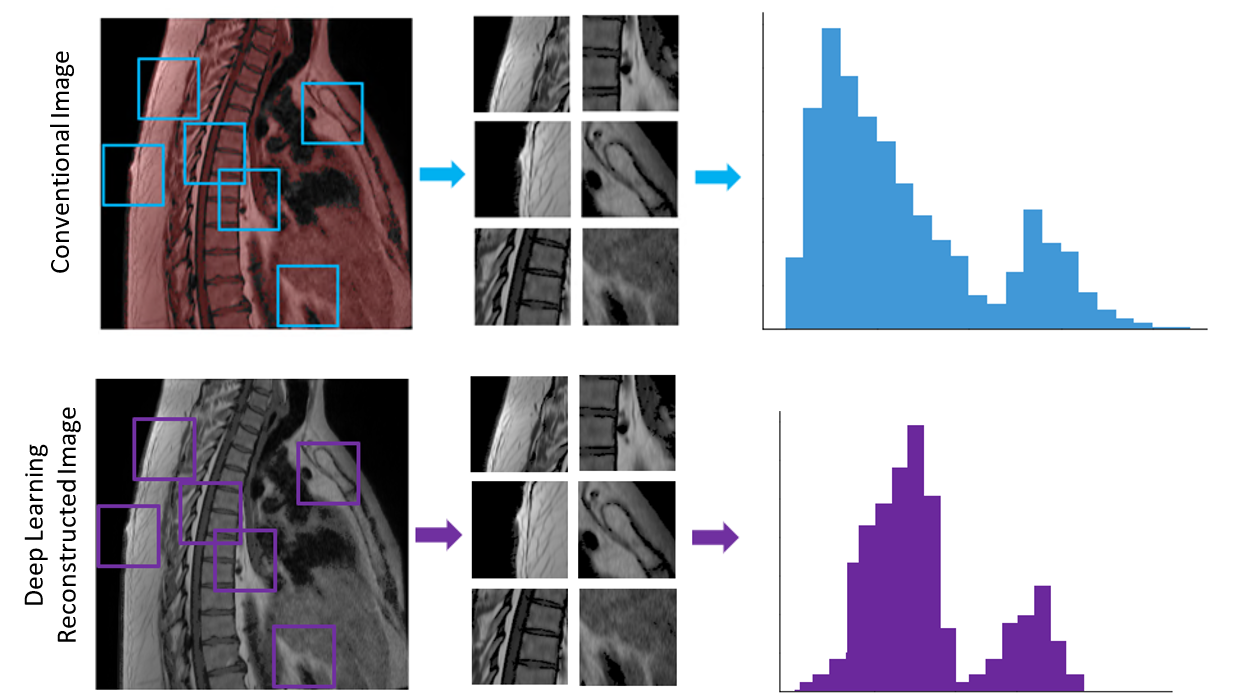
To provide a representative sample of data for each conventional MRI we randomly extracted 3D patches that covered 0.2×0.2×0.2 of the full matrix. A total of 20 patches whose volume contains at least 50% segmented ROI were saved. For the corresponding DLR MRIs the same 20 patches were extracted. The radiomic biomarkers were calculated and averaged over the 20 patches for both pairs of images (Figure 3). Pearson’s correlation coefficient was used to compare the radiomic biomarkers.
Results
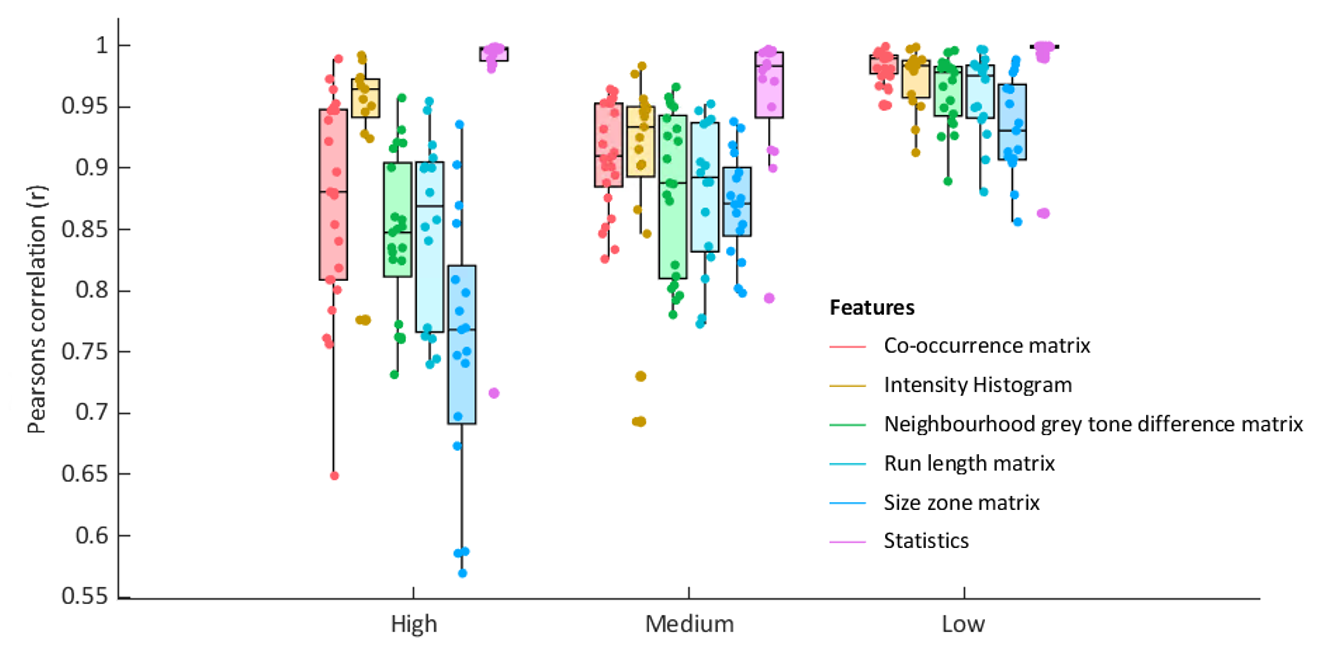
Pearson’s correlation coefficient comparing radiomic biomarkers from DLR images and conventional image reconstructions are shown in Figure 4. These are grouped by the type of biomarker and denoising levels.Discussion
Radiomic biomarkers determined from DLR images show a range of correlation coefficients when compared to conventional images. Increased noise reduction levels lead to lower correlation coefficients. The run length and size zone features have the widest range of correlation coefficients across all noise reduction levels in agreement with the visual appearance of smoother images (Figure 1). Across all noise reduction levels statistic descriptors have the highest average correlation coefficients suggesting these may be the most robust to changes in the DLR noise levels.Conclusion
Comparison of DLR reconstructed images with conventional images may help identify more stable sets of radiomic features that are robust to changes in noise levels. When planning imaging studies that incorporate radiomic biomarkers, features should be carefully chosen to limit the effects of image noise on the reproducibility of study outcomes.Acknowledgements
No acknowledgement found.References
1. Lebel RM, Healthcare GE. Performance characterization of a novel deep learning-based MR image reconstruction pipeline.
2. Cattell R, Chen S, Huang C. Robustness of radiomic features in magnetic resonance imaging: review and a phantom study. Vis Comput Ind Biomed Art [Internet]. 2019 Dec 1 [cited 2021 Nov 9];2(1). Available from: /pmc/articles/PMC7099536/
3. Roy S, Whitehead TD, Quirk JD, Salter A, Ademuyiwa FO, Li S, et al. Optimal co-clinical radiomics: Sensitivity of radiomic features to tumour volume, image noise and resolution in co-clinical T1-weighted and T2-weighted magnetic resonance imaging. undefined. 2020 Sep 1;59.
4. Ammari S, Pitre-Champagnat S, Dercle L, Chouzenoux E, Moalla S, Reuze S, et al. Influence of Magnetic Field Strength on Magnetic Resonance Imaging Radiomics Features in Brain Imaging, an In Vitro and In Vivo Study. Front Oncol. 2021 Jan 20;10:2950.
5. Zwanenburg A, Vallières M, Abdalah MA, Aerts HJWL, Andrearczyk V, Apte A, et al. The image biomarker standardization initiative: Standardized quantitative radiomics for high-throughput image-based phenotyping. Radiology [Internet]. 2020 May 1 [cited 2020 Sep 17];295(2):328–38. Available from: https://pubs.rsna.org/doi/abs/10.1148/radiol.2020191145
6. Gillies RJ, Kinahan PE, Hricak H. Radiomics: Images are more than pictures, they are data. Radiology [Internet]. 2016 Feb 1 [cited 2021 Nov 8];278(2):563–77. Available from: https://pubs.rsna.org/doi/abs/10.1148/radiol.2015151169
7. Zhang B, Tian J, Dong D, Gu D, Dong Y, Zhang L, et al. Radiomics Features of Multiparametric MRI as Novel Prognostic Factors in Advanced Nasopharyngeal Carcinoma. Clin Cancer Res [Internet]. 2017 Aug 1 [cited 2021 Nov 8];23(15):4259–69. Available from: https://clincancerres.aacrjournals.org/content/23/15/4259
8. Kniep HC, Madesta F, Schneider T, Hanning U, Schönfeld MH, Schön G, et al. Radiomics of brain MRI: Utility in prediction of metastatic tumor type. Radiology [Internet]. 2019 Mar 1 [cited 2021 Nov 8];290(3):479–87. Available from: https://pubs.rsna.org/doi/abs/10.1148/radiol.2018180946
9. Chan TF, Vese LA. Active contours without edges. IEEE Trans Image Process. 2001 Feb;10(2):266–77.
Figures