2597
Feasibility of Dynamic Contrast-free Vascular Magnetic Resonance Fingerprinting
Gregory J. Wheeler1, Quimby N. Lee2, Mary Kate Manhard3, Berkin Bilgic4, and Audrey P. Fan1,2
1Biomedical Engineering, University of California Davis, Davis, CA, United States, 2Neurology, University of California Davis, Davis, CA, United States, 3Radiology, Cincinnati Children's Hospital, Cincinnati, OH, United States, 4Radiology, Massachusetts General Hospital and Harvard Medical School, Boston, MA, United States
1Biomedical Engineering, University of California Davis, Davis, CA, United States, 2Neurology, University of California Davis, Davis, CA, United States, 3Radiology, Cincinnati Children's Hospital, Cincinnati, OH, United States, 4Radiology, Massachusetts General Hospital and Harvard Medical School, Boston, MA, United States
Synopsis
Vascular magnetic resonance fingerprinting (vMRF) using both magnitude and phase information can achieve reasonable vascular parameter maps of the brain without contrast agents. This approach combined with a rapid, multi-echo pulse sequence enables dynamic vascular function mapping of brain physiology. Here we begin to investigate the feasibility and tradeoffs of performing vMRF with only 5 echoes and a temporal resolution of 5 seconds. Initial findings indicate that reasonable fingerprint matching can be done with only 5 echoes and that the proposed sequence has adequate signal-to-noise ratio for reliable results.
Introduction
Magnetic resonance fingerprinting (MRF) is an innovative MR acquisition and reconstruction technique for quantitative multiparametric mapping.1 MRF utilizes biophysical simulations, in parallel to image acquisition, making it adaptable to numerous parameters of interest. Vascular MRF (vMRF) has leveraged this flexibility to enable simultaneous mapping of cerebral blood volume (CBV), microvascular vessel radii (R), and oxygen saturation (SO2).2 Maps are generated by matching the signal time-course of each voxel to simulated signal time-courses generated through biophysical simulations of microvascular brain vessels with known magnetic susceptibilities.Accurate vascular parameter map reconstruction with vMRF is dependent on using a MR pulse sequence in imaging and simulations that is sensitive to changes in blood oxygenation. Previous vMRF studies2,3 have used a gradient-echo sampling of free induction decay and echo (GESFIDE) sequence and contrast agents to produce vMRF parameters maps. These methods have relied solely on the signal magnitude of the images, but complex MRI signals also includes oxygenation-dependent signal phase information that is not typically exploited. The incorporation of phase information for contrast-free vMRF reconstruction and a fast spin- and gradient-echo (SAGE) pulse sequence4,5 for acquisition could allow for mapping multiple vascular parameters every few seconds rather than minutes, potentially enabling new investigations of dynamic vascular function in the brain.
Methods
Simulated signal dictionaries for vMRF were generated using the MRVox toolkit in MATLAB.6 Complex signal time courses were generated for all combinations of CBV (0-25%), R (2-25 μm), and SO2 (0-100%) containing 40 values each, resulting in dictionaries with 64,000 entries. Sequence parameters identical to the GESFIDE and SAGE sequences were used to create a separate dictionary for each sequence. Matching was performed by finding the simulated complex signal that resulted in the highest inner product with each voxels’ complex signal evolution, except in one comparison when coefficient-of-determination (R2) metric was used to demonstrate difference between magnitude-only and complex-valued matching (Figure 1B). In addition, all images underwent phase unwrapping and background removal7,8 prior to fingerprint matching.One mechanism by which temporal resolution for mapping is increased by decreasing the number of echo times (TE) acquired. MRF utilizes the signal evolution across multiple TE, therefore, the tradeoff between mapping accuracy and TE train length was investigated through a retrospective subsampling of a GESFIDE dataset. Initial GESFIDE images containing 40 TE was subsampled to include just 20, 10, and 5 TE as shown in Figure 2A. The subsampled imaging datasets were then matched to equivalently subsampled GESFIDE dictionaries using vMRF to generate vascular maps.
With an increase in acquisition speed and temporal resolution there can be an associated concern of a decrease in signal-to-noise ratio (SNR). To examine whether the SNR achieved with the SAGE (5 TE, acq. time = 5.1s, voxel size = 2x2x5 mm3) sequence would be adequate for vMRF, one subject was imaged, and signal averaging was performed on 4, 16, and 64 consecutive repetitions of the sequence to achieve relative SNR (rSNR) of 2, 4, and 8 respectively prior to fingerprint matching. These higher rSNR images, in addition to a single image with no averaging, were matched to the SAGE dictionary to produce vascular maps.
A second subject underwent imaging with the SAGE sequence for 100 consecutive repetitions (~8.5 min). Each of these repetitions was individually matched to the SAGE dictionary to produce vascular maps that could be compared across time points in the duration of the imaging session.
Results
The simulated non-contrast magnitude and phase signal changes when altering CBV, R, or SO2 can be seen in Figure 1A. Representative maps obtained when using just the magnitude of the signal for matching (R2) show unphysiological results for CBV, compared to when using the complex signal (inner product) for matching (Figure 1B). When subsampling TE in the GESFIDE images (Figure 2A), CBV and R remain consistent, while SO2 appears visually to increase slightly in predicted parameters, although still in a physiologically feasible range (Figure 2B). For maps generated with signal-averaged images, there are minimal observable differences, and the matching metric remains consistently high for all rSNR levels (Figure 3). The three parameter maps also appear steady over the course of the 8.5 minutes imaging session (Figure 4).Discussion and Conclusion
Figure 1A illustrates the similar changes in signal magnitude shapes when increasing CBV or decreasing SO2. The phase evolution of those changes is quite different, however, and may represent why the maps in Figure 1B using this phase information may be able to better disentangle CBV and SO2. MRF has been shown to be quite robust to noise, but when considering dynamic MRF, the minimum SNR necessary to generate accurate maps is of critical importance. The results here indicate that a single repetition of SAGE produces similar maps to the higher rSNR images. This finding is relevant for dynamic mapping as one SAGE repetition only takes 5.1 seconds, whereas if the 4, 16, or 64 averages were necessary, each repetition would take ~20, 82, and 326 seconds respectively, vastly affecting temporal resolution.This study began investigating the feasibility of performing accelerated vMRF without contrast agents. Upon further validation this accelerated, contrast-free technique will allow us to investigate dynamic changes in functional vascular biomarkers of disease.
Acknowledgements
This study was supported by NIH R00-NS102884. The project described was supported by the National Center for Advancing Translational Sciences, National Institutes of Health, through grant number UL1 TR001860 and linked award TL1 TR001861.References
- Ma D, Gulani V, Seiberlich N, et al. Magnetic resonance fingerprinting. Nature. 2013;495(7440):187-192. doi:10.1038/nature11971
- Christen T, Pannetier NA, Ni WW, et al. MR vascular fingerprinting: A new approach to compute cerebral blood volume, mean vessel radius, and oxygenation maps in the human brain. Neuroimage. 2014;89:262-270. doi:10.1016/j.neuroimage.2013.11.052
- Lemasson B, Pannetier N, Coquery N, et al. MR Vascular Fingerprinting in Stroke and Brain Tumors Models. Sci Rep. 2016;6(1):37071. doi:10.1038/srep37071
- Schmiedeskamp H, Straka M, Newbould RD, et al. Combined spin- and gradient-echo perfusion-weighted imaging: Spin- and Gradient-Echo PWI. Magn Reson Med. 2012;68(1):30-40. doi:10.1002/mrm.23195
- Manhard MK, Bilgic B, Liao C, et al. Accelerated whole‐brain perfusion imaging using a simultaneous multislice spin‐echo and gradient‐echo sequence with joint virtual coil reconstruction. Magn Reson Med. Published online May 8, 2019:mrm.27784. doi:10.1002/mrm.27784
- Pannetier NA, Debacker CS, Mauconduit F, Christen T, Barbier EL. A Simulation Tool for Dynamic Contrast Enhanced MRI. PLoS ONE. 2013;8(3):e57636. doi:10.1371/journal.pone.0057636
- Zhou D, Liu T, Spincemaille P, Wang Y. Background field removal by solving the Laplacian boundary value problem: Background Field Removal By Solving Laplacian Boundary Value Problem. NMR Biomed. 2014;27(3):312-319. doi:10.1002/nbm.3064
- Li W, Wu B, Liu C. Quantitative susceptibility mapping of human brain reflects spatial variation in tissue composition. NeuroImage. 2011;55(4):1645-1656. doi:10.1016/j.neuroimage.2010.11.088
Figures
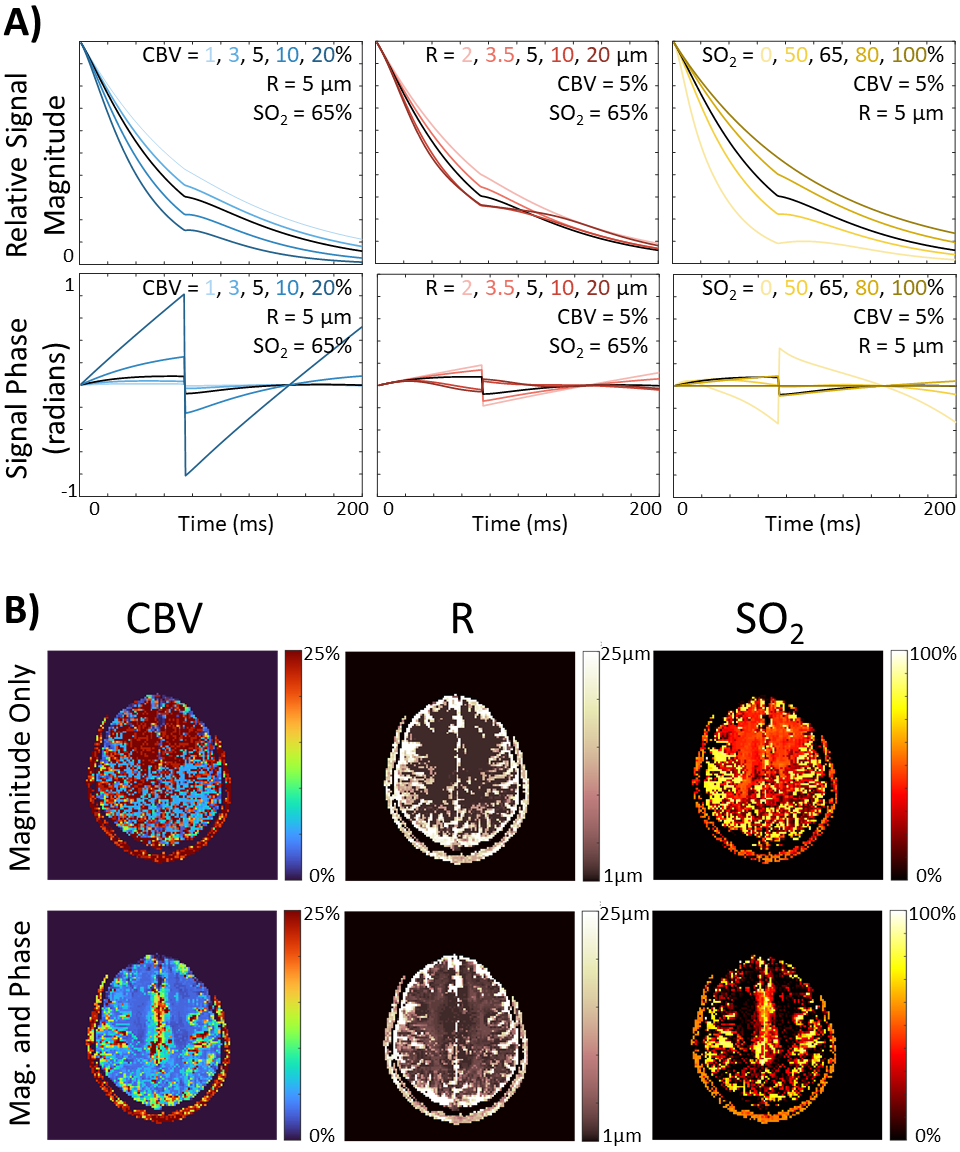
Figure 1. A) Vascular magnetic resonance
fingerprinting (MRF) signal magnitude and phase simulations demonstrating the
change in signal evolution when a single parameter is changed. B) Cerebral
blood volume (CBV), vessel radius (R), and tissue oxygen saturation (SO2)
maps reconstructed when performing fingerprint matching using only the
magnitude of the signals (R2) or when using both phase and magnitude
information (inner product).
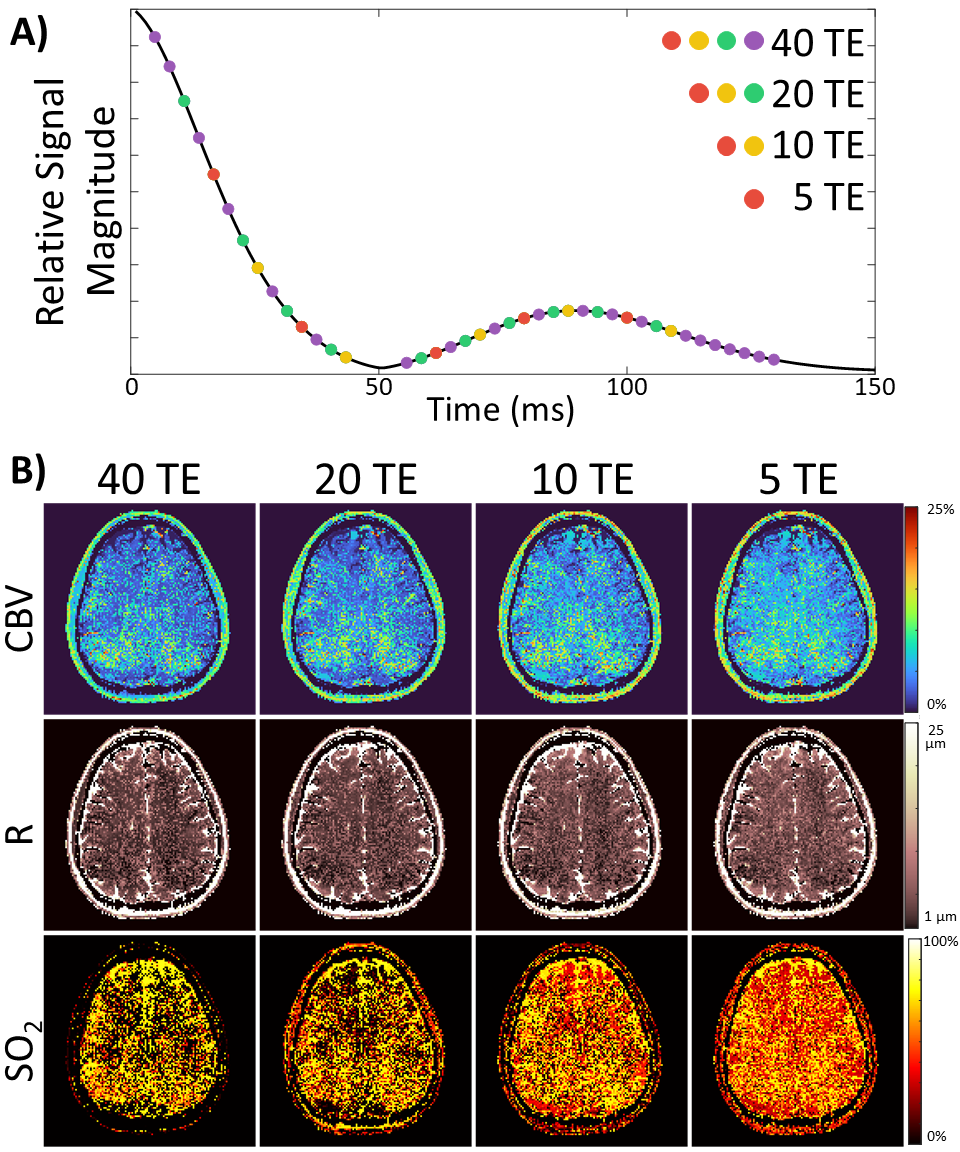
Figure 2. A) Gradient echo sampling of
free induction decay and echo (GESFIDE) images with 40 TE were subsampled to
create images with 20, 10, and 5 TE respectively. B) These subsampled
images then underwent vascular MRF matching to generate the cerebral blood
volume (CBV), vessel radius (R), and tissue oxygen saturation (SO2) maps
shown.
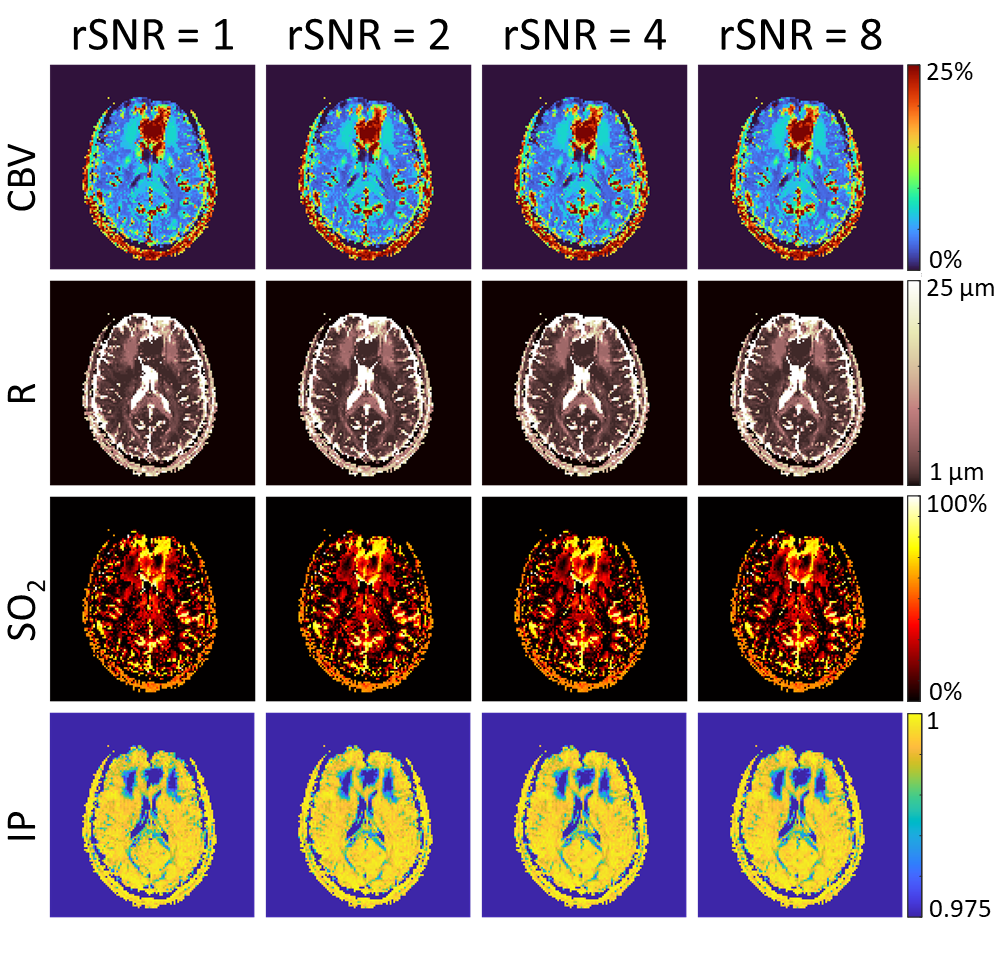
Figure 3. Images were consecutively acquired with
the spin and gradient echo (SAGE) sequence for 64 repetitions. The first 4, 16,
and 64 images were signal averaged to produce relative SNR (rSNR) images of 2,
4, and 8 respectively. The SAGE images with different levels of signal
averaging then underwent vMRF matching to produce the cerebral blood volume
(CBV), vessel radius (R), and tissue oxygen saturation (SO2) shown.
The inner product (IP) maps indicate the value of the matching metric for each
voxel and show similar matching confidence in all rSNR levels.
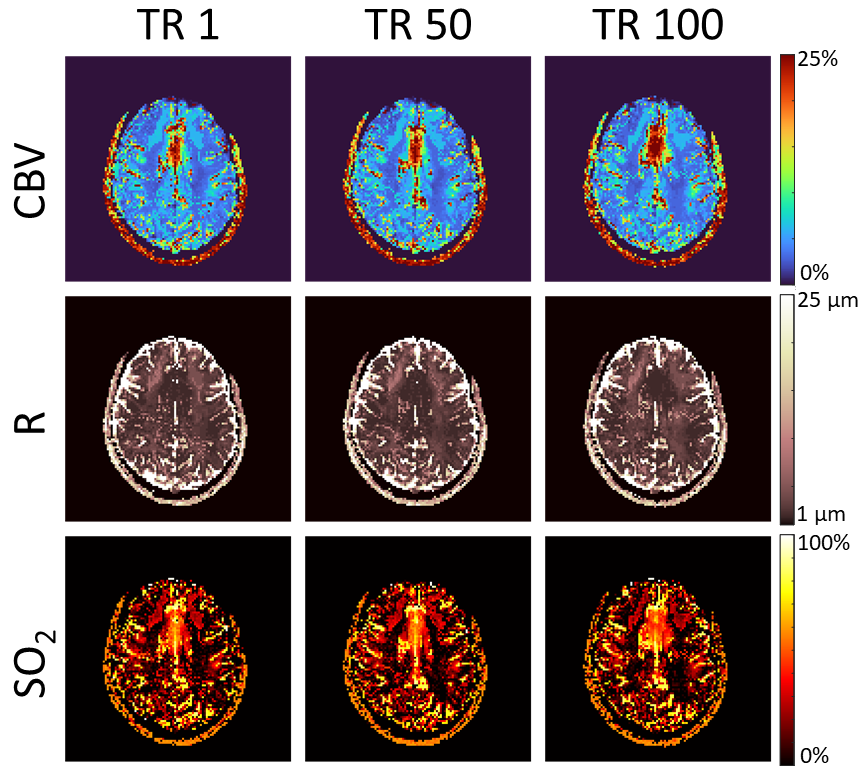
Figure 4. Images were continuously acquired with
the SAGE sequence for 100 repetitions times (TR). The cerebral blood volume
(CBV), vessel radius (R), and tissue oxygen saturation (SO2) are
shown for the 1st, 50th, and 100th TR to
demonstrate the consistency of the maps produced over time.
DOI: https://doi.org/10.58530/2022/2597