2595
Dictionary variance based optimization of MR Fingerprinting1Radiology, Case Western Reserve University, Cleveland, OH, United States, 2Biomedical Engineering, Case Western Reserve University, Cleveland, OH, United States
Synopsis
This study presents an optimization tool to investigate and validate the effects of MR sequence modules on MR Fingerprinting. Dictionary variance across the tissue property dimension can predict the outcome of a given change in an MRF sequence. An MRF sequence variant is optimized by varying three typical MRF sequence blocks of FA pattern, RF phase and inversion pulses. The observations from the dictionary variance align with in vivo data results.
Introduction
The MRF framework (1) is flexible and can be designed to be most sensitive to certain tissue properties or ranges of properties. There are MR acquisition blocks that help with encoding of different properties. For example, inversion pulses help with T1 sensitivity whereas large flip angles increase T2 encoding power. Even though the effect of single MR sequence modules are intuitively understood, MRF-like combinations quickly become non-intuitive. An optimization tool is necessary for investigation and validation, yet simple cost functions fail to deliver the desired performance. Here we propose that the variance across the tissue properties through time can be an effective design criterion to gauge and check the intended purpose of typical MRF building blocks.We manually optimized an MRF sequence variant, quadratic RF MRF (qRF-MRF) that maps T1, T2, T2* and off-resonance simultaneously (2,3), by investigating the effect of various sequence blocks on dictionary variance. qRF-MRF sequence encodes off-resonance by varying RF phases with a quadratic function which results in a linear change of on-resonance frequency through time. The linewidth around the center frequency (Γ) denotes (1/(pi*T2’)) and ties T2 and T2* together. qRF-MRF is a good candidate for optimization validation since there are 4 properties to optimize with various sequence modules.
Methods
Dictionary variance is calculated for each tissue dimension separately in the following way. For a given property, e.g. T1, other dictionary dimensions (T2, T2* and off-resonance) are looped over and the variance across different T1 entries is calculated at each iteration. The mean over the whole loop returns the mean T1 variance of the sequence for all the time points. The dictionary variance is informative about the encoding capability of an MRF sequence to a tissue property. Increased variance is due to the increased distance between dictionary entries, thus more separability and also stability to random and structured noise (due to undersampling). The effect of a module should be considered on all the tissue properties of interests since increased sensitivity for a property might be reducing encoding capability of another property.This study was performed on a 3T Siemens Vida scanner (Siemens Healthineers) and all volunteers gave written consent prior to the scans. From a 2D abdomen qRF-MRF sequence various sequence building blocks are changed to improve sensitivity to different parameters. All the sequences have the same following acquisition parameters (FOV 400x400, matrix size 256x256, TR=8.1ms, slice thickness 5mm, initial inversion pulse at the start of the sequence). The following sequence blocks were varied in a controlled manner: peak FA amplitude, frequency sweep rate with the quadratic RF function, and the interval between consecutive inversion pulses. Their effects were investigated with dictionary variance simulations and validated with in vivo data.
Results and Discussion
Peak FA amplitudeFigure 1 illustrates two sequences with different FA patterns. The dictionary variance in a) suggests similar T1 encoding power but competing effects on T2 and T2*. Sequence A with high FAs is predicted to favor T2 while suppressing T2* encoding. It is validated with in vivo results in Figure 1b where one can see the improved T2 accuracy with less artifacts for sequence A but albeit with suboptimal T2* maps compared to sequence B with low FA.
Frequency sweep rate
Three sequences with an optimized FA pattern to encode both T2 and T2* are compared in Figure 2. The sequences have different sweep rates for linear change of the on-resonance frequency over time. Sequences A and C have fixed 0.35 Hz and 0.7 Hz update per time points. Sequence B has a cubic RF phase function, a quadratic off-resonance change and a linear oscillation of the on-resonance frequency update between 0 and 1.4 Hz. In vivo differences are minimal between the sequences as suggested by the dictionary variance. It may be argued that liver T1 is more homogeneous for sequence B following the minimally higher T1 sensitivity in Figure 2a.
Inversion interval
This comparison shows the effect of additional inversion pulses throughout the sequences in Figure 3 and 4. Two sequences with inversion pulses every 586 and 400 time points are compared in Figure 3. More frequent inversion pulses increase T1 sensitivity throughout the sequence but also have a negative impact on T2 (yellow highlights). The in vivo results are in line with the simulation showing improved T1 and reduced artifacts. However, T2 maps deteriorate with inaccurate mapping of fluid in the portal vein (see arrows) for sequence B.
In Figure 4, two sequences with inversion pulses every 586 (sequence A) and 293 (sequence B) time points are compared. When the inversion pulses are applied at the low T2 sensitivity points, they increase T1 sensitivity without or with minimal impact on T2. In vivo results in Figure 4b show the accurate mapping of T1 for fluids around the veins for sequence B. The higher T2* sensitivity also translates to improved T2* maps for sequence B in the same regions.
Conclusion
Dictionary variance through the tissue property dimension is an effective way of simulating intended modifications and optimizing MRF sequences. The effect of three MRF sequence blocks were investigated with dictionary variance and the observations were validated with in vivo data.Acknowledgements
No acknowledgement found.References
1. Ma D, Gulani V, Seiberlich N, et al. Magnetic resonance fingerprinting. Nature 2013;495: 187–192.
2. Wang C, Coppo S, Mehta B, et al. Magnetic resonance fingerprinting with quadratic RF phase for measurement of T2* simultaneously with δf ,T1, and T2. Magn Reson Med. 2019; 81(3):1849-1862.
3. Boyacioglu, R, Wang, C, Ma, D, et al. 3D magnetic resonance fingerprinting with quadratic RF phase. Magn Reson Med. 2021; 85: 2084-2094.
Figures
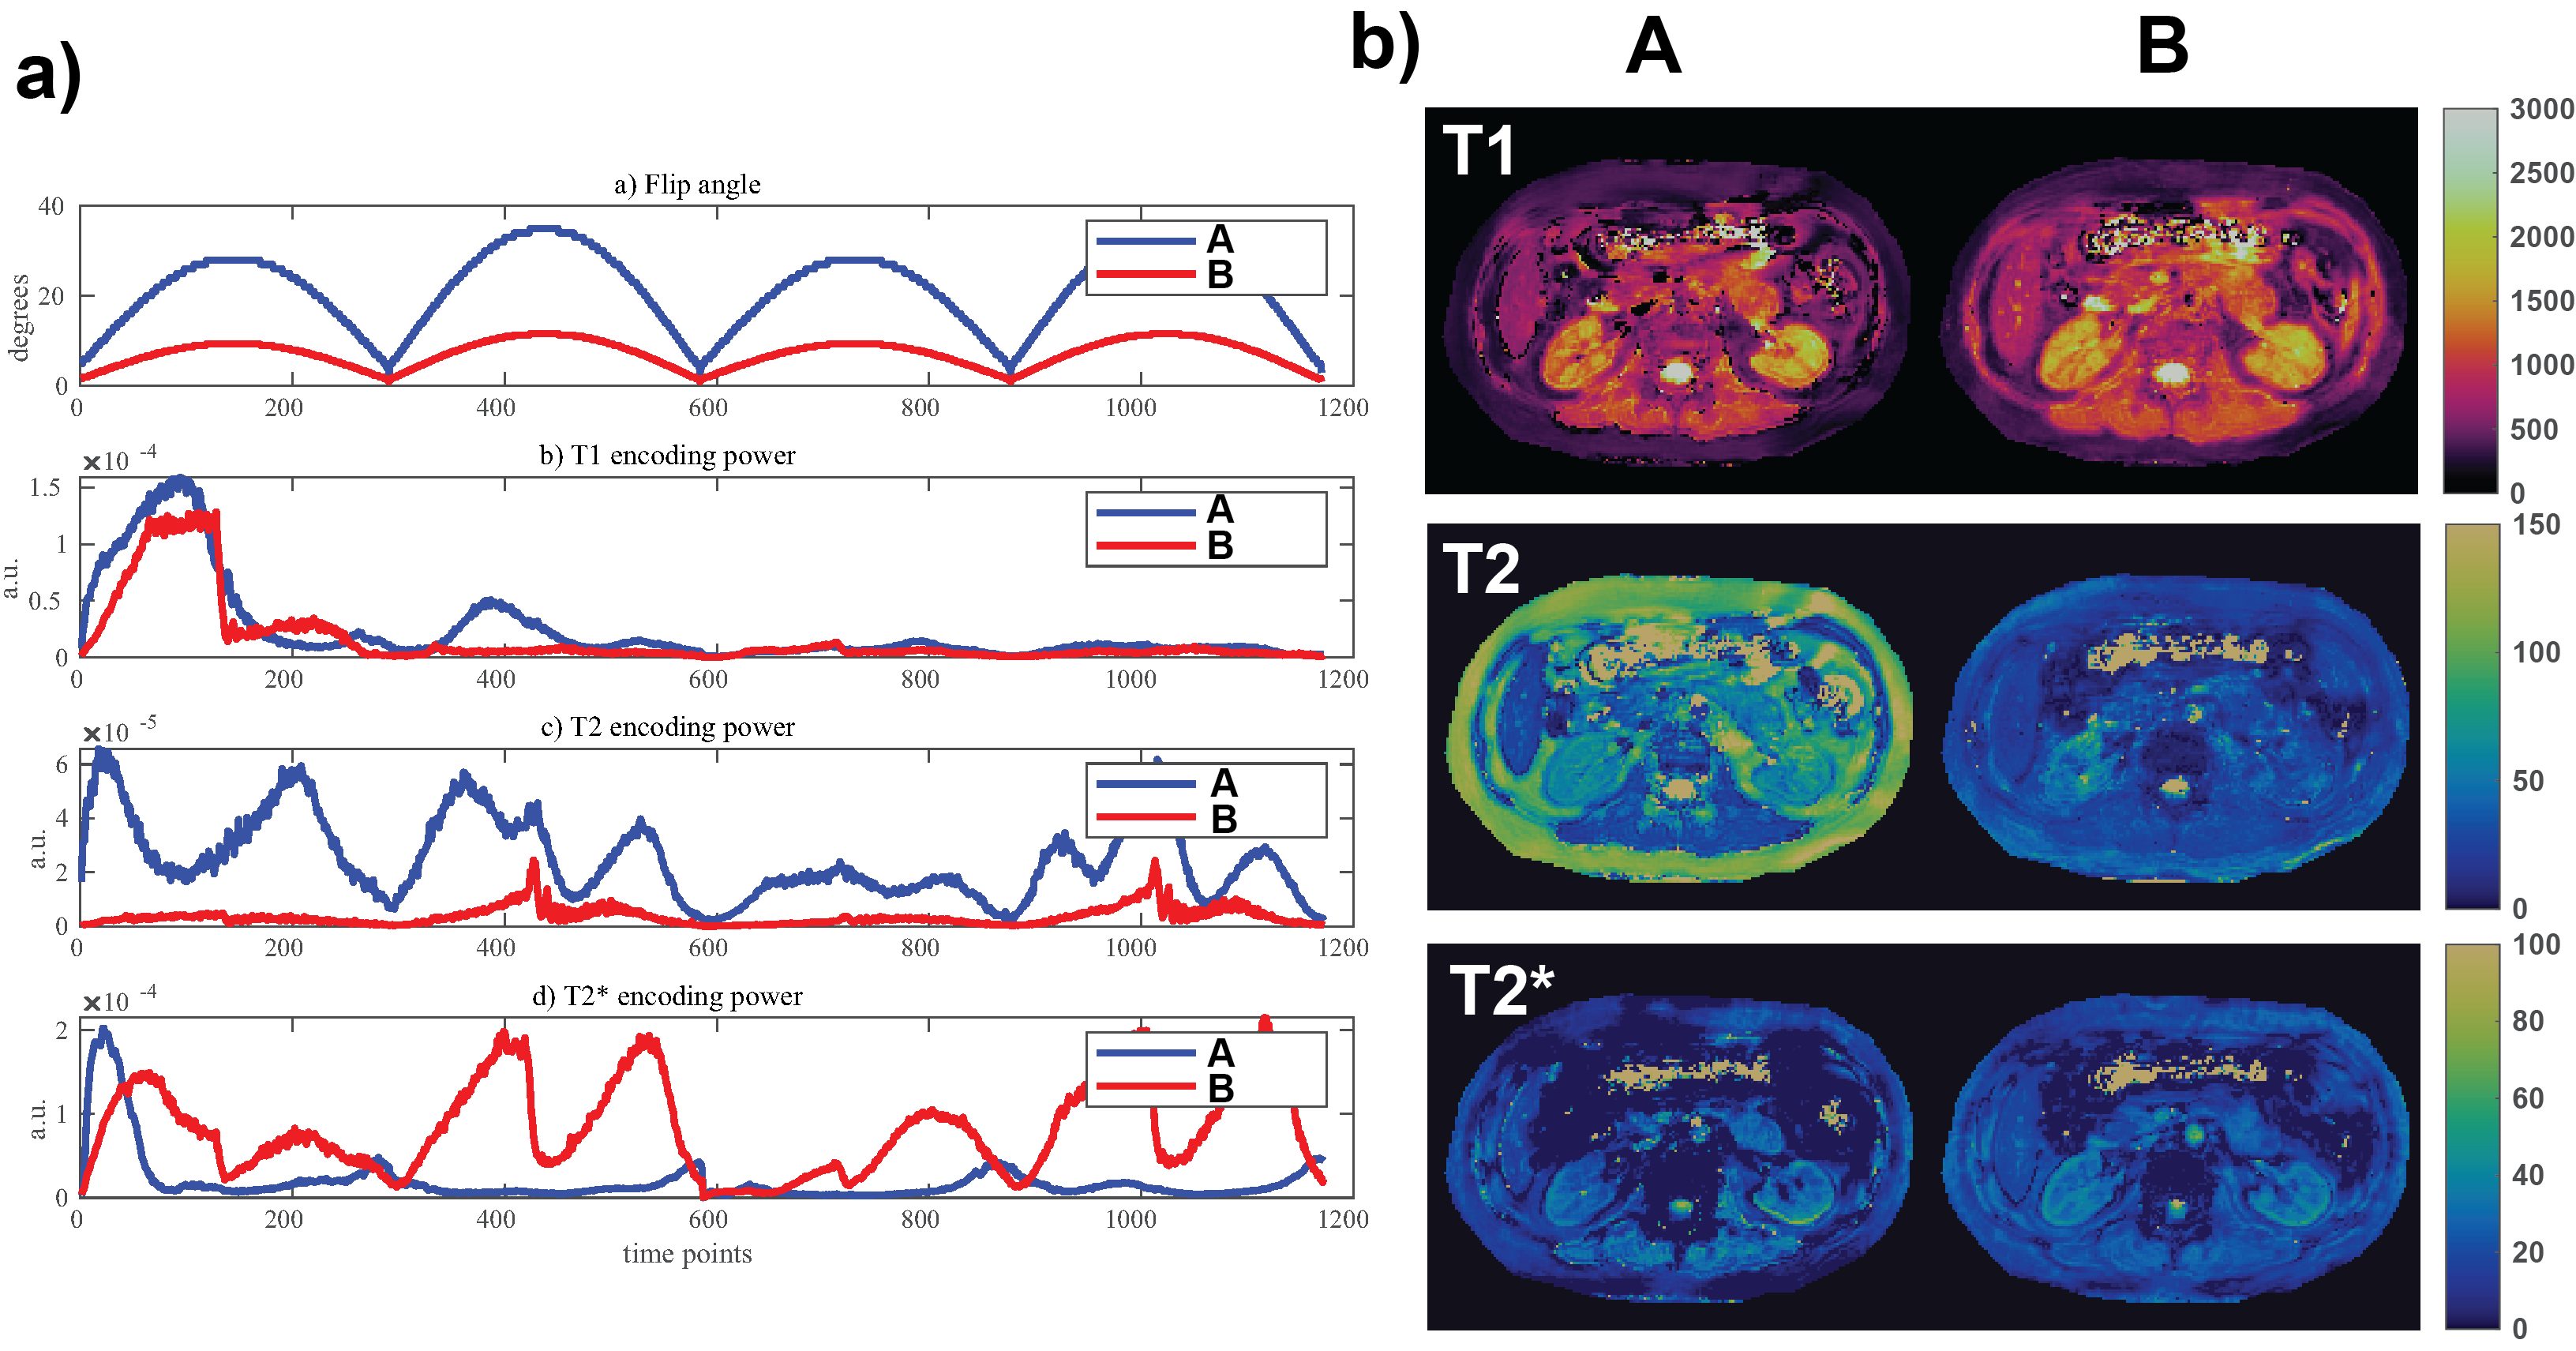
Figure 1. Two sequences with 1172 time points and different FA patterns are compared: a) FA patterns and encoding capability for T1, T2 and T2* are plotted in separate rows, b) in vivo data acquired with the two sequences. Sequence A has flip angles three times the amplitude of sequence B throughout the whole time series. It can be noted that T1 is not effected much as predicted by similar encoding. High flip angles are necessary for T2 encoding whereas low flip angles are more effective for T2* encoding. It is clear that an optimal sequence should have both low and high FA sections.
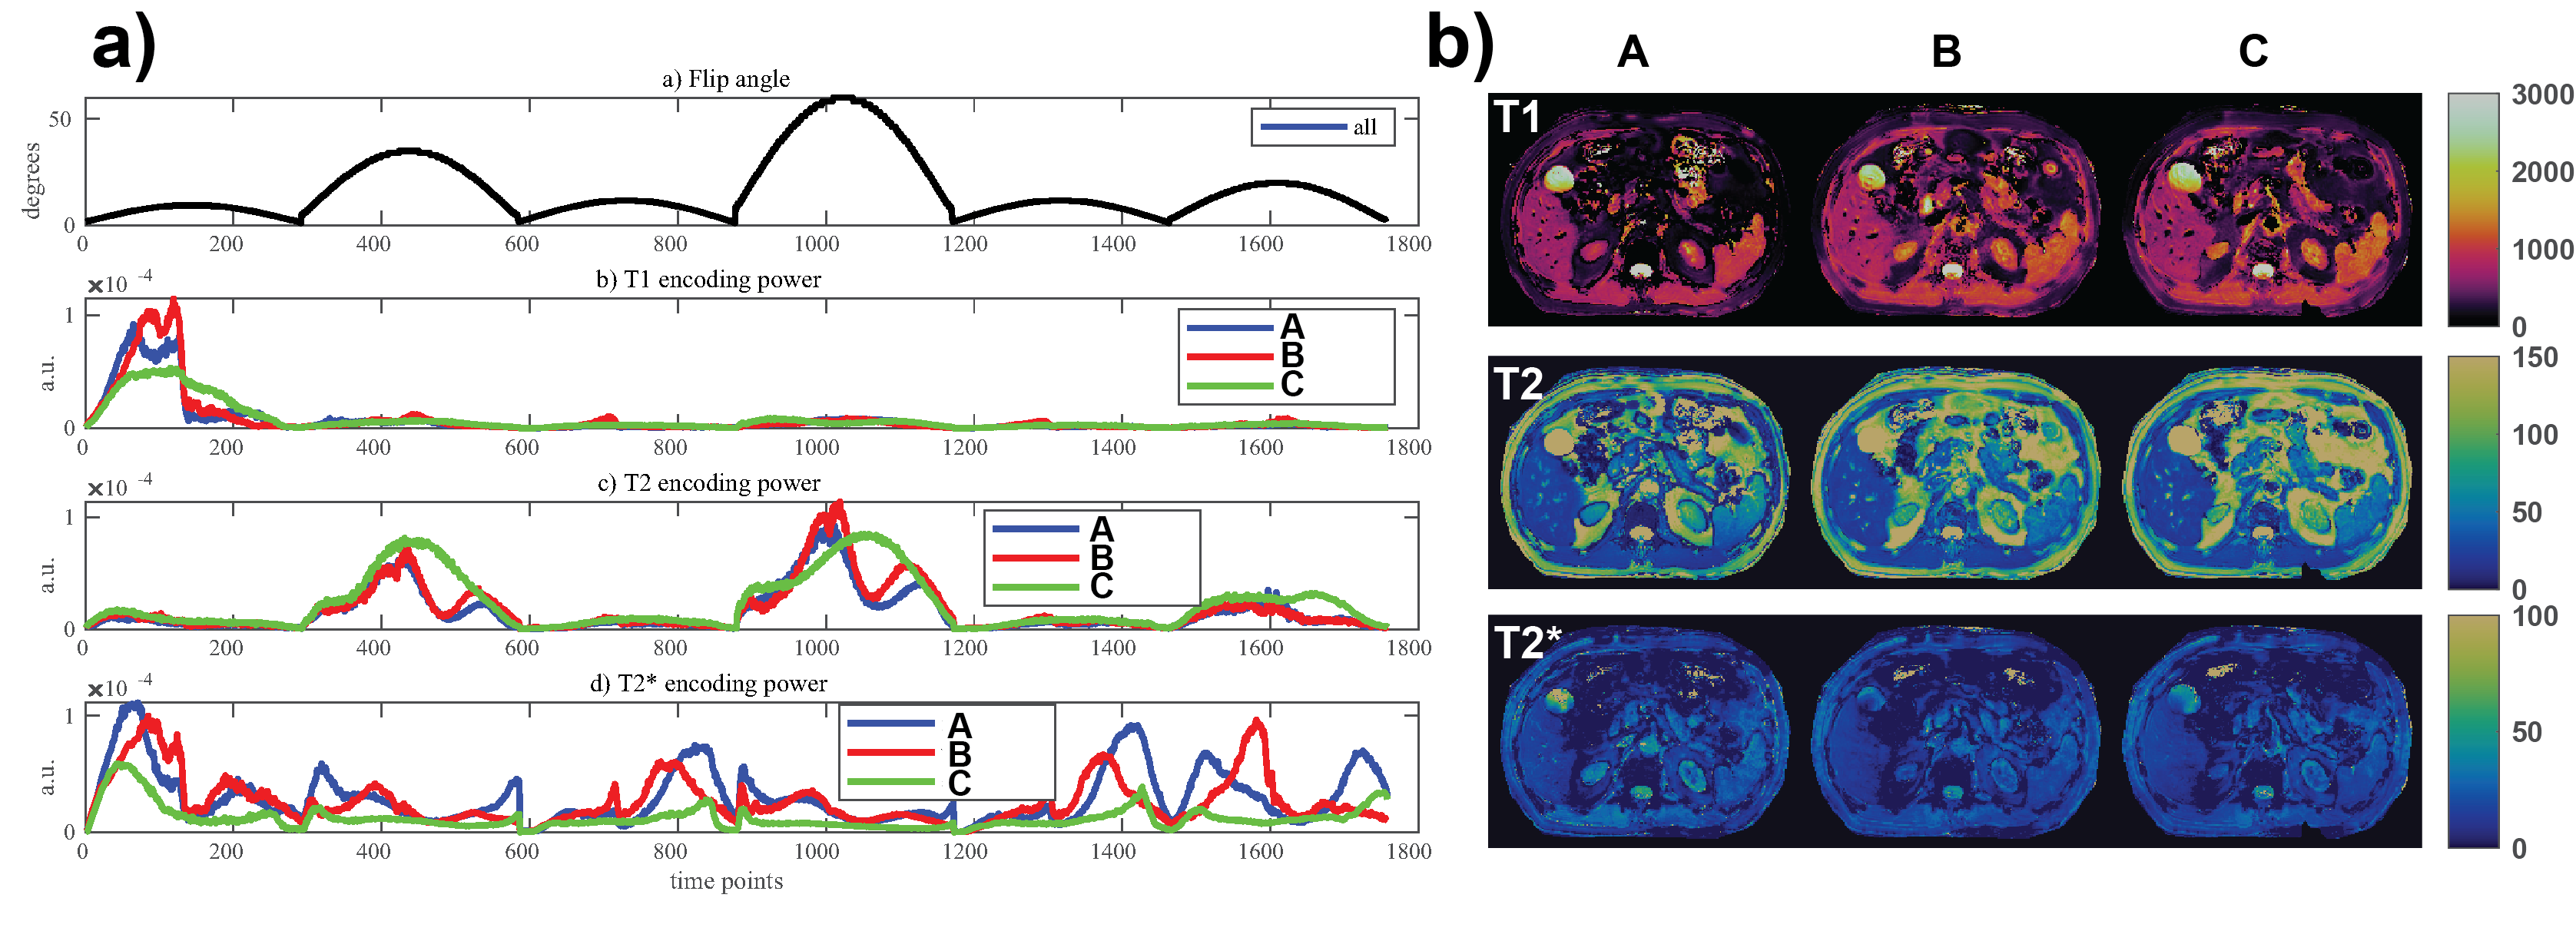
Figure 2. Three sequences with 1758 time points and different sweep rates are compared: a) FA patterns and encoding capability, b) in vivo data. Sequence A has a slower sweep with fixed 0.35 Hz update, sequence B has variable sweep rate (0 to 1.4 Hz) and sequence C has the faster fixed sweep rate of 0.7 Hz. Sequence B was designed to perform as a bSSFP sequence without a frequency update around the inversion pulses (every 586 time points) for a more homogeneous inversion effect with minimal dephasing. The rate has minimal effect according to the simulation and in vivo data.
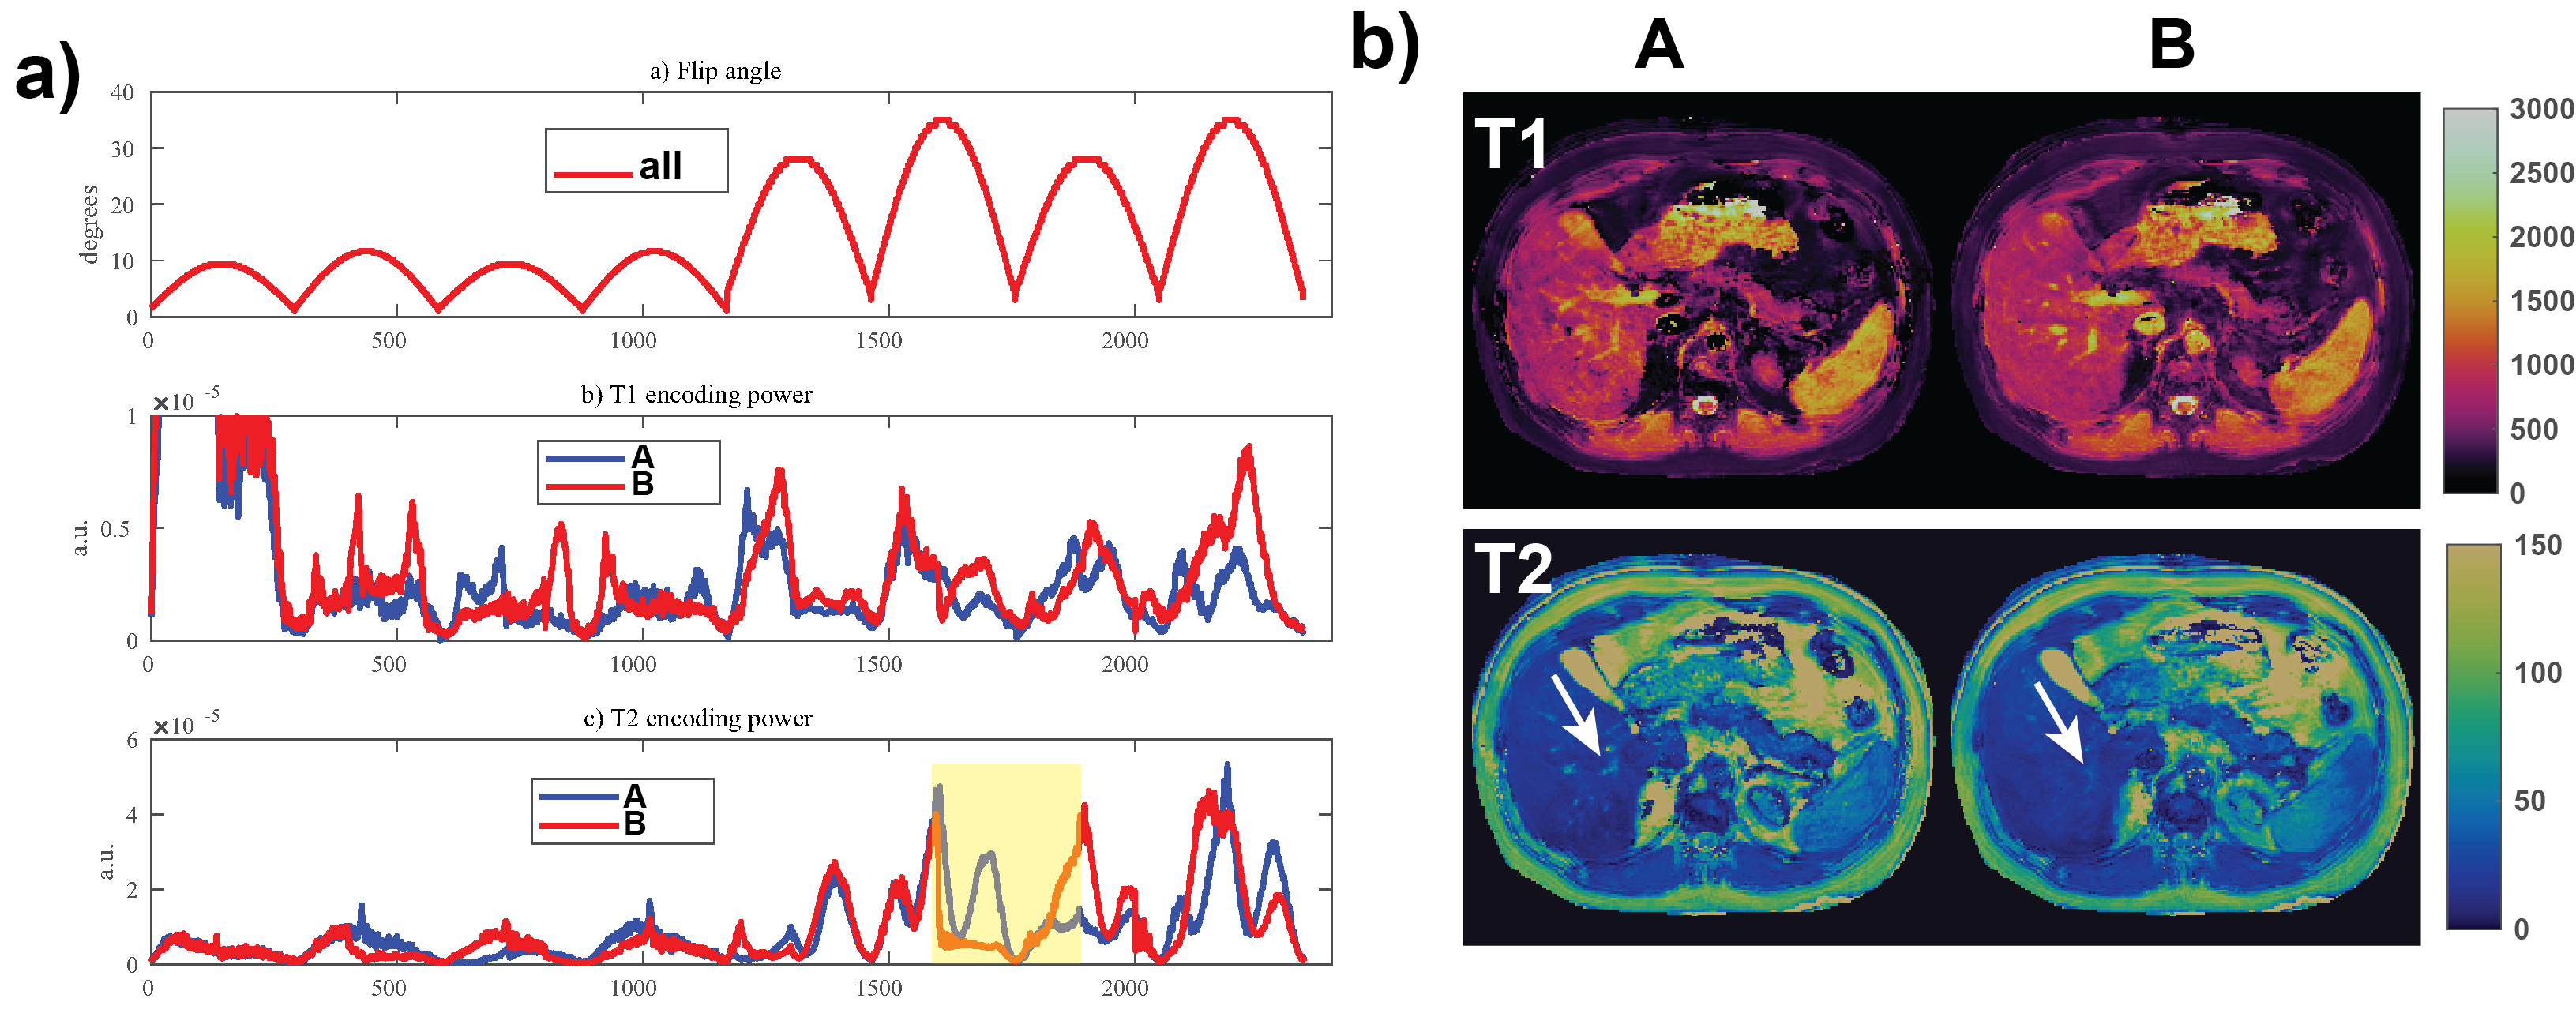
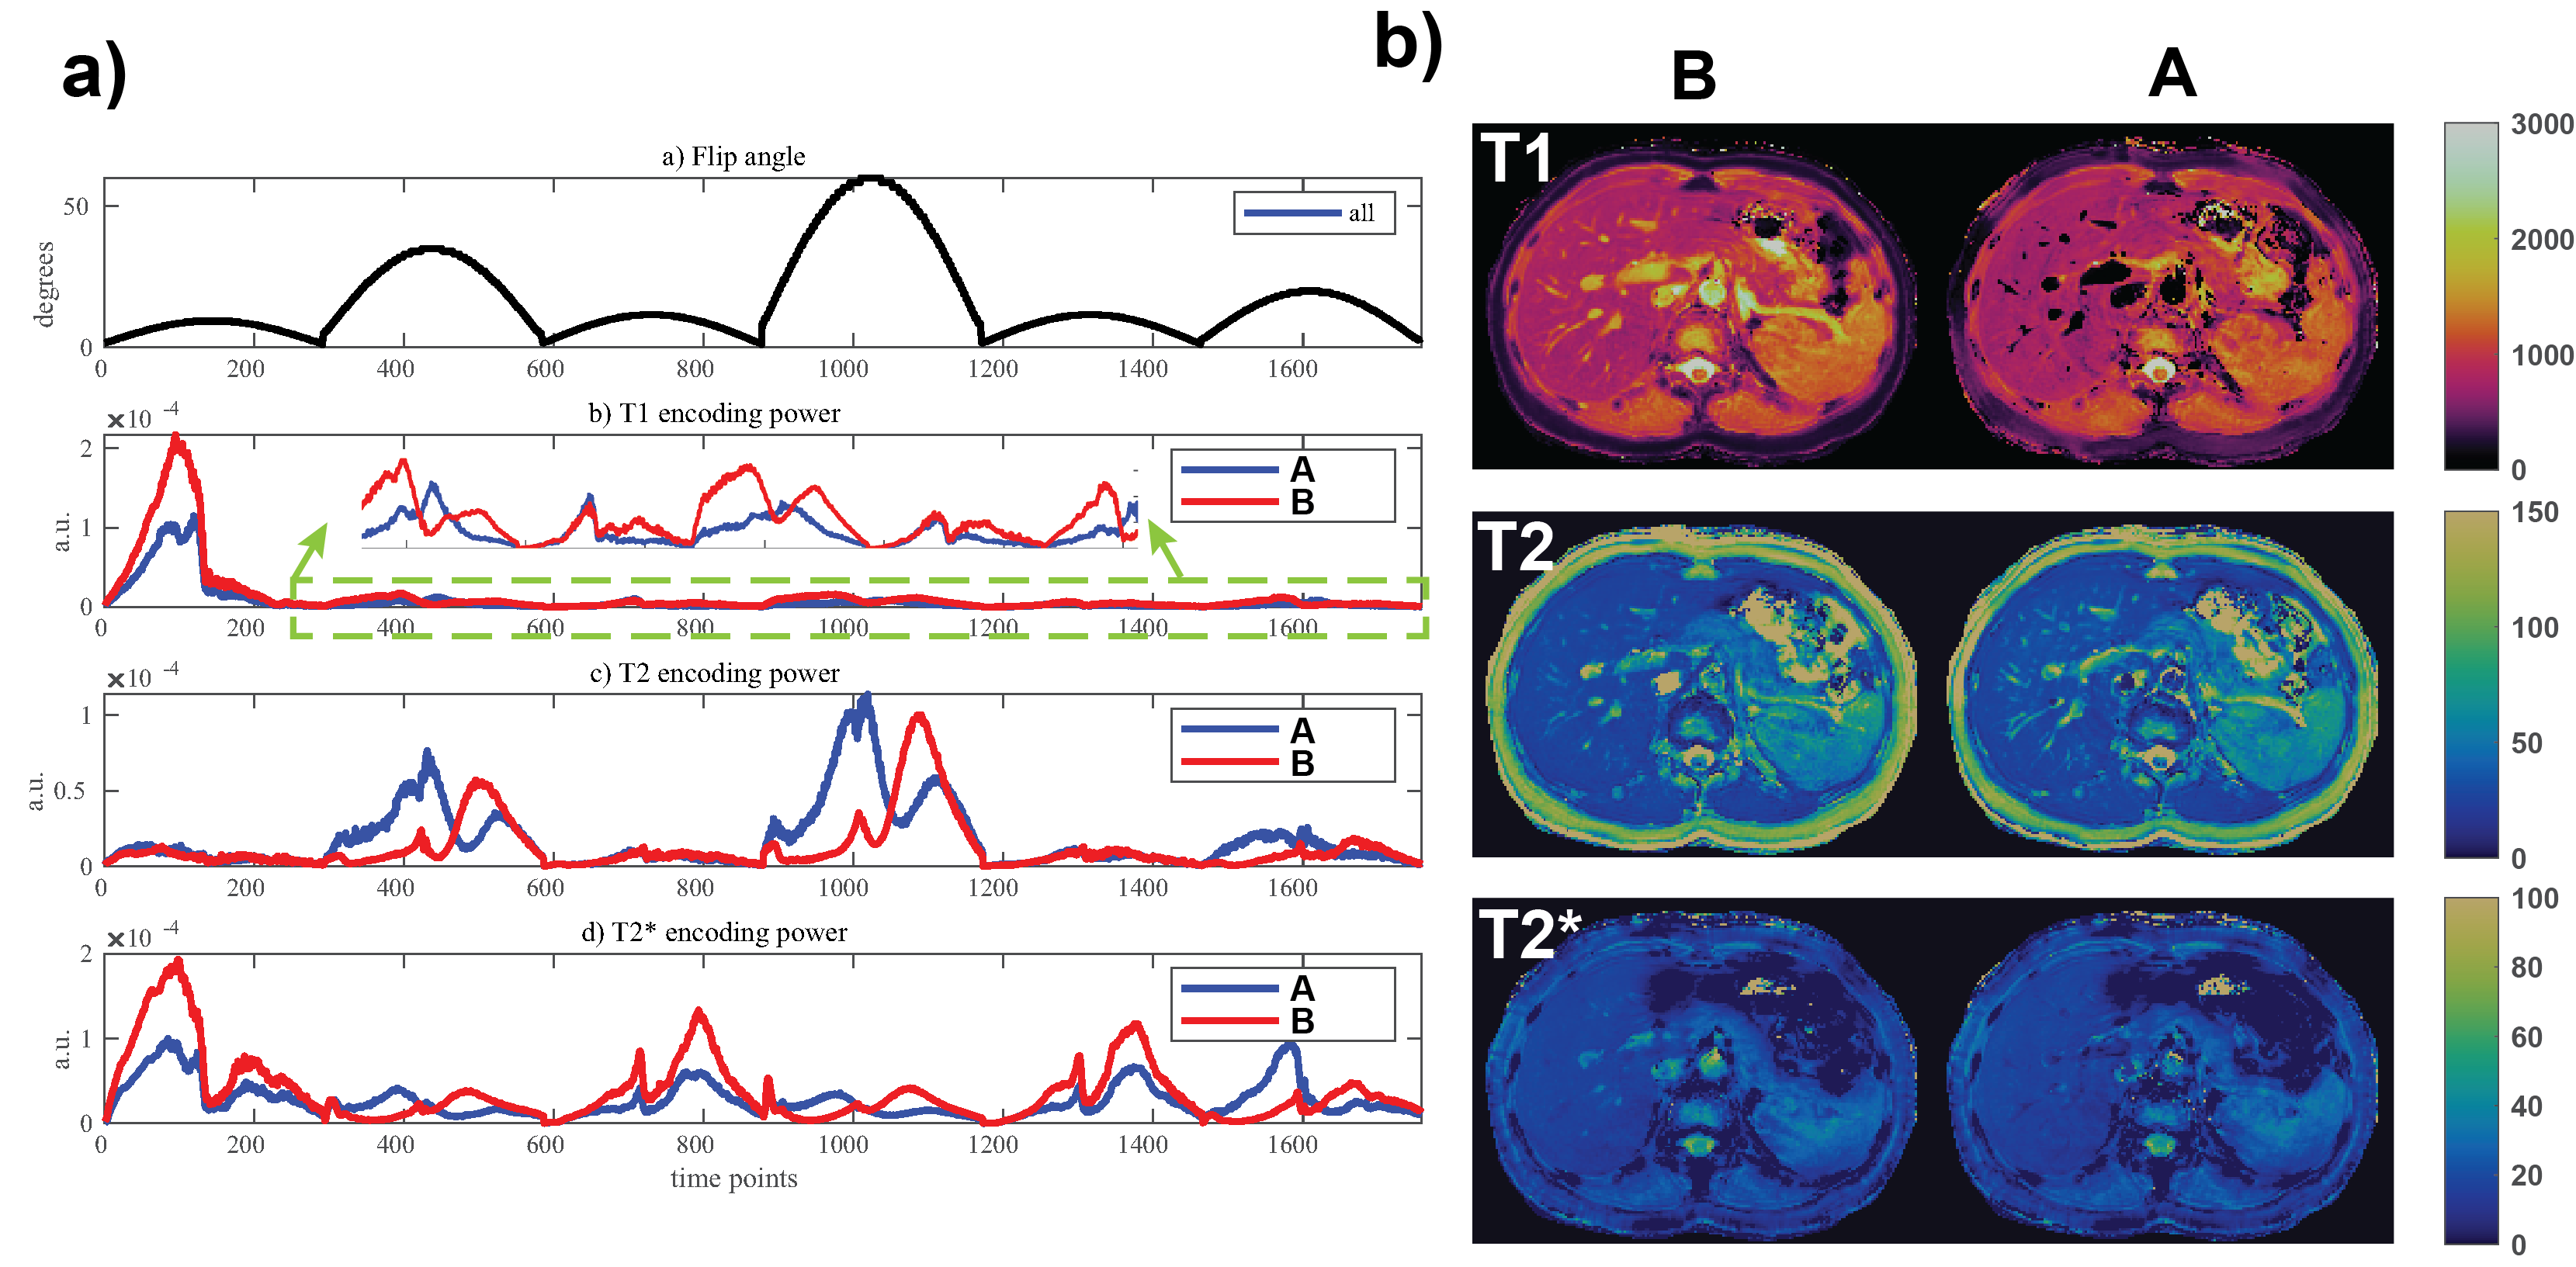
Figure 4. Two sequences with 1758 time points and different intervals for inversion pulses are compared: a) FA patterns and encoding capability, b) in vivo data. For sequence A and B, inversion pulses are applied every 586 (two lobes) and 293 (one lobe) time points, respectively. More frequent inversion pulses, applied at the zero FA crossings, do not affect T2 (except a shift in time) but have a major impact on T1 and T2*. The zoomed (in green dashed) portions show consistently higher T1 sensitivity for sequence B. Note the accurate mapping of T1 and T2* around the veins for sequence B.