2594
Incorporating saturation bands into MR Fingerprinting reduces streaking artefacts1Department of Circulation and Medical Imaging, Norwegian University of Science and Technology, Trondheim, Norway, 2Department of Radiology and Nuclear Medicine, St. Olavs Hospital, Trondheim, Norway, 3Centre for Advanced Imaging, University of Queensland, Brisbane, Australia
Synopsis
Magnetic Resonance Fingerprinting (MRF) enables fast quantitative MR imaging, which is appealing in prostate cancer diagnostics. In pelvic MR Fingerprinting, blood flow in the femoral vessels causes strong streak-like artefacts when a radial sampling strategy is used. Here we develop a strategy to incorporate saturation bands into MRF sequences. Our phantom study shows quantification of areas outside the saturation band are not significantly affected. Meanwhile, qualitative analysis of in vivo experiments indicates a marked reduction in streak intensity when saturation is applied.
Introduction
Magnetic Resonance Fingerprinting (MRF) produces quantified parameter maps in a short acquisition time 1. Both the speed and quantized aspects of MRF make it highly appealing to prostate cancer diagnosis and staging. Currently, prostate cancer diagnosis is made using multi-parametric MRI (mpMRI), including T2-weighted (T2w) and Diffusion Weighted Imaging (DWI) and Dynamic Contract Enhanced (DCE) imaging. Studies have shown that transition zone lesion characterisation is improved with MRF based relaxometry, in combination with apparent diffusion coefficient (ADC) mapping 2. MRF therefore has the potential to improve diagnostic accuracy by providing repeatable, reliable quantification of prostate tissue in a single rapid acquisition.With the ultimate aim of clinical utility and improved diagnostic power to prostate cancer patients, we investigate the current challenges with MRF in prostate imaging. Streaking artefacts caused by femoral vessel blood flow limit the clinical utility of radially sampled MRF in prostate cancer imaging in two ways. Firstly, these distortions could conceal important anatomical and pathological detail and secondly, quantitative mapping (T1, T2) of the organ becomes less reliable.
This work reports an approach to mitigate femoral flow streaking artefacts in MRF. We modified a radial MRF sequence2 to include saturation bands to mitigate the signal contribution from the femoral vessels.
Methods
Pulse Sequence modification.
The MRF technique as described in Cloos et al.3 was modified to include saturation bands. Regional saturation (RSAT) modules were programmed to occur at the start of each FISP/FLASH segment (Fig 1A). In this version of the sequence, the saturation did not change the timing of any other pulses and so the same dictionary could be used for reconstruction. A second version of the modified sequence was made to include ten saturation pulses per segment surrounded by balanced spoiler gradients (Fig 1B). The modified sequences were installed onto a Siemens Magnetom Skyra 3T MRI scanner at St. Olavs hospital, Trondheim University Hospital, Norway. Dictionary matching and image reconstruction was done using MATLAB R2020b (MathWorks, Natick, NA, USA) as described in Cloos et al 3.Phantom Study
A multicompartment phantom (Fig 2), based on the design in 4, was made using ten 55ml cylinders each containing a different concentration of Manganese(II) Chloride, creating a range of T1 (428 - 1891 ms) and T2 (30 - 283 ms) values. The phantom was scanned using a 32-channel head coil, with foam padding inserted for stability. The MRF scan was repeated twice, with and without the single pulse saturation band (Fig 1A). Image resolution was 208x208, field of view 240x240mm, slice thickness of 5mm and number of shots was 4. Two slices were acquired with a slice gap of 400% to reduce cross-talk. A saturation band was placed orthogonal on the slice, entirely covering two cylinders and partially obscuring two others. The acquisition time was 1 minute 12 seconds.Volunteer Study
Two asymptomatic volunteers were scanned using both the unmodified MRF sequence and the sequence with the single pulse saturation band (Fig 1A). Each sequence was repeated for 2, 4 and 6 shots with resolution balanced to achieve approximately equivalent SNR (160x160 res., 208x208 res., 240x240 res., respectively). The prostate was imaged with 8 transversal slices, with 50% slice gap. A peripheral vessel scout scan, typically used in MR angiography, was performed to guide the positioning of the saturation band – aiming to cover as much of the femoral blood vessels and lower iliac arteries as possible. One additional volunteer was scanned using the unmodified MRF and the ten saturation pulses per segment version (Fig 1B) using the same acquisition parameters.The Regional Committee for Medical and Health Research Ethics (REC Central Norway) approved the study, and all volunteers signed informed consents prior to recruitment (REC identifier #218665).
Results and Discussion
This report utilizes a qualitative analysis as an initial approach to assess streak artefacts in prostate imaging. An existing MR Fingerprinting sequence was adapted to include regional saturation bands. The phantom experiment showed that saturation can be incorporated into the MRF sequence without effecting quantification of unsaturated areas. (Figs. 2 and 3)
However, signal was not fully suppressed when imaging with one saturation pulse per segment. The MRF dictionary matching algorithm was still able to produce accurate T2 maps despite the saturation (Fig 2).
In vivo, blood flow tends be the dominant source of streaking. The streaking was most apparent in 2 shot MRF (Fig 4). Qualitative analysis of volunteer scans indicates a significant reduction in streak intensity when saturation is applied.
Initial investigation of the further sequence modification outlined in Fig 1B showed a significant improvement in saturation effectiveness (Fig 5B). Although, these results are preliminary and quantitative comparison cannot yet be made. Placement of the saturation band was focused upon blood vessels above the image slice, thus reducing signal contribution from the arteries. However, the brightness of the femoral veins suggests that additional saturation bands would be required to further reduce streaking artefacts.
Conclusion
Saturation of signal from the femoral arteries and veins shows promise for reducing flow-related streaking artefacts in MRF of the prostate. Sequence optimization and quantification of artefact reduction is subject of further work.Acknowledgements
C.G.T would like to thank Frank Zijlstra at St Olavs hospital for support with Siemens Idea.Net platform.References
1. Ma D, Gulani V, Seiberlich N, Liu K, Sunshine JL, Duerk JL, et al. Magnetic resonance fingerprinting. Nature. 2013 Mar 1;495(7440):187–92.
2. Panda A, Obmann VC, Lo W-C, Margevicius S, Jiang Y, Schluchter M, et al. MR Fingerprinting and ADC Mapping for Characterization of Lesions in the Transition Zone of the Prostate Gland. Radiology. 2019;292(3):685–94.
3. Cloos MA, Assländer J, Abbas B, Fishbaugh J, Babb JS, Gerig G, et al. Rapid Radial T1 and T2 Mapping of the Hip Articular Cartilage With Magnetic Resonance Fingerprinting. Journal of Magnetic Resonance Imaging. 2019;50(3):810–5.
4. Cloos MA, Knoll F, Zhao T, Block KT, Bruno M, Wiggins GC, et al. Multiparametric imaging with heterogeneous radiofrequency fields. Nature Communications. 2016 Aug 16;7(1):12445.
Figures
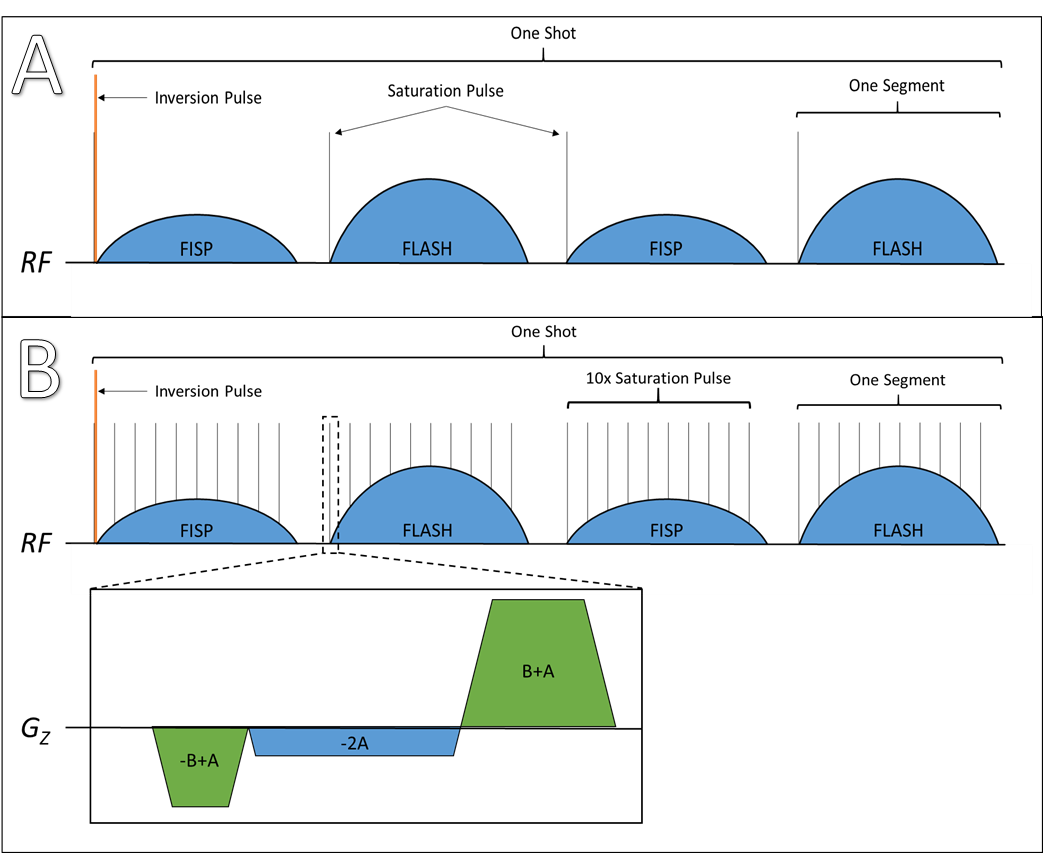
Figure 1 – A) Pulse sequence diagram of the modified MRF sequence, a single saturation pulse is played before each FISP/FLASH segment and before the inversion pulse at the start of each shot. B) Ten equally spaced saturation pulses played for each segment. Balanced spoiler gradients were also implemented in this version of the sequence. The sequences were modified using Siemens (Erlangen, Germany) IDEA.net platform
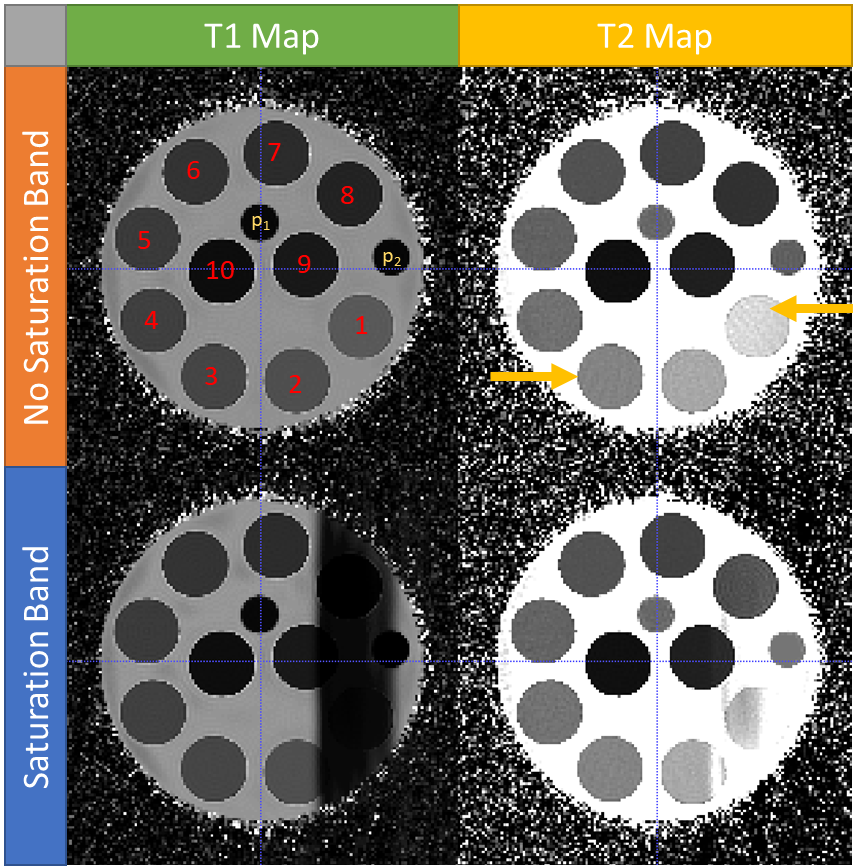
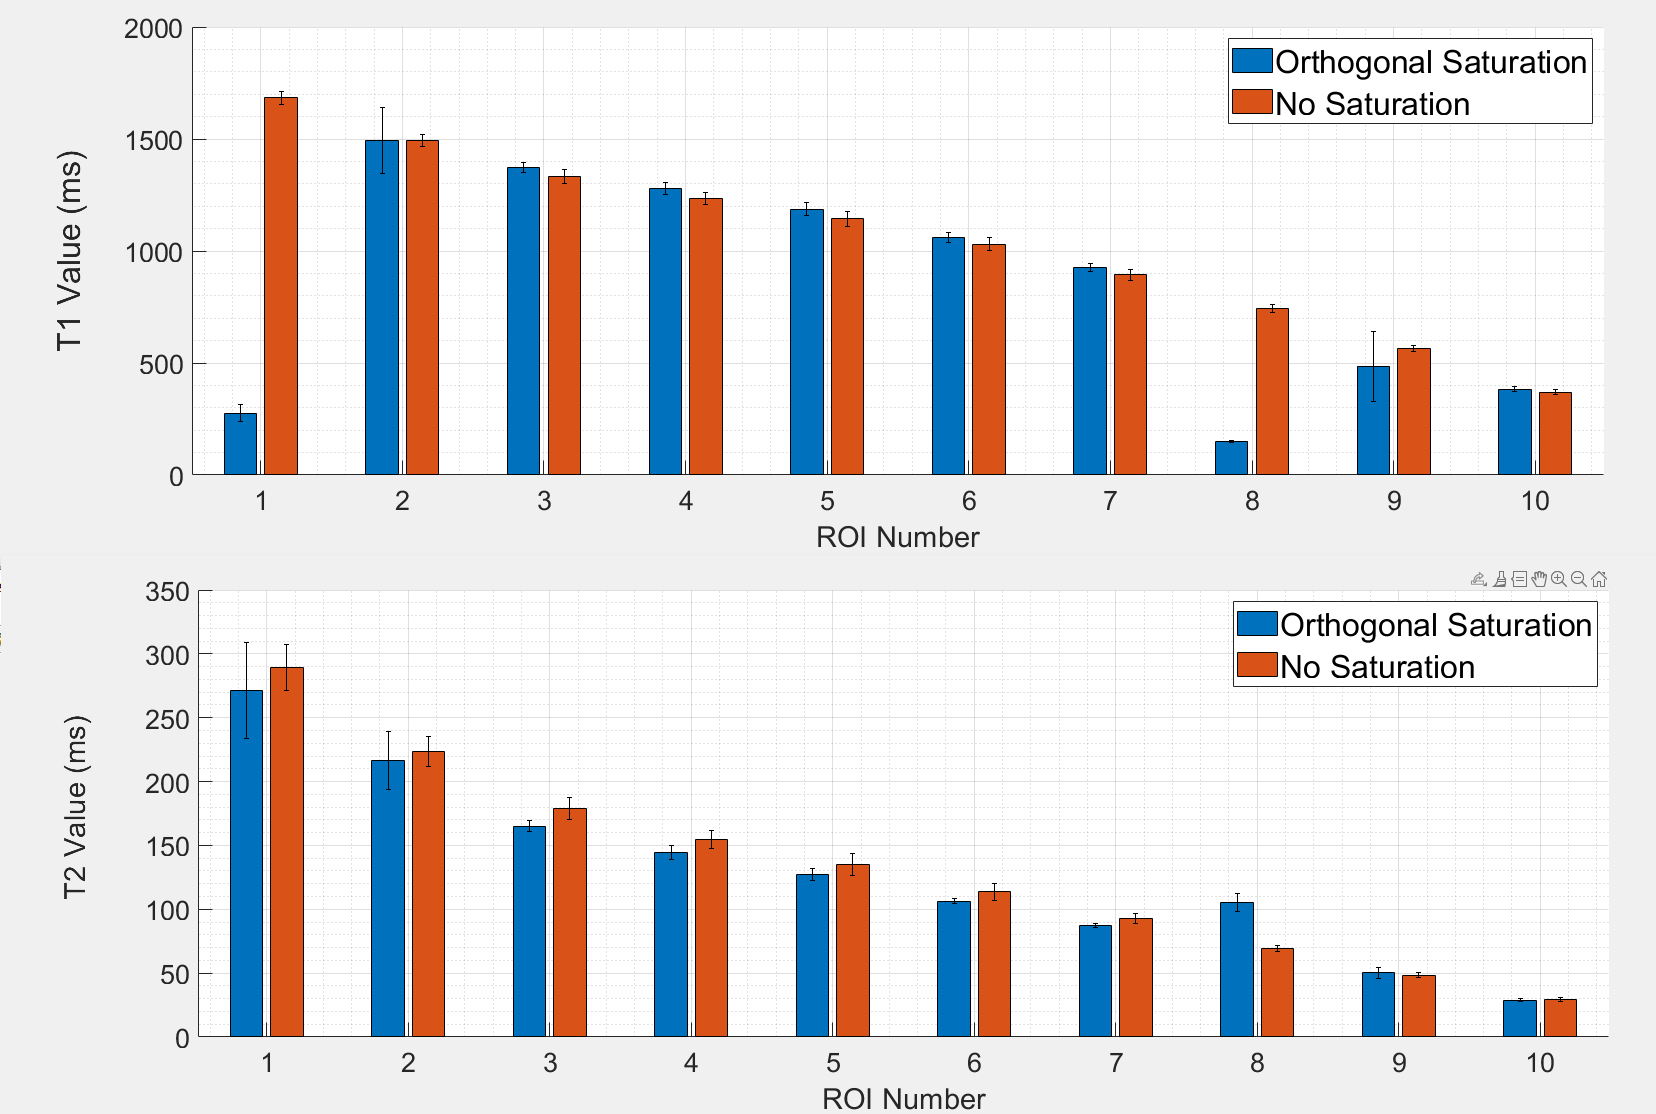
Figure 3 – Plot of T1 and T2 values for each cylinder with and without saturation with error bars of 1 standard deviation. T1 values are well diminished in the saturated cylinder 1 and 8. Partial saturation coverage of cylinders 2 and 9 result in an increased variance.
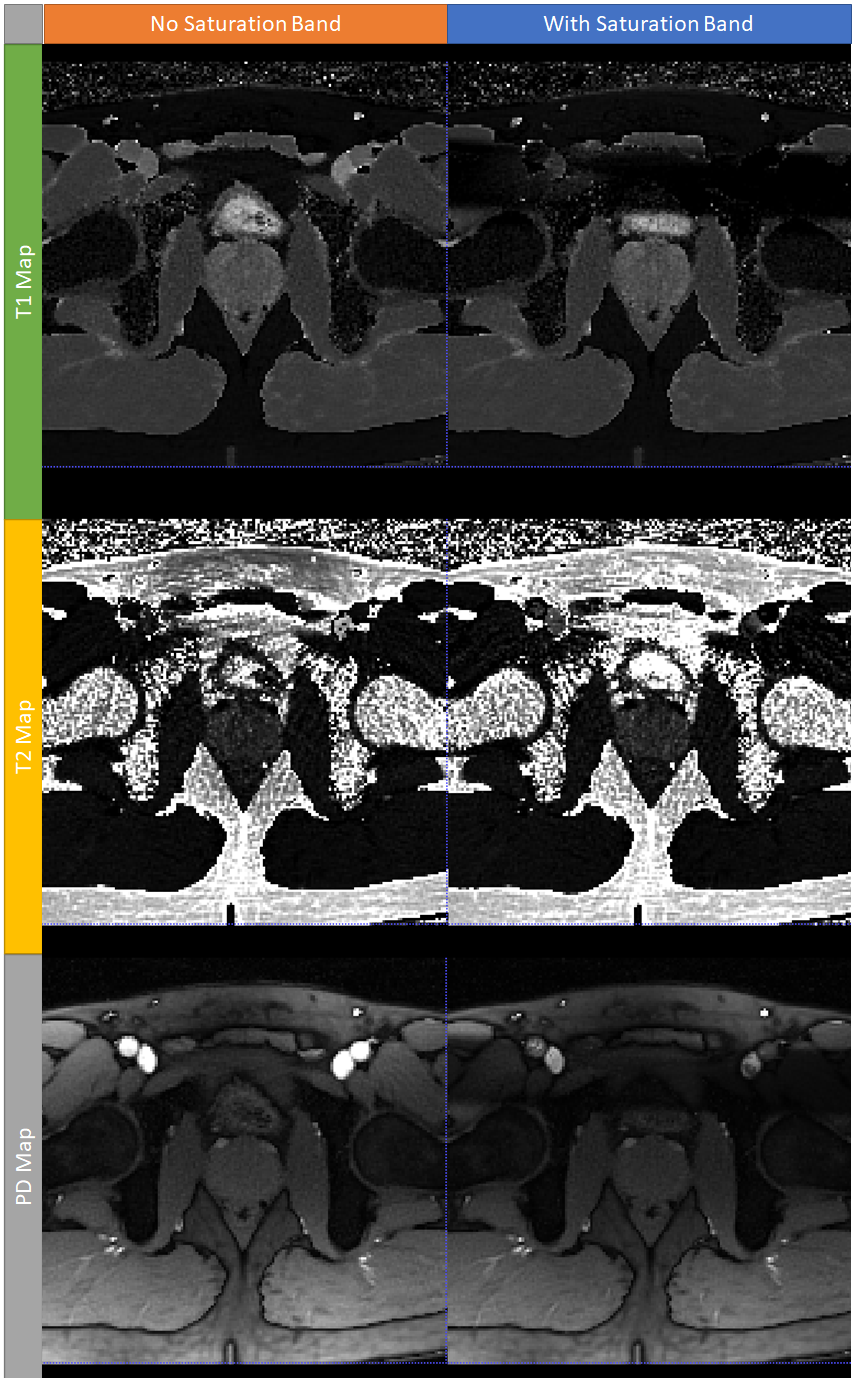
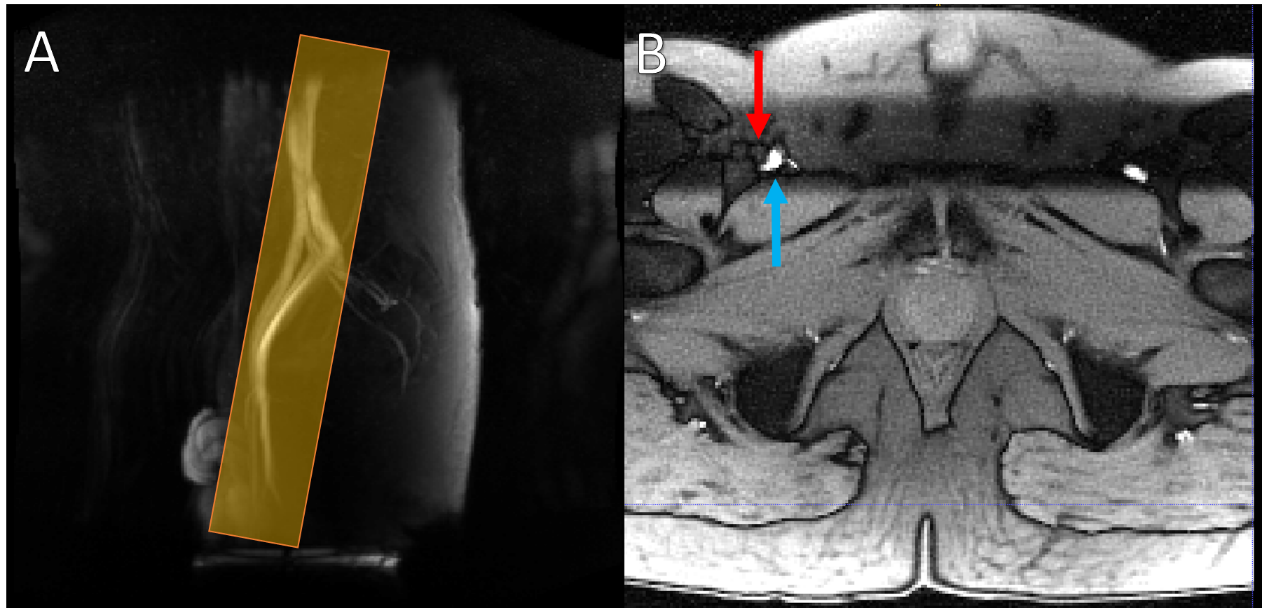
Figure 5 – A) An example of a vessel scout scan highlighting the femoral arteries. This guides placement of the saturation band (orange box) for the MR Fingerprinting scan. B) Axial proton density (PD) map produced by MR Fingerprinting with multiple saturation pulses per segment and balanced spoiler gradients. The saturated region is clearly visible in the upper portion of the image. The relatively bright femoral vein this image (blue arrow) implies effective saturation of the arteries (red arrow).