2592
Using 3D realistic blood vessel structures and machine learning for MR vascular Fingerprinting1Univ. Grenoble Alpes, Inserm, U1216, Grenoble Institut Neurosciences, GIN, 38000, Grenoble, France, 2Univ. Grenoble Alpes, Inria, CNRS, G-INP, 38000, Grenoble, France, 3MoGlimaging Network, HTE Program of the French Cancer Plan, Toulouse, France
Synopsis
MR vascular fingerprinting aims at mapping cerebral vascular properties such as blood volume and blood oxygenation. We propose to improve the technique by generating dictionaries based on 3D vascular networks segmented from whole brain high-resolution (3 µm isotropic) microscopy datasets. In order to compensate for the limited number of available data and long computing times, we used a machine-learning reconstruction process to generalize our results and tested our approach in healthy, stroke and tumor animal models. Our results show high quality maps with expected contrast and baseline values in healthy animals as well as expected trends in pathological tissues.
Introduction
MR vascular Fingerprinting1 (MRvF) proposes to use the Magnetic Resonance Fingerprinting2 (MRF) framework to map cerebral microvascular properties; namely the blood oxygenation saturation (SO2), blood volume fraction (BVf) and vessel averaged radius (R). Dictionaries are generated based on numerical voxels containing vascular structures and physiological parameters. The initial MRvF implementation used 2D synthetic vascular networks. In this study, we pursue previous work3,4 and use dictionaries based on 3D geometries, either created in silico (synthetic) or segmented from whole brain high resolution microscopy images. In order to compensate for the limited number of available data and long computing times, we use a machine-learning reconstruction process to generalize our results and test our approach in healthy, stroke and tumor animal models.Materials & Methods
Animal data:Data were acquired on a 4.7T Bruker system. The MRF acquisition pattern consists on the concatenation of two GESFIDE sequences acquired pre and post injection of USPIOs (P904, Guerbet, France, 200µmol Fe/kg)1. 26 animals were imaged:
- 8 healthy rats (Wistar)
- 9 rats (Fischer) implanted with 9L tumors, imaged 14 to 16 days after induction
- 9 rats (Sprague-Dawley) undergoing ischaemic stroke throughout acquisition
3 Dictionaries were generated on Matlab (The MathWorks Inc., Natick, Ma, USA) with the MRVOX software5.
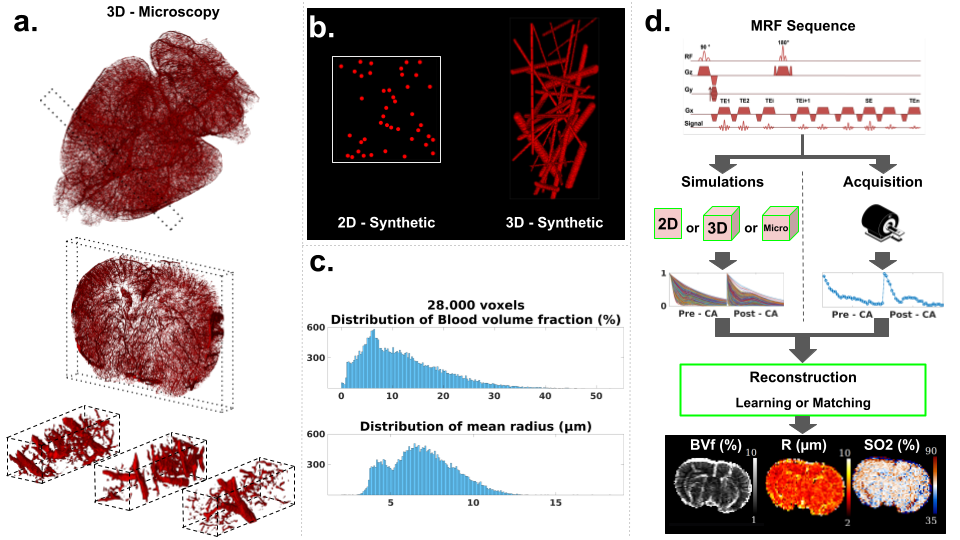
- Dictionary 3D micro.: Around 28,000 MRI-size voxels containing realistic vascular structures were extracted from whole brain high-resolution (3 µm isotropic) microscopy datasets6,7 using ImageJ (Rasband, W.S., NIH, Maryland, USA), Fig. 1a. Erosion transformations were performed to obtain continuous BVf and R distributions (see histograms in Fig. 1c. After assigning to each MRI-size voxel one SO2 and one T2 value in the range [35,90]% and [45, 110]ms, respectively, MR simulations including magnetic field estimation and water diffusion were performed to create the "3D microscopy" dictionary.
- Dictionaries 2D synth. and 3D synth.: Based on the previous histograms, 2D circles or 3D cylinders with gaussian distribution of radii (Fig. 1b) were generated to create the "2D synthetic" and "3D synthetic" dictionaries respectively.
All data were processed with Matlab using the MP3 software8. MRvF maps were created either using a standard direct matching ("MRvF Matching") between dictionaries entries and in vivo data, or using a dictionary learning tool9 ("MRvF Learning"). On top of MRvF results, maps of BVf, Vessel Size Index (VSI) and SO2 were also obtained with analytical models10. ROIs were manually defined in lesions and contralateral tissues. Paired Student’s tests were used to assess the significance of distributions difference, with a p-value of 5%. The whole pipeline is presented on Fig. 1d.
Results
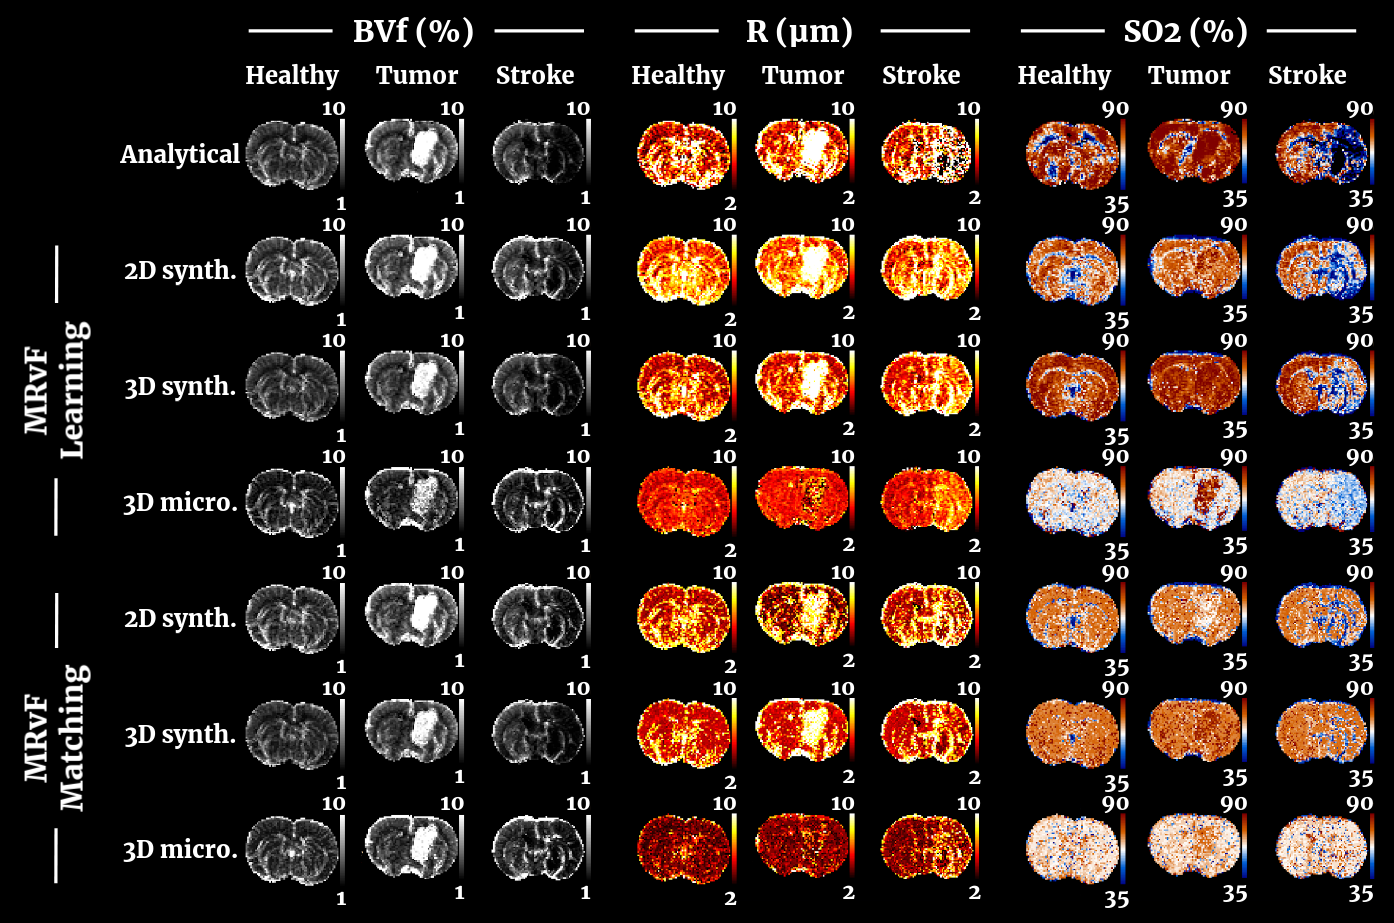
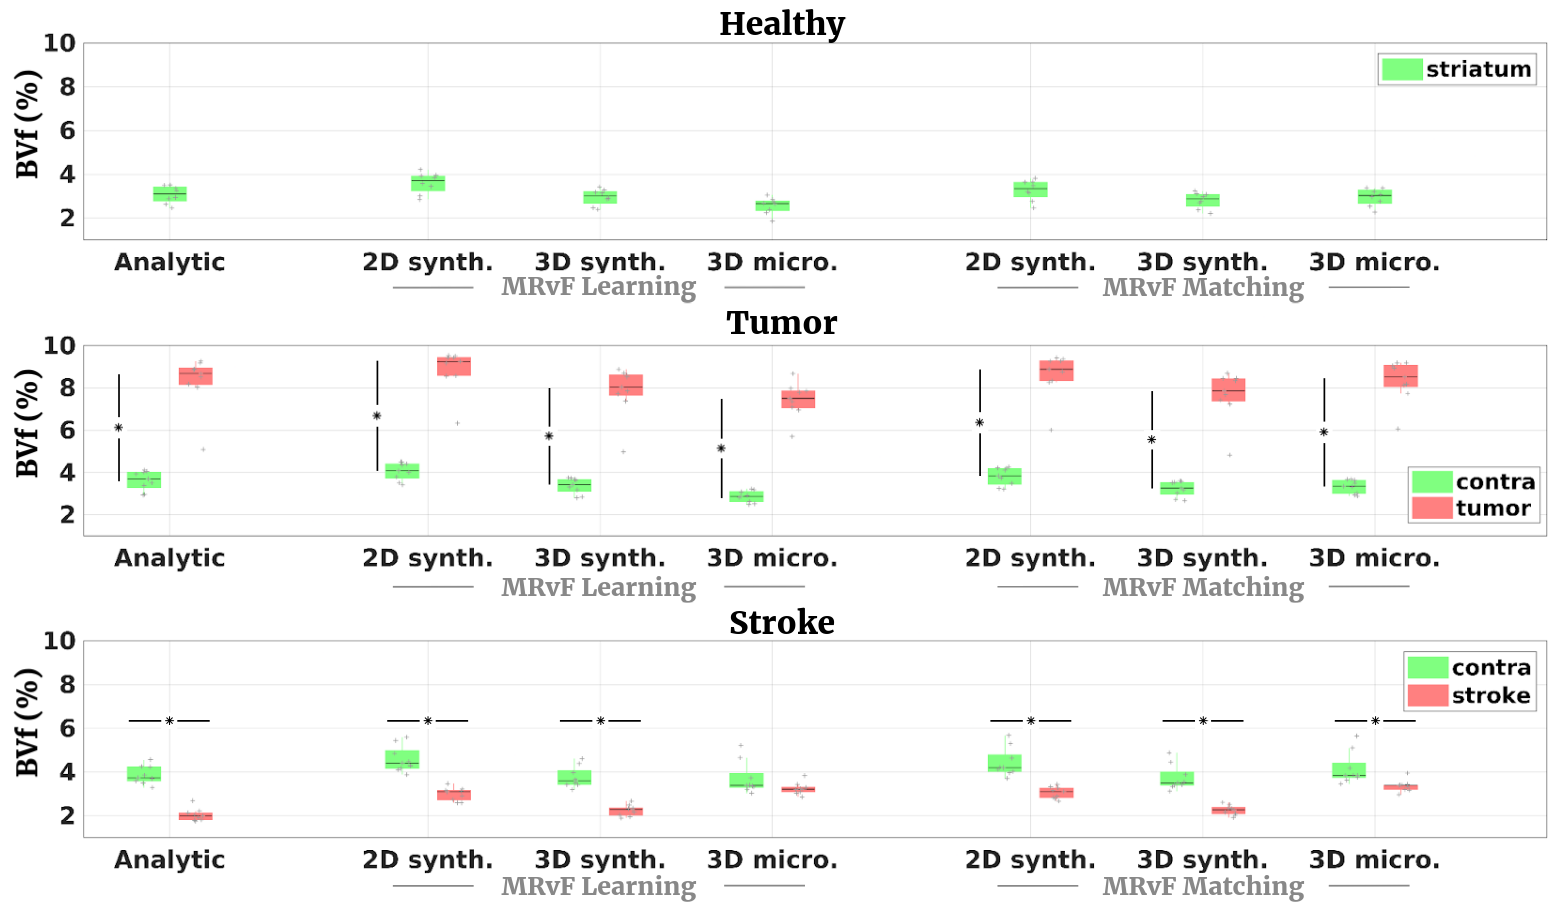
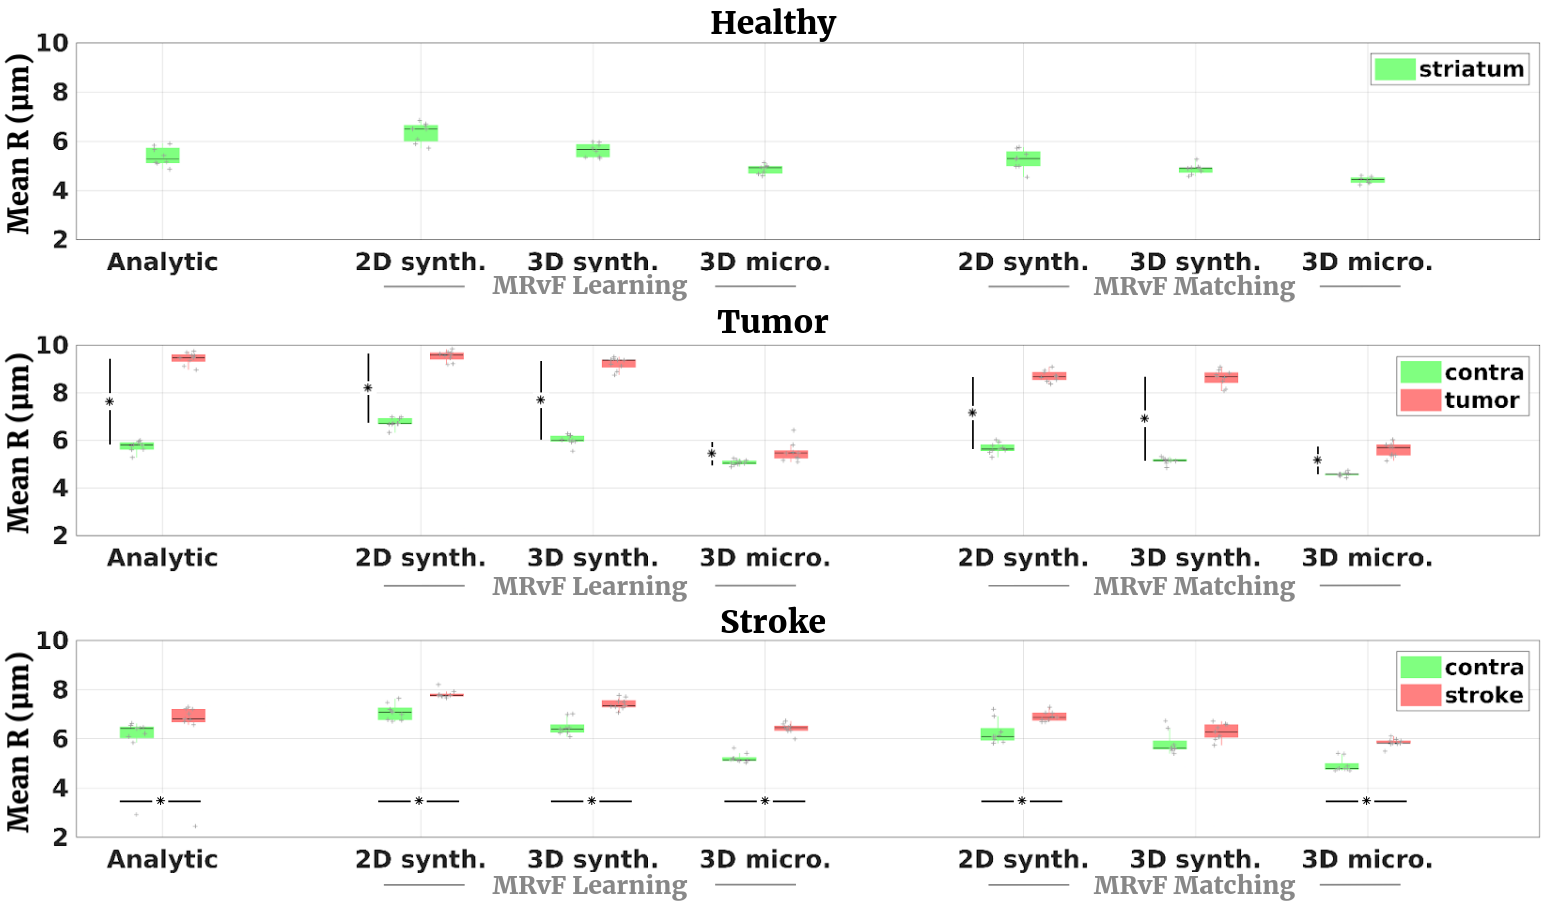
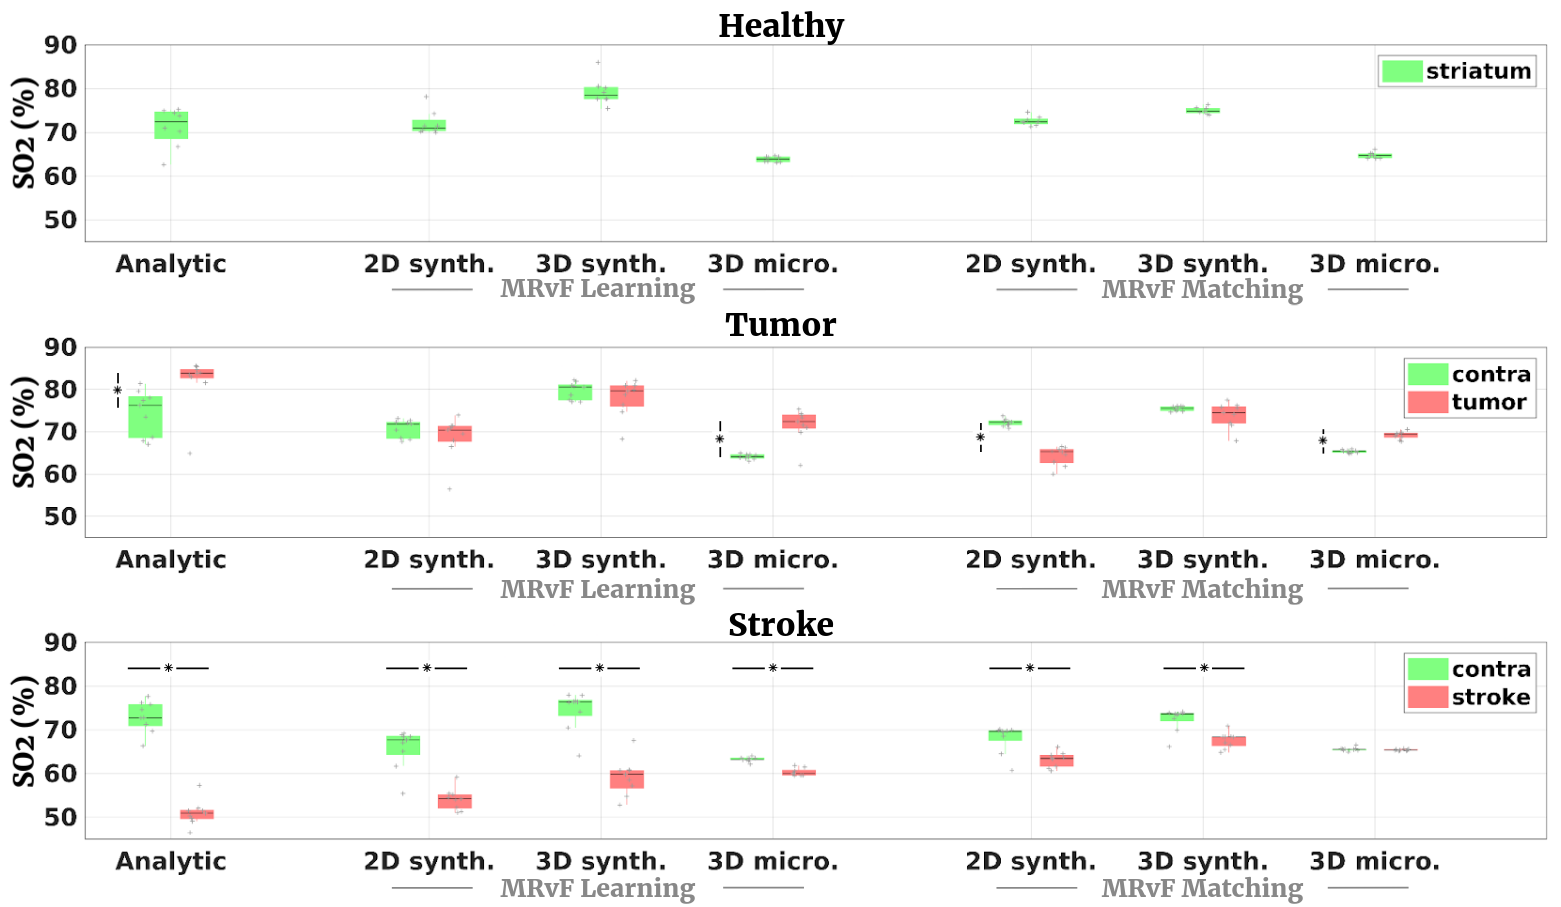
Fig 2 shows examples of maps obtained with the different approaches in one representative animal of each group. Fig 3, 4 and 5 present the numerical results obtained in all animals for BVf, R and SO2, respectively. It can be seen that without any prior on the estimates, all the MRvf approaches provide high quality maps with expected contrast and baseline values in healthy animals (3% < BVf < 5% , 4µm < R < 6µm, and 60% < SO2 < 80% in healthy tissue).Dictionary learning seems however necessary as it reveals lesions that are unseen with direct matching (see SO2 maps in stroke animal with 3D micro approach). After learning, most trends between healthy and pathological tissue are in line with literature reports and similar between dictionaries (increase of BVf and R in tumors, decrease of BVf/SO2 and increase of R in stroke). For all dictionaries, the T2 measurements (not shown) are also in line with expectations and follow the same trend in all dictionaries (about 60ms in healthy tissue, 20ms increase in tumor, 5ms decrease in stroke). The dictionaries yielded different results in a few particular cases such as in the 9L tumors that appear hyperoxic with the 3D Micro dictionary, but normoxic with the synthetic geometries. These findings warrant further investigation with complimentary oxygenation measurements.
Conclusions
This study demonstrates the feasibility of using 3D realistic vascular structures in the MRvF framework and the possibility to obtain high quality maps after dictionary learning in both healthy and pathological brains. It is possible that adding realistic pathological vascular structures in the dictionaries will further improve the results in lesions. This work also opens the possibility to perform MRvF in voxels containing closed vascular networks, allowing for the simulation of blood flow and oxygen variations along the vessels.Acknowledgements
The MRI facility IRMaGe is partly funded by the French program “Investissement d’avenir” run by the French National Research Agency, grant “Infrastructure d’avenir en Biologie et Santé”. [ANR-11-INBS-006]
Project supported by ANR MRFUSE [ANR-20-CE19-0030]
References
1. T. Christen et al., "MR vascular fingerprinting: A new approach to compute cerebral blood volume, mean vessel radius, and oxygenation maps in the human brain", NeuroImage, vol. 89, p. 262‑270, avr. 2014, doi: 10.1016/j.neuroimage.2013.11.052.
2. D. Ma et al., "Magnetic resonance fingerprinting", Nature, vol. 495, no. 7440, pp. 187–192, Mar. 2013, doi: 10.1038/nature11971.
3. A. Delphin, et al., "Towards optimizing MR vascular fingerprinting", ISMRM & SMRT Virtual Conference & Exhibition, May 2021, Vancouver, Canada. (hal-03259368)
4. P. Pouliot et al., "Magnetic resonance fingerprinting based on realistic vasculature in mice", NeuroImage, 2017
5. N. A. Pannetier et al., "A Simulation Tool for Dynamic Contrast Enhanced MRI", 2013. https://journals.plos.org/plosone/article?id=10.1371/journal.pone.0057636 (accessed Oct. 10, 2019).
6. A. P. Di Giovanna, "Whole-brain vasculature reconstruction at the single capillary level", Harvard Dataverse, 2018, https://dataverse.harvard.edu/dataverse/mouse-brain_vasculature
7. M.I. Todorov et al., "Machine learning analysis of whole mouse brain vasculature", Nat Methods 2020
8. C. Brossard et al., "MP3: Medical Software for Processing Multi-Parametric Images Pipelines", Front. Neuroinform., vol. 14, 2020, doi: 10.3389/fninf.2020.594799.
9. F. Boux et al., "Bayesian Inverse Regression for Vascular Magnetic Resonance Fingerprinting", in IEEE Transactions on Medical Imaging, vol. 40, no. 7, pp. 1827-1837, July 2021, doi:10.1109/TMI.2021.3066781.
10. B. Lemasson et al., "MR Vascular Fingerprinting in Stroke and Brain Tumors Models", Sci Rep 6, 37071 (2016). https://doi.org/10.1038/srep37071
Figures