2591
Searching for an MR Fingerprinting sequence to measure brain oxygenation without contrast agent1Univ. Grenoble Alpes, Inserm, U1216, Grenoble Institut Neurosciences, GIN, Grenoble, France, 2MoGlimaging Network, HTE Program of the French Cancer Plan, Toulouse, France
Synopsis
We propose to use numerical simulations and Monte Carlo approaches to test 40 MR fingerprinting sequences for their ability to quantify the BOLD effect and provide maps of baseline blood oxygen saturation without the need for contrast agent injection. Our results suggest that several sequences can produce SO2 maps with less that 3% error on average even in the presence of B1 and B0 inhomogeneities. T2 and blood vessel radius could also be estimated with the same acquisitions.
Introduction
The Magnetic Resonance Fingerprinting1 (MRF) framework has opened the possibility to use unconventional MR sequences (such as random succession of FA and TR) for tissue relaxometry. This type of approach should also be suited to quantify the BOLD effect as it has been shown that balanced SSFP sequences and their transient-states are highly sensitive to magnetic fields inhomogeneities2. Following our previous work on vascular MRF3, we propose to use these types of sequences to obtain blood oxygenation saturation maps without the need for contrast agent injection. We used numerical simulations and a Monte Carlo method4 to assess the efficiency of numerous MRF sequences based on 3 types of acquisitions (1) bSSFP with acquisition of transient-state (2) bSSFP with oscillations of RF phases (OSSI5), in order to shift frequency offset patterns, and (3) succession of random TR and FA. Our numerical results suggest that several MRF sequences can produce SO2 maps with less that 3% error on average. T2 and blood vessel radius could also be estimated with the same acquisitions.Materials and methods
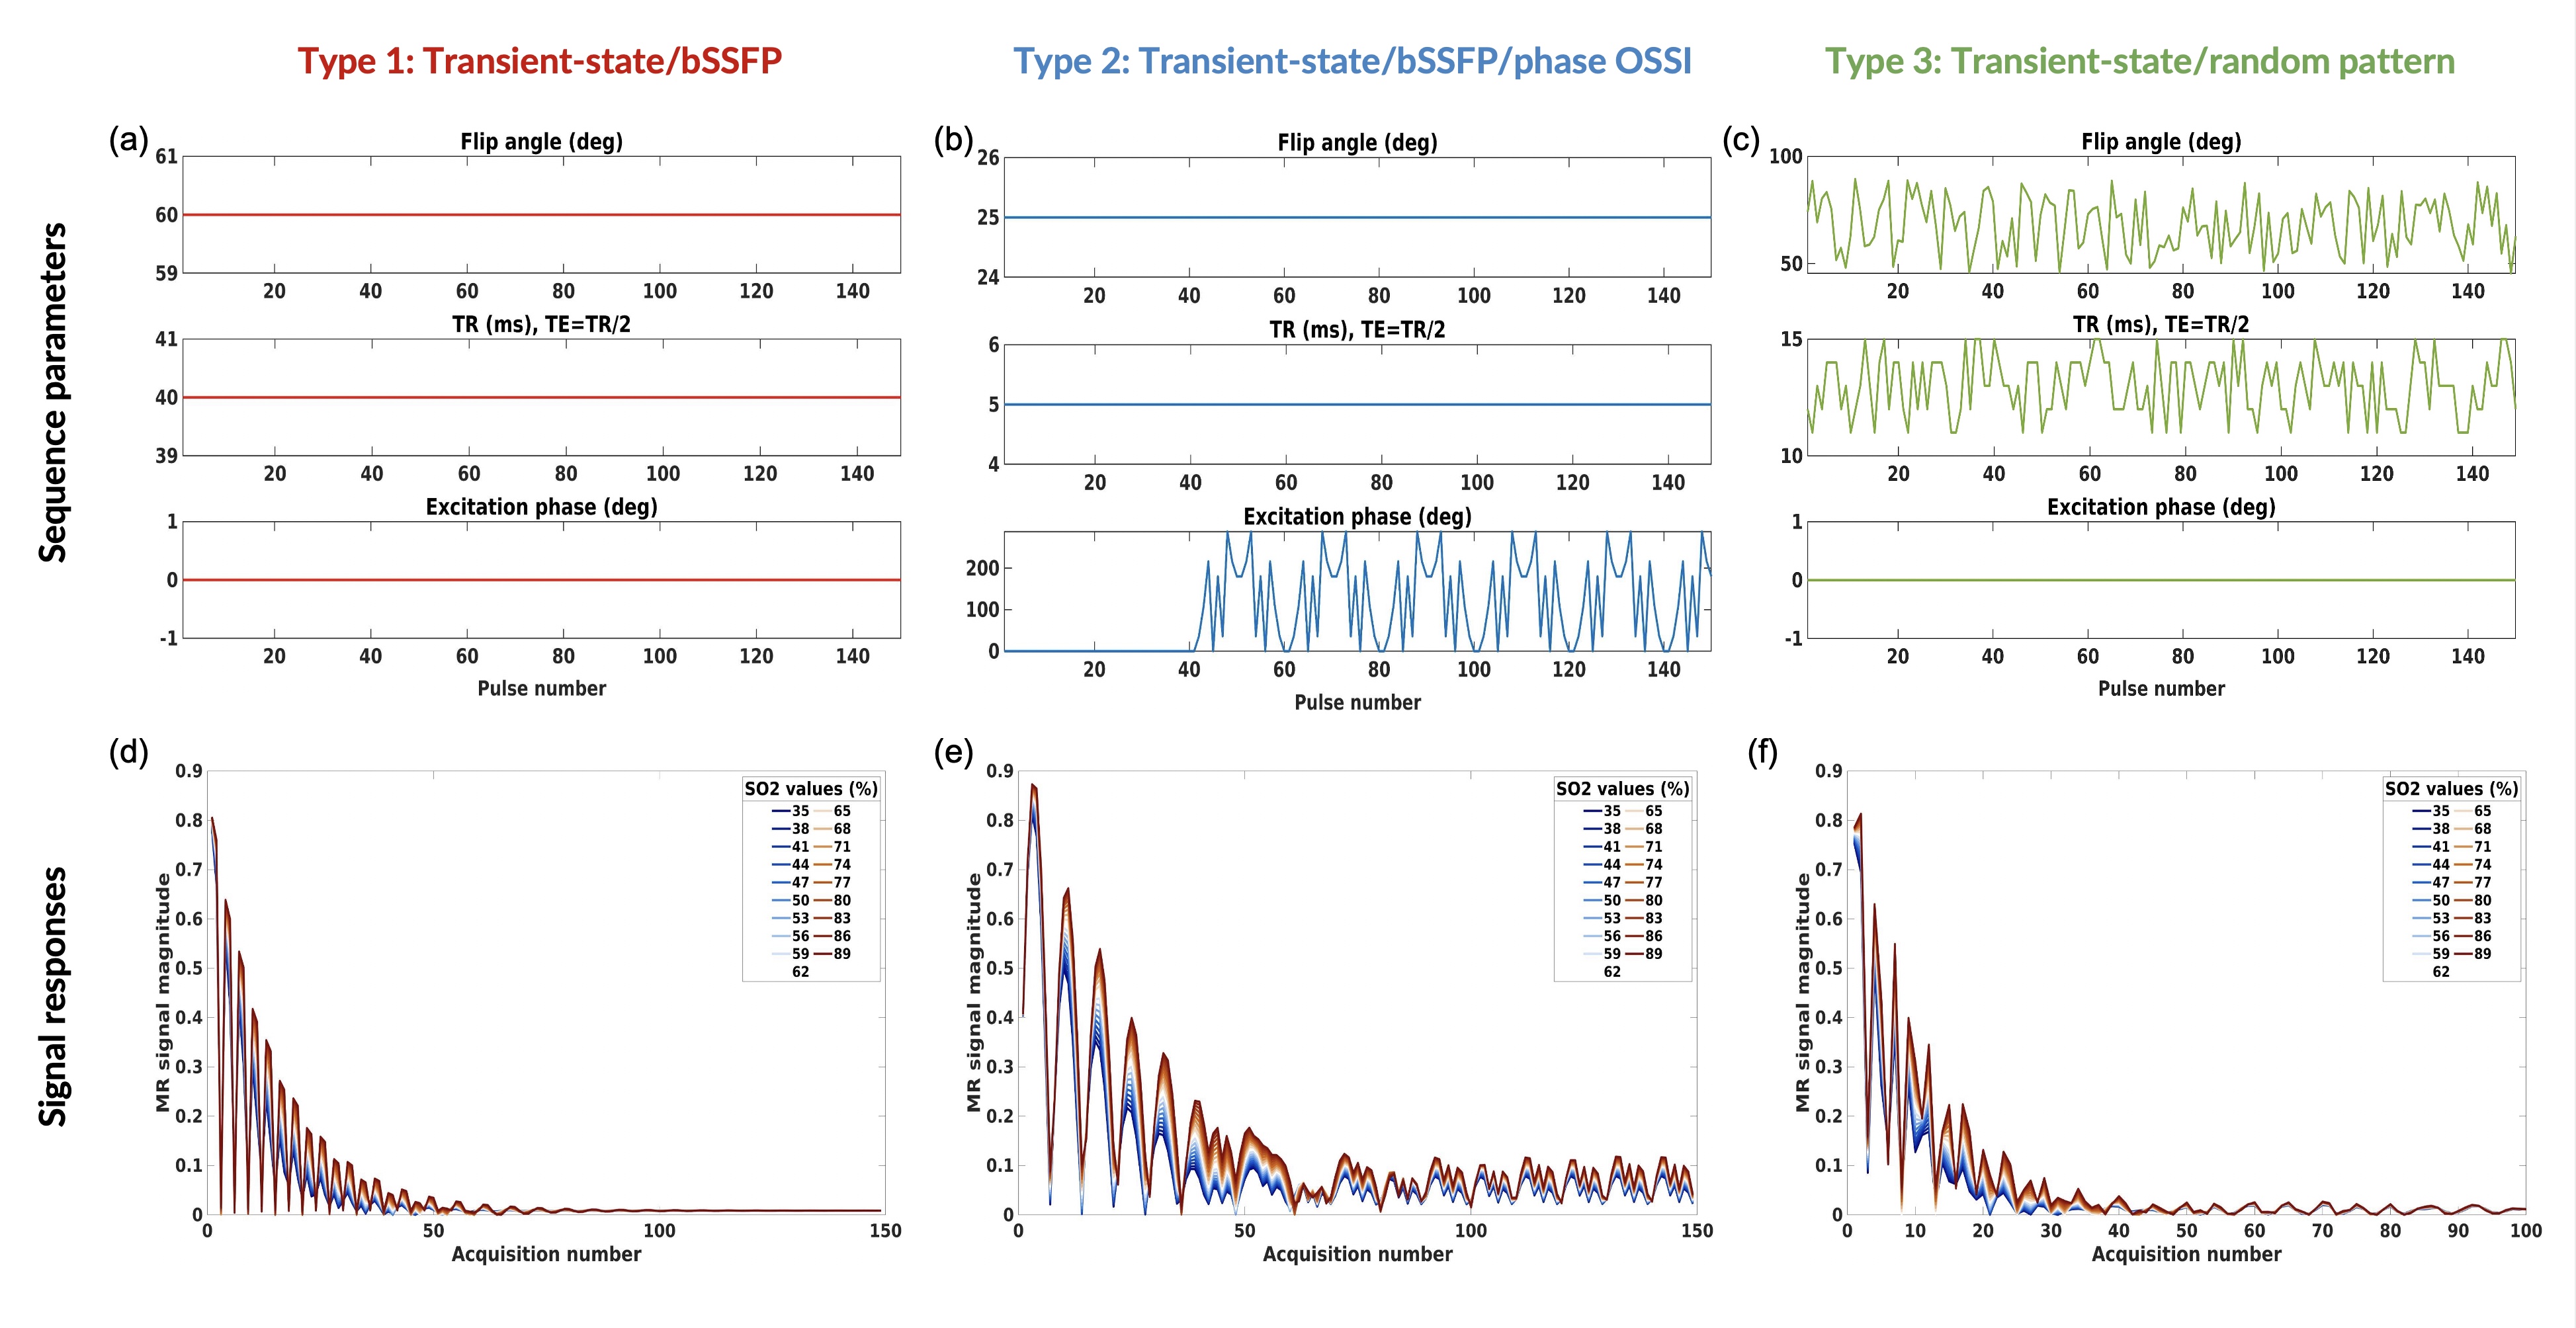
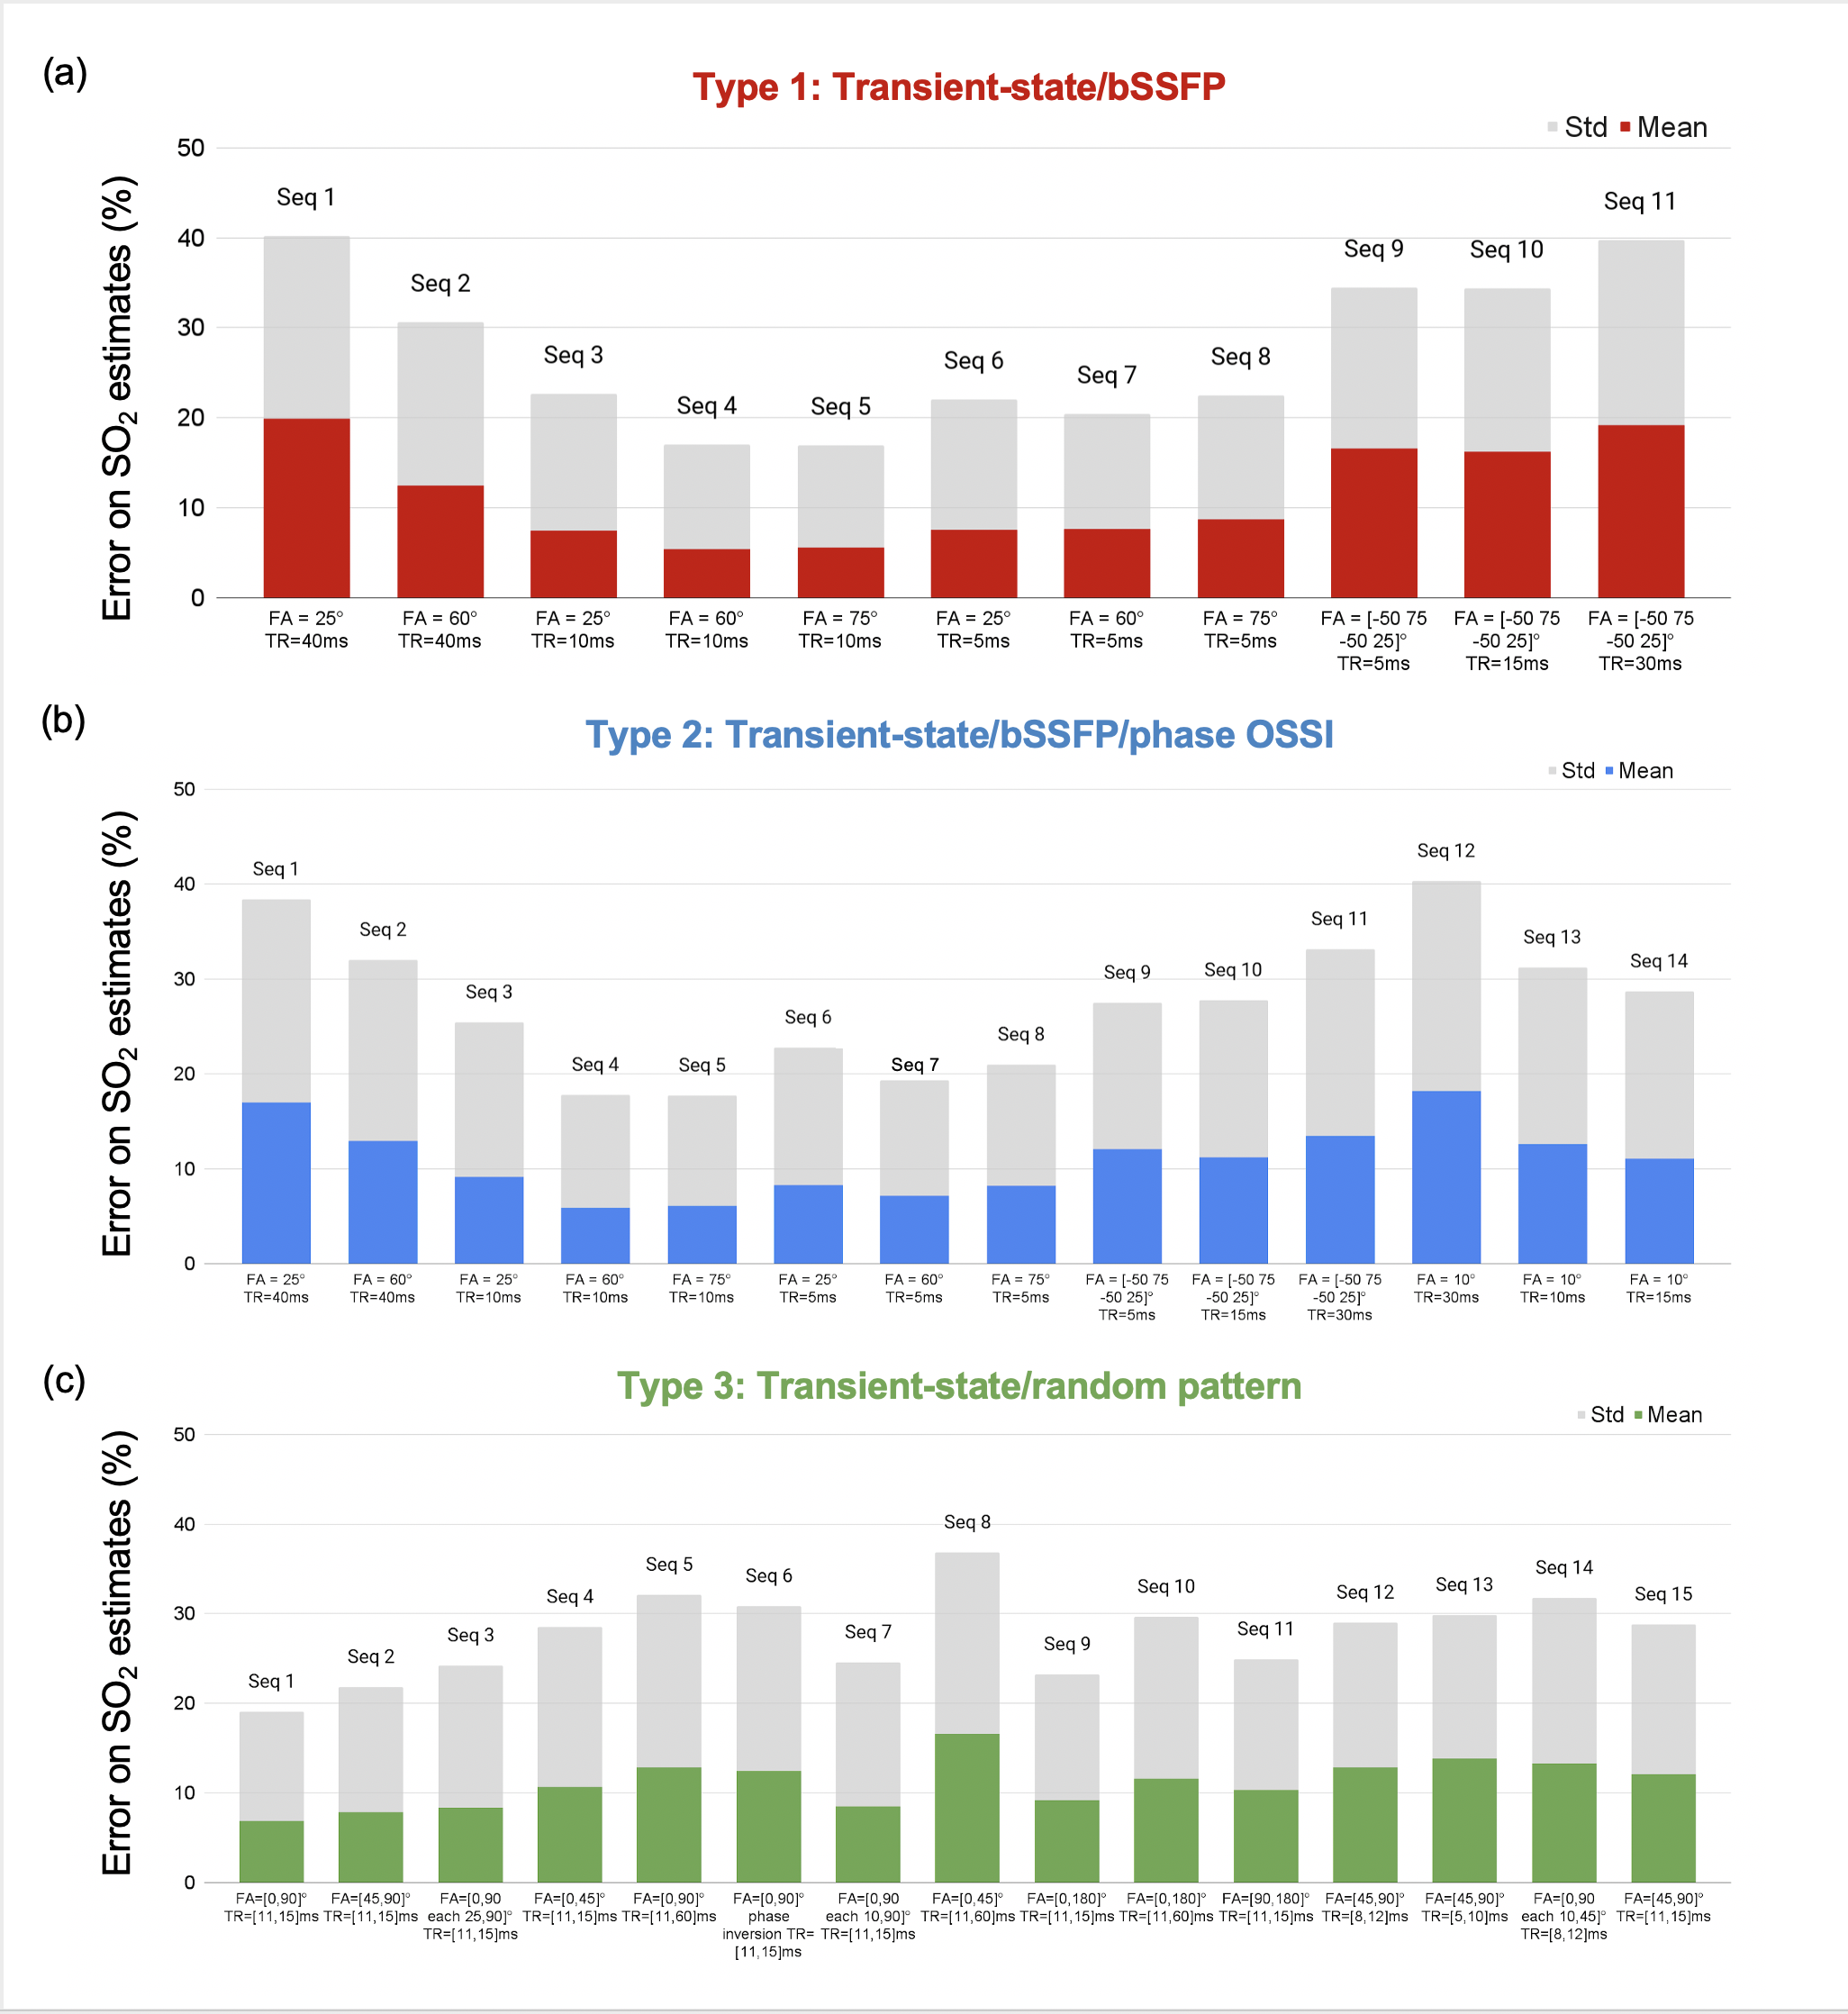
All simulations were performed on Matlab (The MathWorks Inc., Natick, Ma, USA) with the MRVOX software6. Blood vessels were modelled in 2D with uniform oxygenation. Variations of Blood Volume fraction (BVf [1,10]%), mean vessel radius (R [2,10]µm), blood oxygen saturation (SO2 [35,90]%) and T2 ([40,110]ms) were considered to create the MRF dictionaries. For 2 particular sequences (see below), variations of B1 ([0.7,1.3]) and B0 offset frequencies ([0,75]Hz) were added.3 types of sequences were tested (150 pulses each):
- Type 1 (transient-state/bSSFP): constant FA, TR, TE=TR/2, no phase cycling, Fig. 1a 1d.
- Type 2 (transient-state/bSSFP/phase OSSI): constant FA, TR, TE=TR/2, no phase cycling for 40 pulses, followed by 110 pulses with a phase cycling5 to establish an oscillating steady-state, Fig. 1b 1e.
- Type 3 (transient-state/random pattern): Random FA, random TR, TE=TR/2, no phase cycling, Fig. 1c, 1f.
Results
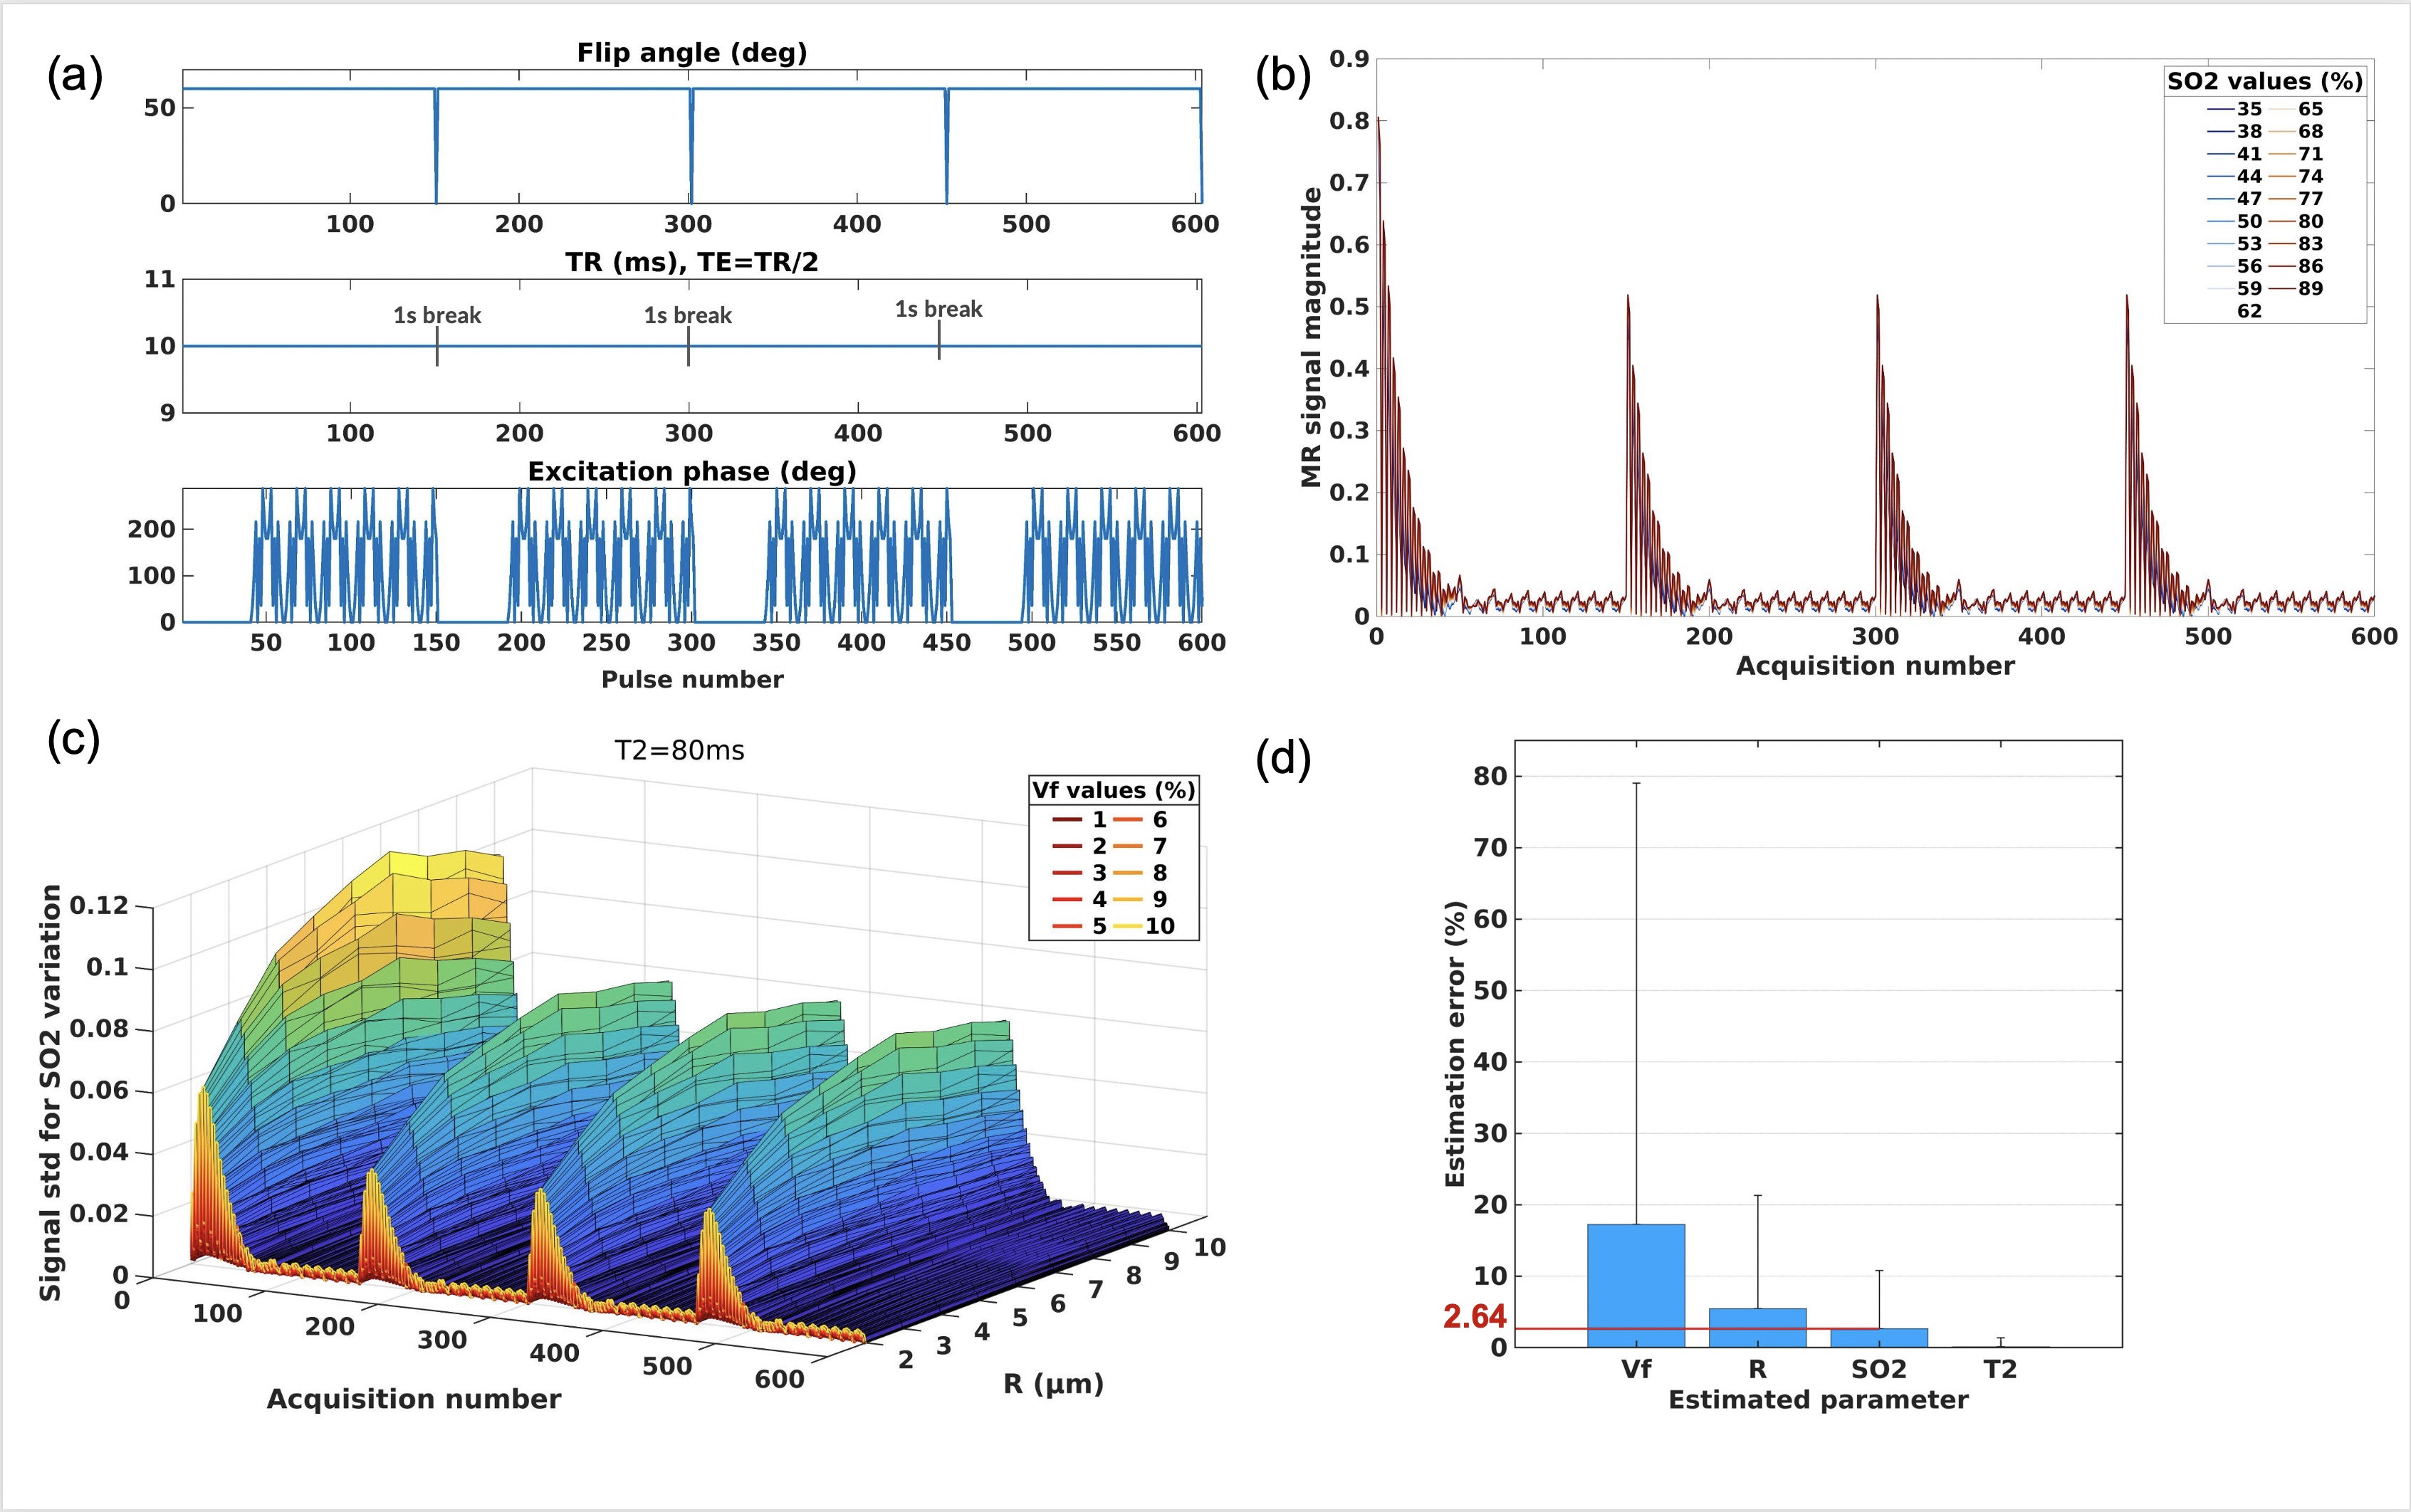
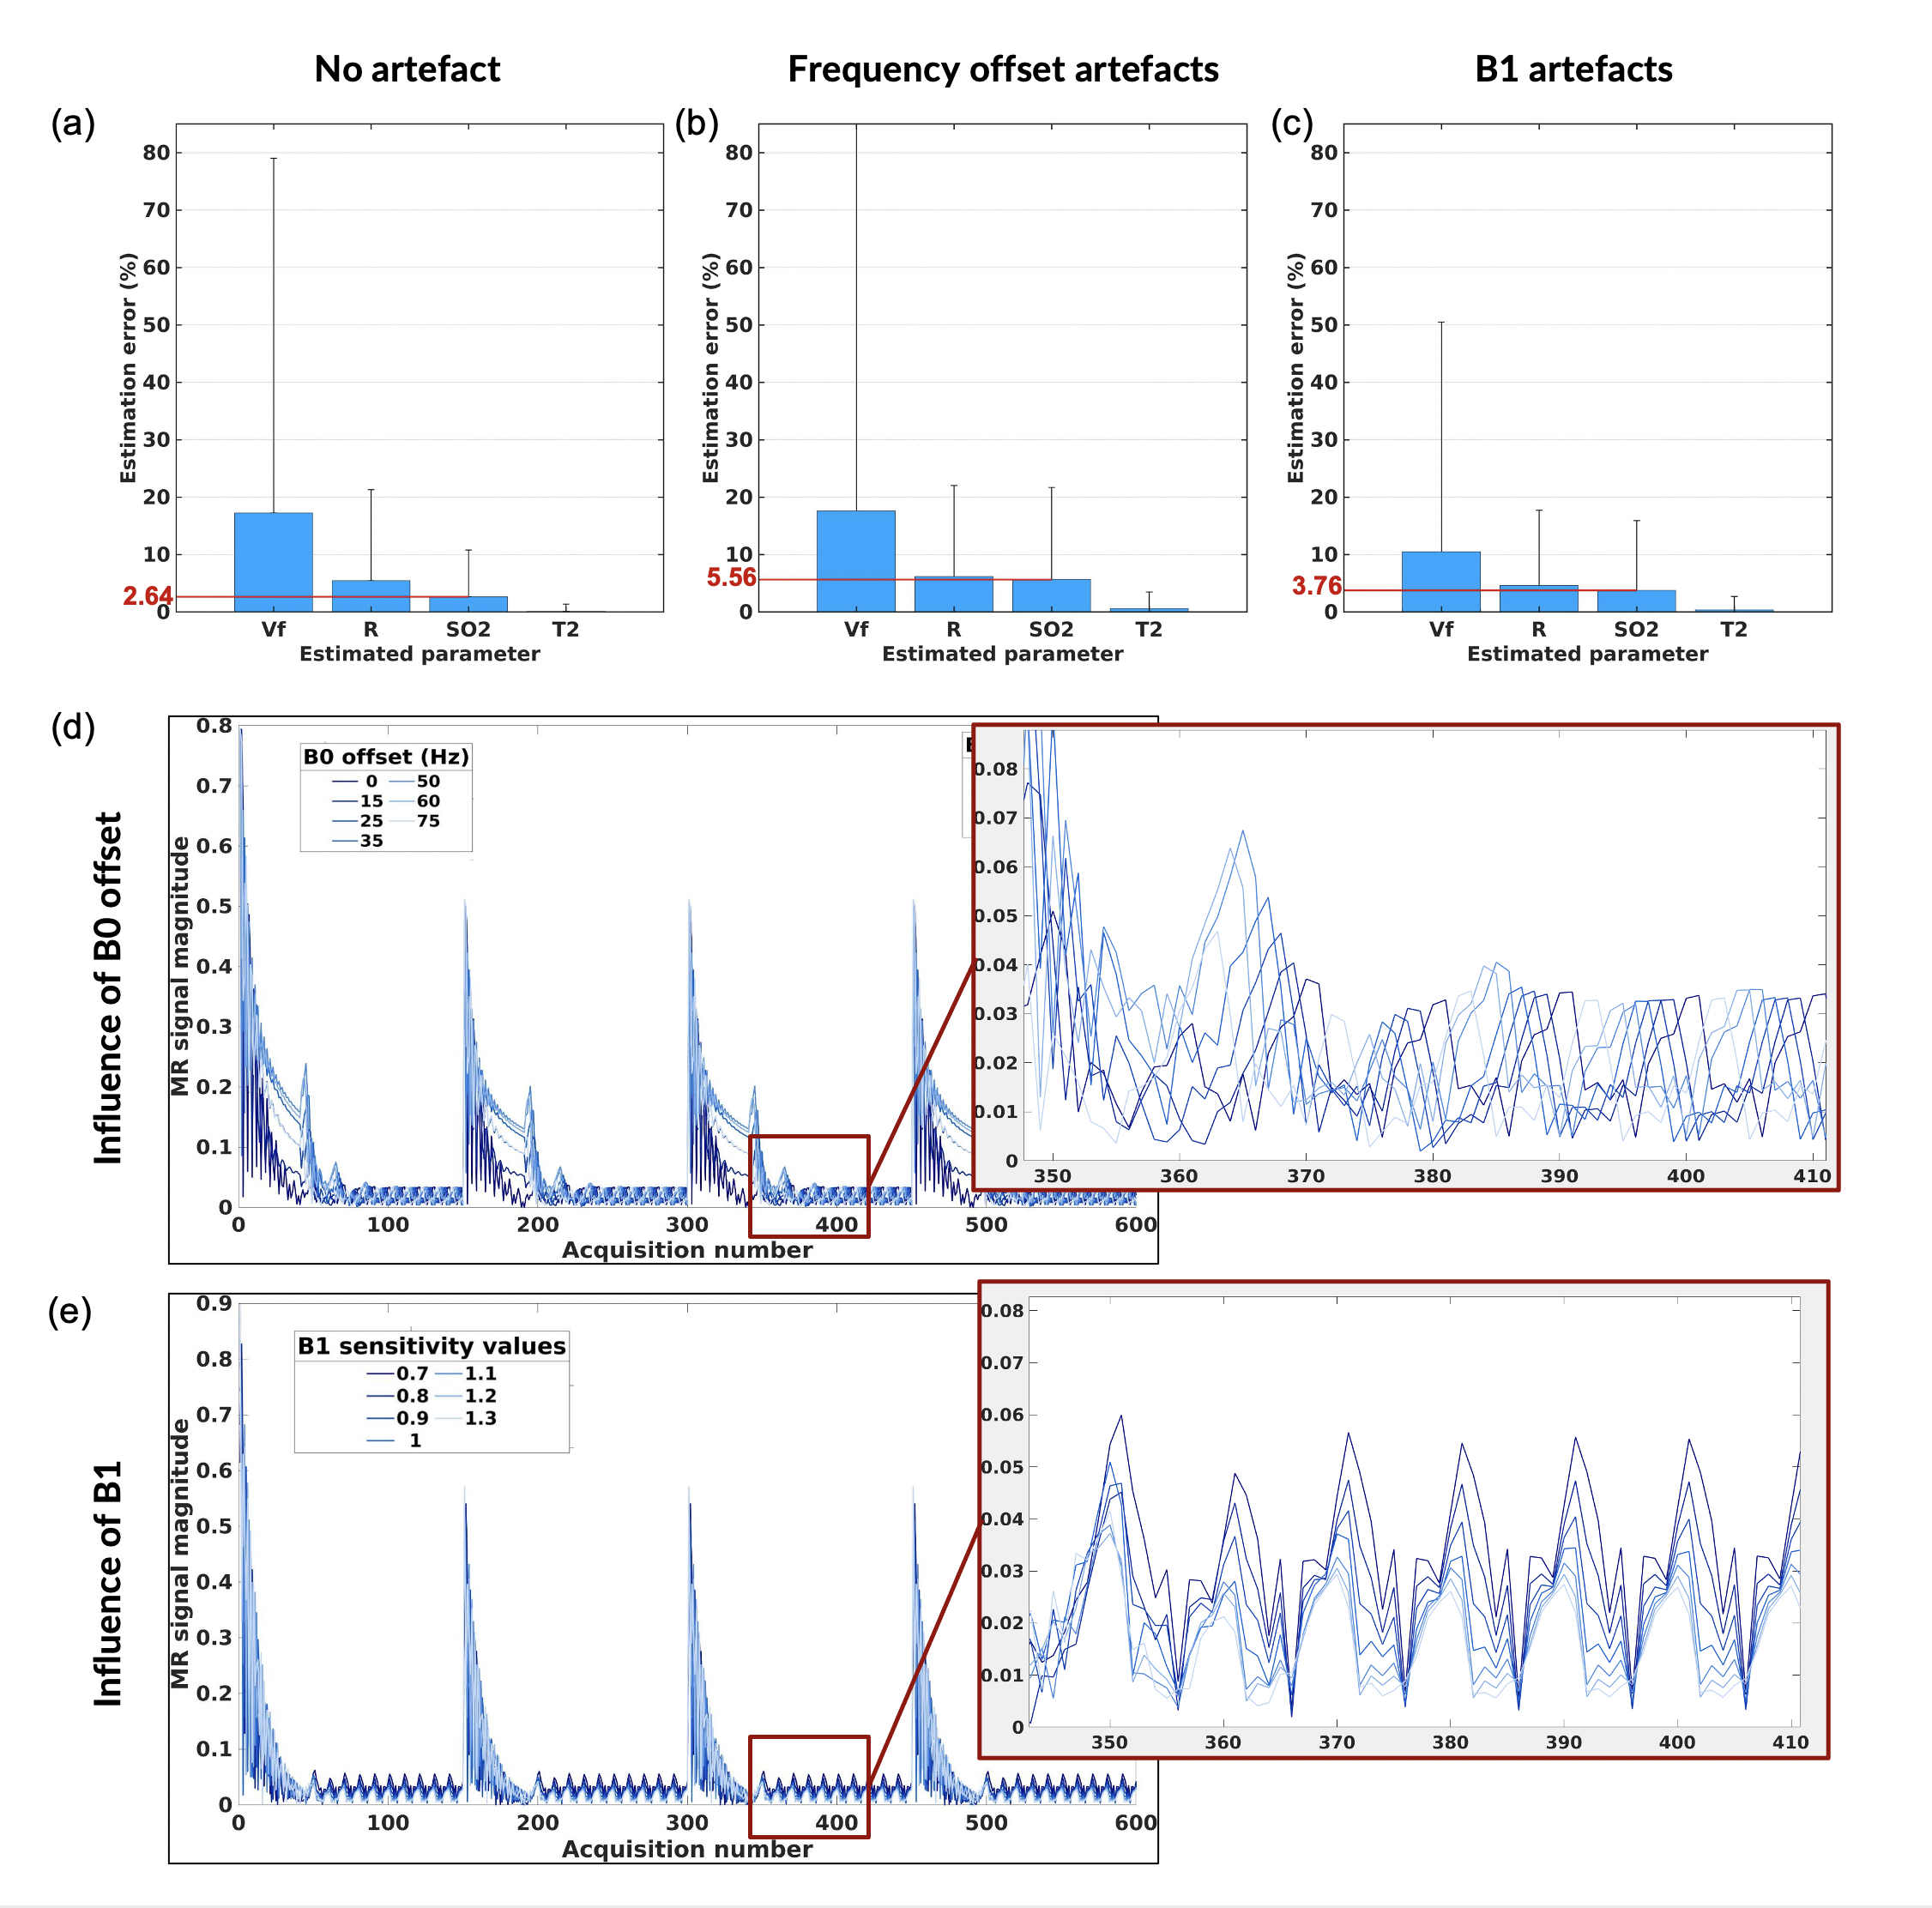
Fig. 1 shows examples of sequence diagrams as well as signal evolutions for the 3 types of sequences tested. One can notice the different signal responses to different SO2 baseline values (blue to red colors), highlighting the importance of the transient-state in terms of SNR and sensitivity. Amongst all the MR sequences tested (Fig. 2), several combinations of parameters seemed to provide acceptable (<10% average) errors on SO2 estimates, and 2 particular candidates (Type2:Seq4 and Type3:Seq1) were chosen (based on overall error and signal evolutions) for further evaluation. Sequence diagrams and signal responses to SO2 variations are shown in Fig. 3 for Type2:Seq4. The initial pattern was repeated 4 times in order to reduce the influence of low SNR in the steady-state part of the signal, leading to an acquisition time of 9s per slice. 3D plots of signal standard deviations under variation of SO2, for different values of BVf and R, are also shown to highlight the cross-talk between the dimensions of the dictionary. Finally, it can be seen that the MC approach predicts low errors for SO2 and T2 estimates as well as acceptable estimates of blood vessel radius for this particular pattern. Similar results were obtained for the random pattern Type3:Seq1 (not shown). New simulations were performed in order to test the sensitivity of the 2 sequences to B1 and B0 offset artefacts. Results are presented in Fig. 4, where it can be seen that Type2:Seq4 still performs well under such conditions with only a small increase in SO2 error due to B0 offset. Signal variations (Fig. 4 d-e) are also shown to highlight the changes of patterns due to the 2 new dimensions. Results obtained with Type3:Seq1 were more impacted by B1 artefacts with 10% average error on SO2 estimates and concomitant increase in standard deviation.Conclusion
According to numerical simulations, several MRF sequences should be able to provide accurate measurements of baseline blood oxygenation saturation without the need for contrast agent injection and in a clinically acceptable scan time. While it is not easy to automatically optimize vascular MRF sequences due to the computational load of the numerical simulations (magnetic susceptibility effects + water diffusion + relaxation in a fine microvascular geometry), new optimization approaches could further improve the sequence's efficiencies7. In vivo data are now required to eventually validate our findings.Acknowledgements
Project supported by ANR MRFUSE [ANR-20-CE19-0030]References
1. D. Ma et al., "Magnetic resonance fingerprinting", Nature, vol. 495, no. 7440, pp. 187–192, Mar. 2013, doi: 10.1038/nature11971.
2. C. Ganter, (2004), Off-resonance effects in the transient response of SSFP sequences. Magn. Reson. Med., 52: 368-375. https://doi.org/10.1002/mrm.20173
3. A. Delphin, et al., "Towards optimizing MR vascular fingerprinting", ISMRM & SMRT Virtual Conference & Exhibition, May 2021, Vancouver, Canada. (hal-03259368)
4. K. Sommer et al. Towards predicting the encoding capability of MR fingerprinting sequences. Magn Reson Imaging. 2017
5. S. Guo et al. Oscillating steady‐state imaging (OSSI): A novel method for functional MRI. Magn Reson Med. 2020
6. N.A. Pannetier et al. A Simulation Tool for Dynamic Contrast Enhanced MRI. PlosOne. 2013
7. S.P. Jordan et al., Automated design of pulse sequences for magnetic resonance fingerprinting using physics-inspired optimization, PNAS 2021
Figures